

Key Insights
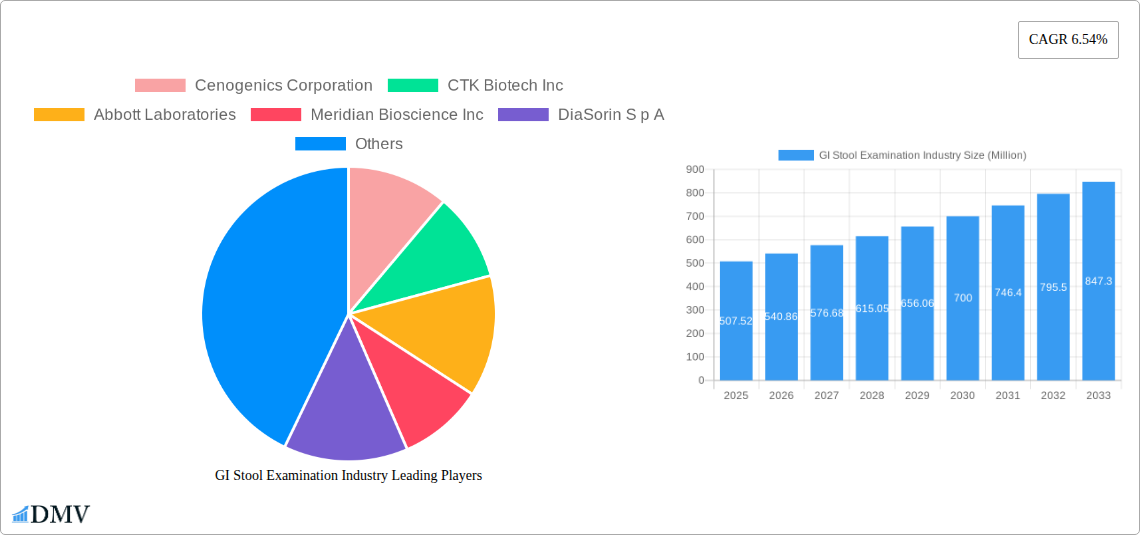
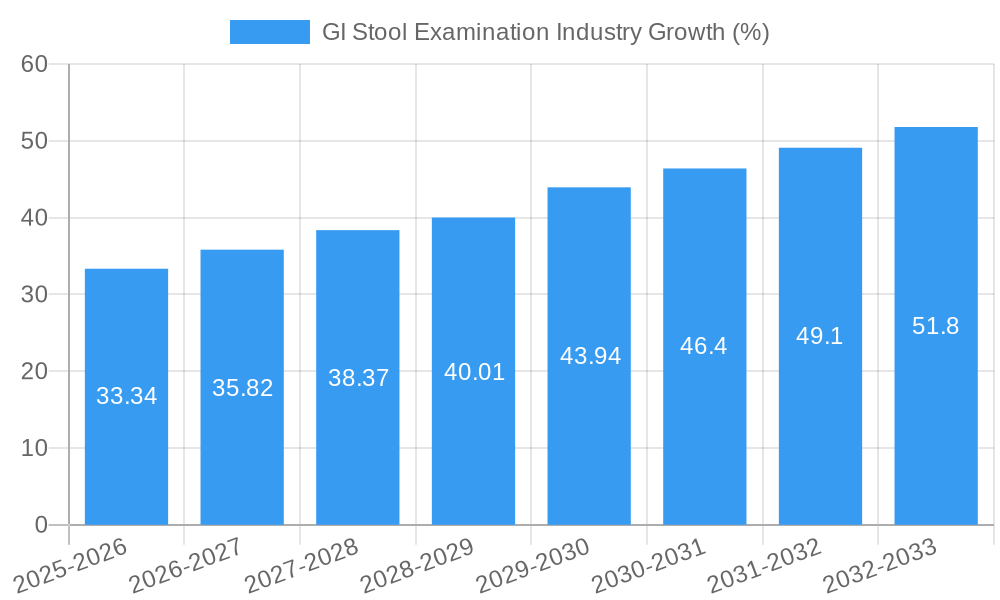
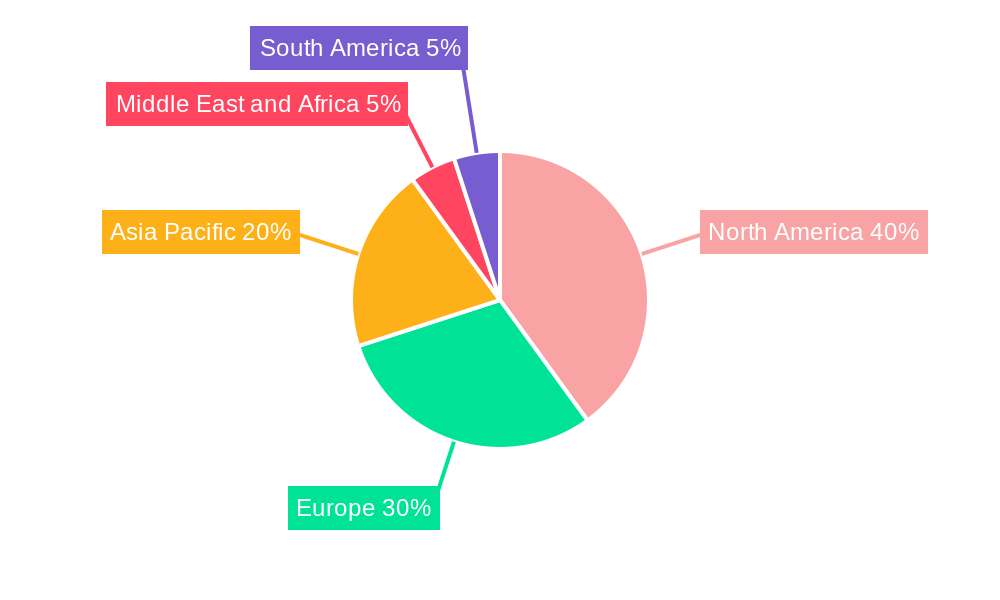
The global GI Stool Examination market, valued at $507.52 million in 2025, is projected to experience robust growth, driven by increasing prevalence of gastrointestinal disorders, advancements in diagnostic technologies, and rising healthcare expenditure globally. The market's Compound Annual Growth Rate (CAGR) of 6.54% from 2025 to 2033 indicates a significant expansion, with the market size expected to surpass $850 million by 2033. Key drivers include the growing demand for non-invasive diagnostic techniques, the increasing adoption of point-of-care testing, and the rising awareness among patients regarding early detection and prevention of gastrointestinal diseases. Market segmentation reveals a strong demand across various test types, including occult blood tests, ova and parasites tests, bacteria tests, and fecal biomarker tests. The Instruments segment within Product Type holds a significant market share due to the crucial role of advanced instruments in accurate and efficient diagnosis. North America currently dominates the market, fueled by advanced healthcare infrastructure and high adoption rates of advanced diagnostic techniques. However, Asia-Pacific is anticipated to witness substantial growth owing to rising healthcare investments and increasing awareness about gastrointestinal health in developing economies. Competitive dynamics are characterized by the presence of established players like Abbott Laboratories and Danaher Corporation, alongside emerging companies focusing on innovative diagnostic solutions.
The market's growth trajectory is further influenced by several factors. Restraints include high costs associated with advanced diagnostic tests, limited access to sophisticated equipment in low-resource settings, and the potential for false-positive or false-negative results impacting patient management. Emerging trends include the development of rapid diagnostic tests, the integration of artificial intelligence for improved diagnostic accuracy, and the increasing adoption of home-based testing solutions. These advancements are expected to shape future market dynamics, fostering greater accessibility and affordability of GI stool examination services. The continued focus on improving diagnostic precision and patient outcomes will drive innovation and expansion within the GI Stool Examination market over the forecast period.
GI Stool Examination Industry: A Comprehensive Market Report (2019-2033)
This insightful report provides a comprehensive analysis of the GI Stool Examination industry, projecting a market value exceeding $XX Million by 2033. Covering the period from 2019 to 2033, with a base year of 2025 and a forecast period of 2025-2033, this report is essential for stakeholders seeking to understand market dynamics, identify growth opportunities, and navigate the competitive landscape.
GI Stool Examination Industry Market Composition & Trends
The GI Stool Examination market, valued at $XX Million in 2025, exhibits a moderately concentrated landscape with key players such as Abbott Laboratories, Danaher Corporation (Beckman Coulter Inc), and bioMérieux SA holding significant market share. Innovation is driven by the increasing prevalence of gastrointestinal diseases, the demand for non-invasive diagnostic tools, and advancements in molecular diagnostics. Regulatory frameworks, particularly those concerning FDA approvals and reimbursement policies, significantly influence market growth. Substitute products, such as colonoscopy, exist but face limitations in terms of invasiveness and accessibility. The end-user profile consists primarily of hospitals, diagnostic laboratories, and healthcare providers. Recent years have witnessed several M&A activities, with deal values estimated at $XX Million in the past five years, signifying consolidation and expansion within the industry.
- Market Share Distribution (2025): Abbott Laboratories (XX%), Danaher Corporation (Beckman Coulter Inc) (XX%), bioMérieux SA (XX%), Others (XX%)
- M&A Deal Values (2020-2024): Estimated at $XX Million
- Key Innovation Catalysts: Advancements in molecular diagnostics, development of point-of-care testing devices, and increased automation.
- Regulatory Landscape: Stringent FDA regulations and reimbursement policies impact market entry and product adoption.
GI Stool Examination Industry Industry Evolution
The GI Stool Examination market has demonstrated steady growth from 2019 to 2024, with a Compound Annual Growth Rate (CAGR) of XX%. This growth is fueled by several factors, including the rising prevalence of gastrointestinal disorders, increased awareness among the population regarding preventative healthcare, and technological advancements leading to more accurate and efficient diagnostic tools. The market has seen a shift towards minimally invasive testing methodologies, which has also positively impacted the growth. Furthermore, the increasing demand for home-based testing kits is contributing to the overall growth of the market. The adoption of fecal biomarker testing has grown rapidly in recent years due to its improved sensitivity and specificity compared to conventional tests.
Leading Regions, Countries, or Segments in GI Stool Examination Industry
North America currently holds the largest market share in the GI Stool Examination industry, driven by high healthcare expenditure, robust regulatory frameworks, and increased technological advancements. Within the segment analysis:
- Product Type: Reagents segment holds the largest share due to high demand from diagnostic laboratories. Instruments segment is showing promising growth driven by automation.
- Test Type: Occult blood tests remain dominant, while the fecal biomarker test segment exhibits the highest growth potential due to its ability to detect early-stage diseases.
Key Drivers:
- High Healthcare Expenditure (North America): Drives demand for advanced diagnostics.
- Regulatory Support (North America and Europe): Facilitates market access for new technologies.
- Technological Advancements (Globally): Improved accuracy and efficiency of tests.
GI Stool Examination Industry Product Innovations
Recent innovations have focused on improving the accuracy, speed, and convenience of GI stool examinations. This includes the development of highly sensitive molecular diagnostic assays, point-of-care testing devices for rapid results, and user-friendly home collection kits. These advancements address the need for non-invasive, early detection methods for gastrointestinal diseases, leading to improved patient outcomes and reduced healthcare costs. Unique selling propositions often revolve around improved sensitivity, faster turnaround times, and simplified testing procedures.
Propelling Factors for GI Stool Examination Industry Growth
The growth of the GI stool examination industry is propelled by factors such as rising prevalence of gastrointestinal diseases (e.g., colorectal cancer), increasing demand for early disease detection, technological advancements leading to improved test accuracy and efficiency, and growing awareness about the importance of preventative healthcare. Furthermore, supportive government initiatives and reimbursements for diagnostic tests in many countries further incentivize market growth.
Obstacles in the GI Stool Examination Industry Market
Key barriers include stringent regulatory approvals, particularly from agencies like the FDA, which can delay product launches and increase costs. Supply chain disruptions, particularly those affecting crucial reagents and components, can impact production and pricing. High competition from established players with extensive distribution networks also poses a challenge to new entrants.
Future Opportunities in GI Stool Examination Industry
Future opportunities lie in the development of point-of-care testing devices for immediate results, personalized medicine approaches using advanced biomarker analysis, and expansion into emerging markets with rising healthcare awareness. The integration of artificial intelligence and machine learning for improved data analysis and disease prediction is another promising area.
Major Players in the GI Stool Examination Industry Ecosystem
- Cenogenics Corporation
- CTK Biotech Inc
- Abbott Laboratories
- Meridian Bioscience Inc
- DiaSorin S p A
- Epitope Diagnostics Inc
- Cardinal Health
- ScheBo Biotech AG
- Genova Diagnostics
- bioMérieux SA
- Quest Diagnostics Incorporated
- Danaher Corporation (Beckman Coulter Inc)
Key Developments in GI Stool Examination Industry Industry
- December 2022: Shineco, Inc. receives FDA approval and a US PTO patent for its in-situ fecal specimen sampling device, enhancing ease of sample collection.
- June 2022: Prenetics Group Limited and New Horizon Health launch ColoClear, a novel at-home colorectal cancer screening test utilizing DNA biomarker and blood cell detection.
Strategic GI Stool Examination Industry Market Forecast
The GI Stool Examination market is poised for robust growth, driven by technological advancements, rising healthcare expenditure, and increasing awareness regarding preventative healthcare. The development of novel diagnostic assays and point-of-care testing platforms will fuel market expansion over the forecast period. The market is expected to witness significant penetration of advanced diagnostic tools, leading to improved patient outcomes and reduced healthcare costs.
GI Stool Examination Industry Segmentation
-
1. Product Type
- 1.1. Instruments
- 1.2. Reagents
-
2. Test Type
- 2.1. Occult Blood Test
- 2.2. Ova and Parasites Test
- 2.3. Bacteria Test
- 2.4. Fecal Biomarkers Test
- 2.5. Other Test Types
GI Stool Examination Industry Segmentation By Geography
-
1. North America
- 1.1. United States
- 1.2. Canada
- 1.3. Mexico
-
2. Europe
- 2.1. Germany
- 2.2. United Kingdom
- 2.3. France
- 2.4. Italy
- 2.5. Spain
- 2.6. Rest of Europe
-
3. Asia Pacific
- 3.1. China
- 3.2. Japan
- 3.3. India
- 3.4. Australia
- 3.5. South Korea
- 3.6. Rest of Asia Pacific
-
4. Middle East and Africa
- 4.1. GCC
- 4.2. South Africa
- 4.3. Rest of Middle East and Africa
-
5. South America
- 5.1. Brazil
- 5.2. Argentina
- 5.3. Rest of South America
GI Stool Examination Industry REPORT HIGHLIGHTS
| Aspects | Details |
|---|---|
| Study Period | 2019-2033 |
| Base Year | 2024 |
| Estimated Year | 2025 |
| Forecast Period | 2025-2033 |
| Historical Period | 2019-2024 |
| Growth Rate | CAGR of 6.54% from 2019-2033 |
| Segmentation |
|
Table of Contents
- 1. Introduction
- 1.1. Research Scope
- 1.2. Market Segmentation
- 1.3. Research Methodology
- 1.4. Definitions and Assumptions
- 2. Executive Summary
- 2.1. Introduction
- 3. Market Dynamics
- 3.1. Introduction
- 3.2. Market Drivers
- 3.2.1. Growing Burden of Gastrointestinal Diseases; Rising Preference of Point of Care Test
- 3.3. Market Restrains
- 3.3.1. High Cost of Instruments
- 3.4. Market Trends
- 3.4.1. Reagent Segment is Expected to Witness Significant Growth in the GI Stool Testing Market Over the Forecast Period
- 4. Market Factor Analysis
- 4.1. Porters Five Forces
- 4.2. Supply/Value Chain
- 4.3. PESTEL analysis
- 4.4. Market Entropy
- 4.5. Patent/Trademark Analysis
- 5. Global GI Stool Examination Industry Analysis, Insights and Forecast, 2019-2031
- 5.1. Market Analysis, Insights and Forecast - by Product Type
- 5.1.1. Instruments
- 5.1.2. Reagents
- 5.2. Market Analysis, Insights and Forecast - by Test Type
- 5.2.1. Occult Blood Test
- 5.2.2. Ova and Parasites Test
- 5.2.3. Bacteria Test
- 5.2.4. Fecal Biomarkers Test
- 5.2.5. Other Test Types
- 5.3. Market Analysis, Insights and Forecast - by Region
- 5.3.1. North America
- 5.3.2. Europe
- 5.3.3. Asia Pacific
- 5.3.4. Middle East and Africa
- 5.3.5. South America
- 5.1. Market Analysis, Insights and Forecast - by Product Type
- 6. North America GI Stool Examination Industry Analysis, Insights and Forecast, 2019-2031
- 6.1. Market Analysis, Insights and Forecast - by Product Type
- 6.1.1. Instruments
- 6.1.2. Reagents
- 6.2. Market Analysis, Insights and Forecast - by Test Type
- 6.2.1. Occult Blood Test
- 6.2.2. Ova and Parasites Test
- 6.2.3. Bacteria Test
- 6.2.4. Fecal Biomarkers Test
- 6.2.5. Other Test Types
- 6.1. Market Analysis, Insights and Forecast - by Product Type
- 7. Europe GI Stool Examination Industry Analysis, Insights and Forecast, 2019-2031
- 7.1. Market Analysis, Insights and Forecast - by Product Type
- 7.1.1. Instruments
- 7.1.2. Reagents
- 7.2. Market Analysis, Insights and Forecast - by Test Type
- 7.2.1. Occult Blood Test
- 7.2.2. Ova and Parasites Test
- 7.2.3. Bacteria Test
- 7.2.4. Fecal Biomarkers Test
- 7.2.5. Other Test Types
- 7.1. Market Analysis, Insights and Forecast - by Product Type
- 8. Asia Pacific GI Stool Examination Industry Analysis, Insights and Forecast, 2019-2031
- 8.1. Market Analysis, Insights and Forecast - by Product Type
- 8.1.1. Instruments
- 8.1.2. Reagents
- 8.2. Market Analysis, Insights and Forecast - by Test Type
- 8.2.1. Occult Blood Test
- 8.2.2. Ova and Parasites Test
- 8.2.3. Bacteria Test
- 8.2.4. Fecal Biomarkers Test
- 8.2.5. Other Test Types
- 8.1. Market Analysis, Insights and Forecast - by Product Type
- 9. Middle East and Africa GI Stool Examination Industry Analysis, Insights and Forecast, 2019-2031
- 9.1. Market Analysis, Insights and Forecast - by Product Type
- 9.1.1. Instruments
- 9.1.2. Reagents
- 9.2. Market Analysis, Insights and Forecast - by Test Type
- 9.2.1. Occult Blood Test
- 9.2.2. Ova and Parasites Test
- 9.2.3. Bacteria Test
- 9.2.4. Fecal Biomarkers Test
- 9.2.5. Other Test Types
- 9.1. Market Analysis, Insights and Forecast - by Product Type
- 10. South America GI Stool Examination Industry Analysis, Insights and Forecast, 2019-2031
- 10.1. Market Analysis, Insights and Forecast - by Product Type
- 10.1.1. Instruments
- 10.1.2. Reagents
- 10.2. Market Analysis, Insights and Forecast - by Test Type
- 10.2.1. Occult Blood Test
- 10.2.2. Ova and Parasites Test
- 10.2.3. Bacteria Test
- 10.2.4. Fecal Biomarkers Test
- 10.2.5. Other Test Types
- 10.1. Market Analysis, Insights and Forecast - by Product Type
- 11. North America GI Stool Examination Industry Analysis, Insights and Forecast, 2019-2031
- 11.1. Market Analysis, Insights and Forecast - By Country/Sub-region
- 11.1.1 United States
- 11.1.2 Canada
- 11.1.3 Mexico
- 12. Europe GI Stool Examination Industry Analysis, Insights and Forecast, 2019-2031
- 12.1. Market Analysis, Insights and Forecast - By Country/Sub-region
- 12.1.1 Germany
- 12.1.2 United Kingdom
- 12.1.3 France
- 12.1.4 Italy
- 12.1.5 Spain
- 12.1.6 Rest of Europe
- 13. Asia Pacific GI Stool Examination Industry Analysis, Insights and Forecast, 2019-2031
- 13.1. Market Analysis, Insights and Forecast - By Country/Sub-region
- 13.1.1 China
- 13.1.2 Japan
- 13.1.3 India
- 13.1.4 Australia
- 13.1.5 South Korea
- 13.1.6 Rest of Asia Pacific
- 14. Middle East and Africa GI Stool Examination Industry Analysis, Insights and Forecast, 2019-2031
- 14.1. Market Analysis, Insights and Forecast - By Country/Sub-region
- 14.1.1 GCC
- 14.1.2 South Africa
- 14.1.3 Rest of Middle East and Africa
- 15. South America GI Stool Examination Industry Analysis, Insights and Forecast, 2019-2031
- 15.1. Market Analysis, Insights and Forecast - By Country/Sub-region
- 15.1.1 Brazil
- 15.1.2 Argentina
- 15.1.3 Rest of South America
- 16. Competitive Analysis
- 16.1. Global Market Share Analysis 2024
- 16.2. Company Profiles
- 16.2.1 Cenogenics Corporation
- 16.2.1.1. Overview
- 16.2.1.2. Products
- 16.2.1.3. SWOT Analysis
- 16.2.1.4. Recent Developments
- 16.2.1.5. Financials (Based on Availability)
- 16.2.2 CTK Biotech Inc
- 16.2.2.1. Overview
- 16.2.2.2. Products
- 16.2.2.3. SWOT Analysis
- 16.2.2.4. Recent Developments
- 16.2.2.5. Financials (Based on Availability)
- 16.2.3 Abbott Laboratories
- 16.2.3.1. Overview
- 16.2.3.2. Products
- 16.2.3.3. SWOT Analysis
- 16.2.3.4. Recent Developments
- 16.2.3.5. Financials (Based on Availability)
- 16.2.4 Meridian Bioscience Inc
- 16.2.4.1. Overview
- 16.2.4.2. Products
- 16.2.4.3. SWOT Analysis
- 16.2.4.4. Recent Developments
- 16.2.4.5. Financials (Based on Availability)
- 16.2.5 DiaSorin S p A
- 16.2.5.1. Overview
- 16.2.5.2. Products
- 16.2.5.3. SWOT Analysis
- 16.2.5.4. Recent Developments
- 16.2.5.5. Financials (Based on Availability)
- 16.2.6 Epitope Diagnostics Inc
- 16.2.6.1. Overview
- 16.2.6.2. Products
- 16.2.6.3. SWOT Analysis
- 16.2.6.4. Recent Developments
- 16.2.6.5. Financials (Based on Availability)
- 16.2.7 Cardinal Health
- 16.2.7.1. Overview
- 16.2.7.2. Products
- 16.2.7.3. SWOT Analysis
- 16.2.7.4. Recent Developments
- 16.2.7.5. Financials (Based on Availability)
- 16.2.8 ScheBo Biotech AG
- 16.2.8.1. Overview
- 16.2.8.2. Products
- 16.2.8.3. SWOT Analysis
- 16.2.8.4. Recent Developments
- 16.2.8.5. Financials (Based on Availability)
- 16.2.9 Genova Diagnostics
- 16.2.9.1. Overview
- 16.2.9.2. Products
- 16.2.9.3. SWOT Analysis
- 16.2.9.4. Recent Developments
- 16.2.9.5. Financials (Based on Availability)
- 16.2.10 bioMerieux SA
- 16.2.10.1. Overview
- 16.2.10.2. Products
- 16.2.10.3. SWOT Analysis
- 16.2.10.4. Recent Developments
- 16.2.10.5. Financials (Based on Availability)
- 16.2.11 Quest Diagnostics Incorporated
- 16.2.11.1. Overview
- 16.2.11.2. Products
- 16.2.11.3. SWOT Analysis
- 16.2.11.4. Recent Developments
- 16.2.11.5. Financials (Based on Availability)
- 16.2.12 Danaher Corporation (Beckman Coulter Inc )
- 16.2.12.1. Overview
- 16.2.12.2. Products
- 16.2.12.3. SWOT Analysis
- 16.2.12.4. Recent Developments
- 16.2.12.5. Financials (Based on Availability)
- 16.2.1 Cenogenics Corporation
List of Figures
- Figure 1: Global GI Stool Examination Industry Revenue Breakdown (Million, %) by Region 2024 & 2032
- Figure 2: Global GI Stool Examination Industry Volume Breakdown (K Unit, %) by Region 2024 & 2032
- Figure 3: North America GI Stool Examination Industry Revenue (Million), by Country 2024 & 2032
- Figure 4: North America GI Stool Examination Industry Volume (K Unit), by Country 2024 & 2032
- Figure 5: North America GI Stool Examination Industry Revenue Share (%), by Country 2024 & 2032
- Figure 6: North America GI Stool Examination Industry Volume Share (%), by Country 2024 & 2032
- Figure 7: Europe GI Stool Examination Industry Revenue (Million), by Country 2024 & 2032
- Figure 8: Europe GI Stool Examination Industry Volume (K Unit), by Country 2024 & 2032
- Figure 9: Europe GI Stool Examination Industry Revenue Share (%), by Country 2024 & 2032
- Figure 10: Europe GI Stool Examination Industry Volume Share (%), by Country 2024 & 2032
- Figure 11: Asia Pacific GI Stool Examination Industry Revenue (Million), by Country 2024 & 2032
- Figure 12: Asia Pacific GI Stool Examination Industry Volume (K Unit), by Country 2024 & 2032
- Figure 13: Asia Pacific GI Stool Examination Industry Revenue Share (%), by Country 2024 & 2032
- Figure 14: Asia Pacific GI Stool Examination Industry Volume Share (%), by Country 2024 & 2032
- Figure 15: Middle East and Africa GI Stool Examination Industry Revenue (Million), by Country 2024 & 2032
- Figure 16: Middle East and Africa GI Stool Examination Industry Volume (K Unit), by Country 2024 & 2032
- Figure 17: Middle East and Africa GI Stool Examination Industry Revenue Share (%), by Country 2024 & 2032
- Figure 18: Middle East and Africa GI Stool Examination Industry Volume Share (%), by Country 2024 & 2032
- Figure 19: South America GI Stool Examination Industry Revenue (Million), by Country 2024 & 2032
- Figure 20: South America GI Stool Examination Industry Volume (K Unit), by Country 2024 & 2032
- Figure 21: South America GI Stool Examination Industry Revenue Share (%), by Country 2024 & 2032
- Figure 22: South America GI Stool Examination Industry Volume Share (%), by Country 2024 & 2032
- Figure 23: North America GI Stool Examination Industry Revenue (Million), by Product Type 2024 & 2032
- Figure 24: North America GI Stool Examination Industry Volume (K Unit), by Product Type 2024 & 2032
- Figure 25: North America GI Stool Examination Industry Revenue Share (%), by Product Type 2024 & 2032
- Figure 26: North America GI Stool Examination Industry Volume Share (%), by Product Type 2024 & 2032
- Figure 27: North America GI Stool Examination Industry Revenue (Million), by Test Type 2024 & 2032
- Figure 28: North America GI Stool Examination Industry Volume (K Unit), by Test Type 2024 & 2032
- Figure 29: North America GI Stool Examination Industry Revenue Share (%), by Test Type 2024 & 2032
- Figure 30: North America GI Stool Examination Industry Volume Share (%), by Test Type 2024 & 2032
- Figure 31: North America GI Stool Examination Industry Revenue (Million), by Country 2024 & 2032
- Figure 32: North America GI Stool Examination Industry Volume (K Unit), by Country 2024 & 2032
- Figure 33: North America GI Stool Examination Industry Revenue Share (%), by Country 2024 & 2032
- Figure 34: North America GI Stool Examination Industry Volume Share (%), by Country 2024 & 2032
- Figure 35: Europe GI Stool Examination Industry Revenue (Million), by Product Type 2024 & 2032
- Figure 36: Europe GI Stool Examination Industry Volume (K Unit), by Product Type 2024 & 2032
- Figure 37: Europe GI Stool Examination Industry Revenue Share (%), by Product Type 2024 & 2032
- Figure 38: Europe GI Stool Examination Industry Volume Share (%), by Product Type 2024 & 2032
- Figure 39: Europe GI Stool Examination Industry Revenue (Million), by Test Type 2024 & 2032
- Figure 40: Europe GI Stool Examination Industry Volume (K Unit), by Test Type 2024 & 2032
- Figure 41: Europe GI Stool Examination Industry Revenue Share (%), by Test Type 2024 & 2032
- Figure 42: Europe GI Stool Examination Industry Volume Share (%), by Test Type 2024 & 2032
- Figure 43: Europe GI Stool Examination Industry Revenue (Million), by Country 2024 & 2032
- Figure 44: Europe GI Stool Examination Industry Volume (K Unit), by Country 2024 & 2032
- Figure 45: Europe GI Stool Examination Industry Revenue Share (%), by Country 2024 & 2032
- Figure 46: Europe GI Stool Examination Industry Volume Share (%), by Country 2024 & 2032
- Figure 47: Asia Pacific GI Stool Examination Industry Revenue (Million), by Product Type 2024 & 2032
- Figure 48: Asia Pacific GI Stool Examination Industry Volume (K Unit), by Product Type 2024 & 2032
- Figure 49: Asia Pacific GI Stool Examination Industry Revenue Share (%), by Product Type 2024 & 2032
- Figure 50: Asia Pacific GI Stool Examination Industry Volume Share (%), by Product Type 2024 & 2032
- Figure 51: Asia Pacific GI Stool Examination Industry Revenue (Million), by Test Type 2024 & 2032
- Figure 52: Asia Pacific GI Stool Examination Industry Volume (K Unit), by Test Type 2024 & 2032
- Figure 53: Asia Pacific GI Stool Examination Industry Revenue Share (%), by Test Type 2024 & 2032
- Figure 54: Asia Pacific GI Stool Examination Industry Volume Share (%), by Test Type 2024 & 2032
- Figure 55: Asia Pacific GI Stool Examination Industry Revenue (Million), by Country 2024 & 2032
- Figure 56: Asia Pacific GI Stool Examination Industry Volume (K Unit), by Country 2024 & 2032
- Figure 57: Asia Pacific GI Stool Examination Industry Revenue Share (%), by Country 2024 & 2032
- Figure 58: Asia Pacific GI Stool Examination Industry Volume Share (%), by Country 2024 & 2032
- Figure 59: Middle East and Africa GI Stool Examination Industry Revenue (Million), by Product Type 2024 & 2032
- Figure 60: Middle East and Africa GI Stool Examination Industry Volume (K Unit), by Product Type 2024 & 2032
- Figure 61: Middle East and Africa GI Stool Examination Industry Revenue Share (%), by Product Type 2024 & 2032
- Figure 62: Middle East and Africa GI Stool Examination Industry Volume Share (%), by Product Type 2024 & 2032
- Figure 63: Middle East and Africa GI Stool Examination Industry Revenue (Million), by Test Type 2024 & 2032
- Figure 64: Middle East and Africa GI Stool Examination Industry Volume (K Unit), by Test Type 2024 & 2032
- Figure 65: Middle East and Africa GI Stool Examination Industry Revenue Share (%), by Test Type 2024 & 2032
- Figure 66: Middle East and Africa GI Stool Examination Industry Volume Share (%), by Test Type 2024 & 2032
- Figure 67: Middle East and Africa GI Stool Examination Industry Revenue (Million), by Country 2024 & 2032
- Figure 68: Middle East and Africa GI Stool Examination Industry Volume (K Unit), by Country 2024 & 2032
- Figure 69: Middle East and Africa GI Stool Examination Industry Revenue Share (%), by Country 2024 & 2032
- Figure 70: Middle East and Africa GI Stool Examination Industry Volume Share (%), by Country 2024 & 2032
- Figure 71: South America GI Stool Examination Industry Revenue (Million), by Product Type 2024 & 2032
- Figure 72: South America GI Stool Examination Industry Volume (K Unit), by Product Type 2024 & 2032
- Figure 73: South America GI Stool Examination Industry Revenue Share (%), by Product Type 2024 & 2032
- Figure 74: South America GI Stool Examination Industry Volume Share (%), by Product Type 2024 & 2032
- Figure 75: South America GI Stool Examination Industry Revenue (Million), by Test Type 2024 & 2032
- Figure 76: South America GI Stool Examination Industry Volume (K Unit), by Test Type 2024 & 2032
- Figure 77: South America GI Stool Examination Industry Revenue Share (%), by Test Type 2024 & 2032
- Figure 78: South America GI Stool Examination Industry Volume Share (%), by Test Type 2024 & 2032
- Figure 79: South America GI Stool Examination Industry Revenue (Million), by Country 2024 & 2032
- Figure 80: South America GI Stool Examination Industry Volume (K Unit), by Country 2024 & 2032
- Figure 81: South America GI Stool Examination Industry Revenue Share (%), by Country 2024 & 2032
- Figure 82: South America GI Stool Examination Industry Volume Share (%), by Country 2024 & 2032
List of Tables
- Table 1: Global GI Stool Examination Industry Revenue Million Forecast, by Region 2019 & 2032
- Table 2: Global GI Stool Examination Industry Volume K Unit Forecast, by Region 2019 & 2032
- Table 3: Global GI Stool Examination Industry Revenue Million Forecast, by Product Type 2019 & 2032
- Table 4: Global GI Stool Examination Industry Volume K Unit Forecast, by Product Type 2019 & 2032
- Table 5: Global GI Stool Examination Industry Revenue Million Forecast, by Test Type 2019 & 2032
- Table 6: Global GI Stool Examination Industry Volume K Unit Forecast, by Test Type 2019 & 2032
- Table 7: Global GI Stool Examination Industry Revenue Million Forecast, by Region 2019 & 2032
- Table 8: Global GI Stool Examination Industry Volume K Unit Forecast, by Region 2019 & 2032
- Table 9: Global GI Stool Examination Industry Revenue Million Forecast, by Country 2019 & 2032
- Table 10: Global GI Stool Examination Industry Volume K Unit Forecast, by Country 2019 & 2032
- Table 11: United States GI Stool Examination Industry Revenue (Million) Forecast, by Application 2019 & 2032
- Table 12: United States GI Stool Examination Industry Volume (K Unit) Forecast, by Application 2019 & 2032
- Table 13: Canada GI Stool Examination Industry Revenue (Million) Forecast, by Application 2019 & 2032
- Table 14: Canada GI Stool Examination Industry Volume (K Unit) Forecast, by Application 2019 & 2032
- Table 15: Mexico GI Stool Examination Industry Revenue (Million) Forecast, by Application 2019 & 2032
- Table 16: Mexico GI Stool Examination Industry Volume (K Unit) Forecast, by Application 2019 & 2032
- Table 17: Global GI Stool Examination Industry Revenue Million Forecast, by Country 2019 & 2032
- Table 18: Global GI Stool Examination Industry Volume K Unit Forecast, by Country 2019 & 2032
- Table 19: Germany GI Stool Examination Industry Revenue (Million) Forecast, by Application 2019 & 2032
- Table 20: Germany GI Stool Examination Industry Volume (K Unit) Forecast, by Application 2019 & 2032
- Table 21: United Kingdom GI Stool Examination Industry Revenue (Million) Forecast, by Application 2019 & 2032
- Table 22: United Kingdom GI Stool Examination Industry Volume (K Unit) Forecast, by Application 2019 & 2032
- Table 23: France GI Stool Examination Industry Revenue (Million) Forecast, by Application 2019 & 2032
- Table 24: France GI Stool Examination Industry Volume (K Unit) Forecast, by Application 2019 & 2032
- Table 25: Italy GI Stool Examination Industry Revenue (Million) Forecast, by Application 2019 & 2032
- Table 26: Italy GI Stool Examination Industry Volume (K Unit) Forecast, by Application 2019 & 2032
- Table 27: Spain GI Stool Examination Industry Revenue (Million) Forecast, by Application 2019 & 2032
- Table 28: Spain GI Stool Examination Industry Volume (K Unit) Forecast, by Application 2019 & 2032
- Table 29: Rest of Europe GI Stool Examination Industry Revenue (Million) Forecast, by Application 2019 & 2032
- Table 30: Rest of Europe GI Stool Examination Industry Volume (K Unit) Forecast, by Application 2019 & 2032
- Table 31: Global GI Stool Examination Industry Revenue Million Forecast, by Country 2019 & 2032
- Table 32: Global GI Stool Examination Industry Volume K Unit Forecast, by Country 2019 & 2032
- Table 33: China GI Stool Examination Industry Revenue (Million) Forecast, by Application 2019 & 2032
- Table 34: China GI Stool Examination Industry Volume (K Unit) Forecast, by Application 2019 & 2032
- Table 35: Japan GI Stool Examination Industry Revenue (Million) Forecast, by Application 2019 & 2032
- Table 36: Japan GI Stool Examination Industry Volume (K Unit) Forecast, by Application 2019 & 2032
- Table 37: India GI Stool Examination Industry Revenue (Million) Forecast, by Application 2019 & 2032
- Table 38: India GI Stool Examination Industry Volume (K Unit) Forecast, by Application 2019 & 2032
- Table 39: Australia GI Stool Examination Industry Revenue (Million) Forecast, by Application 2019 & 2032
- Table 40: Australia GI Stool Examination Industry Volume (K Unit) Forecast, by Application 2019 & 2032
- Table 41: South Korea GI Stool Examination Industry Revenue (Million) Forecast, by Application 2019 & 2032
- Table 42: South Korea GI Stool Examination Industry Volume (K Unit) Forecast, by Application 2019 & 2032
- Table 43: Rest of Asia Pacific GI Stool Examination Industry Revenue (Million) Forecast, by Application 2019 & 2032
- Table 44: Rest of Asia Pacific GI Stool Examination Industry Volume (K Unit) Forecast, by Application 2019 & 2032
- Table 45: Global GI Stool Examination Industry Revenue Million Forecast, by Country 2019 & 2032
- Table 46: Global GI Stool Examination Industry Volume K Unit Forecast, by Country 2019 & 2032
- Table 47: GCC GI Stool Examination Industry Revenue (Million) Forecast, by Application 2019 & 2032
- Table 48: GCC GI Stool Examination Industry Volume (K Unit) Forecast, by Application 2019 & 2032
- Table 49: South Africa GI Stool Examination Industry Revenue (Million) Forecast, by Application 2019 & 2032
- Table 50: South Africa GI Stool Examination Industry Volume (K Unit) Forecast, by Application 2019 & 2032
- Table 51: Rest of Middle East and Africa GI Stool Examination Industry Revenue (Million) Forecast, by Application 2019 & 2032
- Table 52: Rest of Middle East and Africa GI Stool Examination Industry Volume (K Unit) Forecast, by Application 2019 & 2032
- Table 53: Global GI Stool Examination Industry Revenue Million Forecast, by Country 2019 & 2032
- Table 54: Global GI Stool Examination Industry Volume K Unit Forecast, by Country 2019 & 2032
- Table 55: Brazil GI Stool Examination Industry Revenue (Million) Forecast, by Application 2019 & 2032
- Table 56: Brazil GI Stool Examination Industry Volume (K Unit) Forecast, by Application 2019 & 2032
- Table 57: Argentina GI Stool Examination Industry Revenue (Million) Forecast, by Application 2019 & 2032
- Table 58: Argentina GI Stool Examination Industry Volume (K Unit) Forecast, by Application 2019 & 2032
- Table 59: Rest of South America GI Stool Examination Industry Revenue (Million) Forecast, by Application 2019 & 2032
- Table 60: Rest of South America GI Stool Examination Industry Volume (K Unit) Forecast, by Application 2019 & 2032
- Table 61: Global GI Stool Examination Industry Revenue Million Forecast, by Product Type 2019 & 2032
- Table 62: Global GI Stool Examination Industry Volume K Unit Forecast, by Product Type 2019 & 2032
- Table 63: Global GI Stool Examination Industry Revenue Million Forecast, by Test Type 2019 & 2032
- Table 64: Global GI Stool Examination Industry Volume K Unit Forecast, by Test Type 2019 & 2032
- Table 65: Global GI Stool Examination Industry Revenue Million Forecast, by Country 2019 & 2032
- Table 66: Global GI Stool Examination Industry Volume K Unit Forecast, by Country 2019 & 2032
- Table 67: United States GI Stool Examination Industry Revenue (Million) Forecast, by Application 2019 & 2032
- Table 68: United States GI Stool Examination Industry Volume (K Unit) Forecast, by Application 2019 & 2032
- Table 69: Canada GI Stool Examination Industry Revenue (Million) Forecast, by Application 2019 & 2032
- Table 70: Canada GI Stool Examination Industry Volume (K Unit) Forecast, by Application 2019 & 2032
- Table 71: Mexico GI Stool Examination Industry Revenue (Million) Forecast, by Application 2019 & 2032
- Table 72: Mexico GI Stool Examination Industry Volume (K Unit) Forecast, by Application 2019 & 2032
- Table 73: Global GI Stool Examination Industry Revenue Million Forecast, by Product Type 2019 & 2032
- Table 74: Global GI Stool Examination Industry Volume K Unit Forecast, by Product Type 2019 & 2032
- Table 75: Global GI Stool Examination Industry Revenue Million Forecast, by Test Type 2019 & 2032
- Table 76: Global GI Stool Examination Industry Volume K Unit Forecast, by Test Type 2019 & 2032
- Table 77: Global GI Stool Examination Industry Revenue Million Forecast, by Country 2019 & 2032
- Table 78: Global GI Stool Examination Industry Volume K Unit Forecast, by Country 2019 & 2032
- Table 79: Germany GI Stool Examination Industry Revenue (Million) Forecast, by Application 2019 & 2032
- Table 80: Germany GI Stool Examination Industry Volume (K Unit) Forecast, by Application 2019 & 2032
- Table 81: United Kingdom GI Stool Examination Industry Revenue (Million) Forecast, by Application 2019 & 2032
- Table 82: United Kingdom GI Stool Examination Industry Volume (K Unit) Forecast, by Application 2019 & 2032
- Table 83: France GI Stool Examination Industry Revenue (Million) Forecast, by Application 2019 & 2032
- Table 84: France GI Stool Examination Industry Volume (K Unit) Forecast, by Application 2019 & 2032
- Table 85: Italy GI Stool Examination Industry Revenue (Million) Forecast, by Application 2019 & 2032
- Table 86: Italy GI Stool Examination Industry Volume (K Unit) Forecast, by Application 2019 & 2032
- Table 87: Spain GI Stool Examination Industry Revenue (Million) Forecast, by Application 2019 & 2032
- Table 88: Spain GI Stool Examination Industry Volume (K Unit) Forecast, by Application 2019 & 2032
- Table 89: Rest of Europe GI Stool Examination Industry Revenue (Million) Forecast, by Application 2019 & 2032
- Table 90: Rest of Europe GI Stool Examination Industry Volume (K Unit) Forecast, by Application 2019 & 2032
- Table 91: Global GI Stool Examination Industry Revenue Million Forecast, by Product Type 2019 & 2032
- Table 92: Global GI Stool Examination Industry Volume K Unit Forecast, by Product Type 2019 & 2032
- Table 93: Global GI Stool Examination Industry Revenue Million Forecast, by Test Type 2019 & 2032
- Table 94: Global GI Stool Examination Industry Volume K Unit Forecast, by Test Type 2019 & 2032
- Table 95: Global GI Stool Examination Industry Revenue Million Forecast, by Country 2019 & 2032
- Table 96: Global GI Stool Examination Industry Volume K Unit Forecast, by Country 2019 & 2032
- Table 97: China GI Stool Examination Industry Revenue (Million) Forecast, by Application 2019 & 2032
- Table 98: China GI Stool Examination Industry Volume (K Unit) Forecast, by Application 2019 & 2032
- Table 99: Japan GI Stool Examination Industry Revenue (Million) Forecast, by Application 2019 & 2032
- Table 100: Japan GI Stool Examination Industry Volume (K Unit) Forecast, by Application 2019 & 2032
- Table 101: India GI Stool Examination Industry Revenue (Million) Forecast, by Application 2019 & 2032
- Table 102: India GI Stool Examination Industry Volume (K Unit) Forecast, by Application 2019 & 2032
- Table 103: Australia GI Stool Examination Industry Revenue (Million) Forecast, by Application 2019 & 2032
- Table 104: Australia GI Stool Examination Industry Volume (K Unit) Forecast, by Application 2019 & 2032
- Table 105: South Korea GI Stool Examination Industry Revenue (Million) Forecast, by Application 2019 & 2032
- Table 106: South Korea GI Stool Examination Industry Volume (K Unit) Forecast, by Application 2019 & 2032
- Table 107: Rest of Asia Pacific GI Stool Examination Industry Revenue (Million) Forecast, by Application 2019 & 2032
- Table 108: Rest of Asia Pacific GI Stool Examination Industry Volume (K Unit) Forecast, by Application 2019 & 2032
- Table 109: Global GI Stool Examination Industry Revenue Million Forecast, by Product Type 2019 & 2032
- Table 110: Global GI Stool Examination Industry Volume K Unit Forecast, by Product Type 2019 & 2032
- Table 111: Global GI Stool Examination Industry Revenue Million Forecast, by Test Type 2019 & 2032
- Table 112: Global GI Stool Examination Industry Volume K Unit Forecast, by Test Type 2019 & 2032
- Table 113: Global GI Stool Examination Industry Revenue Million Forecast, by Country 2019 & 2032
- Table 114: Global GI Stool Examination Industry Volume K Unit Forecast, by Country 2019 & 2032
- Table 115: GCC GI Stool Examination Industry Revenue (Million) Forecast, by Application 2019 & 2032
- Table 116: GCC GI Stool Examination Industry Volume (K Unit) Forecast, by Application 2019 & 2032
- Table 117: South Africa GI Stool Examination Industry Revenue (Million) Forecast, by Application 2019 & 2032
- Table 118: South Africa GI Stool Examination Industry Volume (K Unit) Forecast, by Application 2019 & 2032
- Table 119: Rest of Middle East and Africa GI Stool Examination Industry Revenue (Million) Forecast, by Application 2019 & 2032
- Table 120: Rest of Middle East and Africa GI Stool Examination Industry Volume (K Unit) Forecast, by Application 2019 & 2032
- Table 121: Global GI Stool Examination Industry Revenue Million Forecast, by Product Type 2019 & 2032
- Table 122: Global GI Stool Examination Industry Volume K Unit Forecast, by Product Type 2019 & 2032
- Table 123: Global GI Stool Examination Industry Revenue Million Forecast, by Test Type 2019 & 2032
- Table 124: Global GI Stool Examination Industry Volume K Unit Forecast, by Test Type 2019 & 2032
- Table 125: Global GI Stool Examination Industry Revenue Million Forecast, by Country 2019 & 2032
- Table 126: Global GI Stool Examination Industry Volume K Unit Forecast, by Country 2019 & 2032
- Table 127: Brazil GI Stool Examination Industry Revenue (Million) Forecast, by Application 2019 & 2032
- Table 128: Brazil GI Stool Examination Industry Volume (K Unit) Forecast, by Application 2019 & 2032
- Table 129: Argentina GI Stool Examination Industry Revenue (Million) Forecast, by Application 2019 & 2032
- Table 130: Argentina GI Stool Examination Industry Volume (K Unit) Forecast, by Application 2019 & 2032
- Table 131: Rest of South America GI Stool Examination Industry Revenue (Million) Forecast, by Application 2019 & 2032
- Table 132: Rest of South America GI Stool Examination Industry Volume (K Unit) Forecast, by Application 2019 & 2032
Frequently Asked Questions
1. What is the projected Compound Annual Growth Rate (CAGR) of the GI Stool Examination Industry?
The projected CAGR is approximately 6.54%.
2. Which companies are prominent players in the GI Stool Examination Industry?
Key companies in the market include Cenogenics Corporation, CTK Biotech Inc, Abbott Laboratories, Meridian Bioscience Inc, DiaSorin S p A, Epitope Diagnostics Inc, Cardinal Health, ScheBo Biotech AG, Genova Diagnostics, bioMerieux SA, Quest Diagnostics Incorporated, Danaher Corporation (Beckman Coulter Inc ).
3. What are the main segments of the GI Stool Examination Industry?
The market segments include Product Type, Test Type.
4. Can you provide details about the market size?
The market size is estimated to be USD 507.52 Million as of 2022.
5. What are some drivers contributing to market growth?
Growing Burden of Gastrointestinal Diseases; Rising Preference of Point of Care Test.
6. What are the notable trends driving market growth?
Reagent Segment is Expected to Witness Significant Growth in the GI Stool Testing Market Over the Forecast Period.
7. Are there any restraints impacting market growth?
High Cost of Instruments.
8. Can you provide examples of recent developments in the market?
December 2022: Shineco, Inc. received United States Food and Drug FDA approval and a patent grant from the United States Patent and Trademark Office (US PTO) protecting its in-situ fecal specimen sampling device for the use of stool test sample collection. The product provides a massager-like fingertip swab, a collection tube, and a lid with a unidirectional sampling inlet.
9. What pricing options are available for accessing the report?
Pricing options include single-user, multi-user, and enterprise licenses priced at USD 4750, USD 5250, and USD 8750 respectively.
10. Is the market size provided in terms of value or volume?
The market size is provided in terms of value, measured in Million and volume, measured in K Unit.
11. Are there any specific market keywords associated with the report?
Yes, the market keyword associated with the report is "GI Stool Examination Industry," which aids in identifying and referencing the specific market segment covered.
12. How do I determine which pricing option suits my needs best?
The pricing options vary based on user requirements and access needs. Individual users may opt for single-user licenses, while businesses requiring broader access may choose multi-user or enterprise licenses for cost-effective access to the report.
13. Are there any additional resources or data provided in the GI Stool Examination Industry report?
While the report offers comprehensive insights, it's advisable to review the specific contents or supplementary materials provided to ascertain if additional resources or data are available.
14. How can I stay updated on further developments or reports in the GI Stool Examination Industry?
To stay informed about further developments, trends, and reports in the GI Stool Examination Industry, consider subscribing to industry newsletters, following relevant companies and organizations, or regularly checking reputable industry news sources and publications.
Methodology
Step 1 - Identification of Relevant Samples Size from Population Database


Step 2 - Approaches for Defining Global Market Size (Value, Volume* & Price*)

Note*: In applicable scenarios
Step 3 - Data Sources
Primary Research
- Web Analytics
- Survey Reports
- Research Institute
- Latest Research Reports
- Opinion Leaders
Secondary Research
- Annual Reports
- White Paper
- Latest Press Release
- Industry Association
- Paid Database
- Investor Presentations

Step 4 - Data Triangulation
Involves using different sources of information in order to increase the validity of a study
These sources are likely to be stakeholders in a program - participants, other researchers, program staff, other community members, and so on.
Then we put all data in single framework & apply various statistical tools to find out the dynamic on the market.
During the analysis stage, feedback from the stakeholder groups would be compared to determine areas of agreement as well as areas of divergence
