

Key Insights
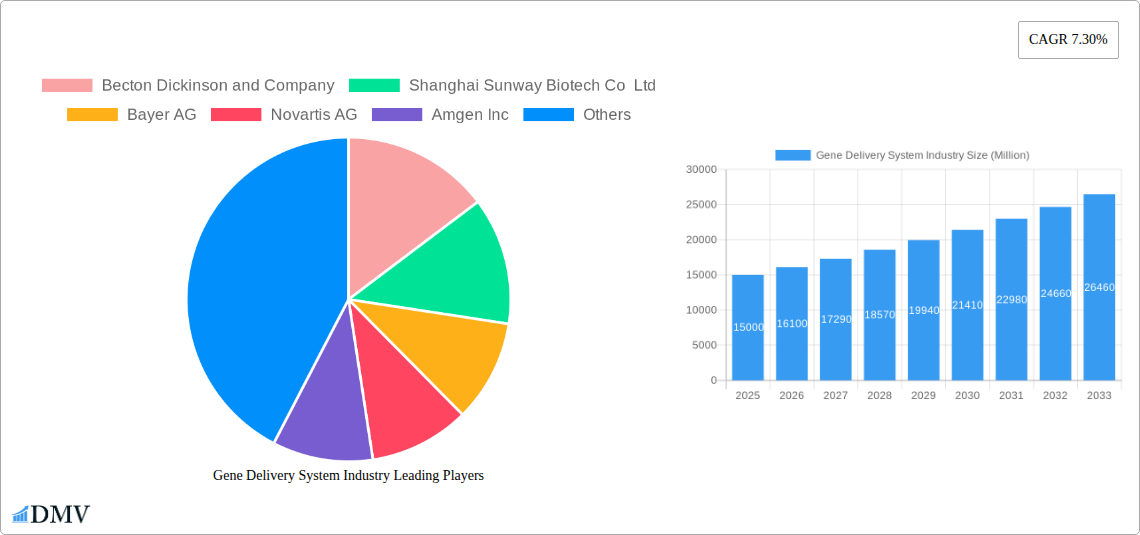
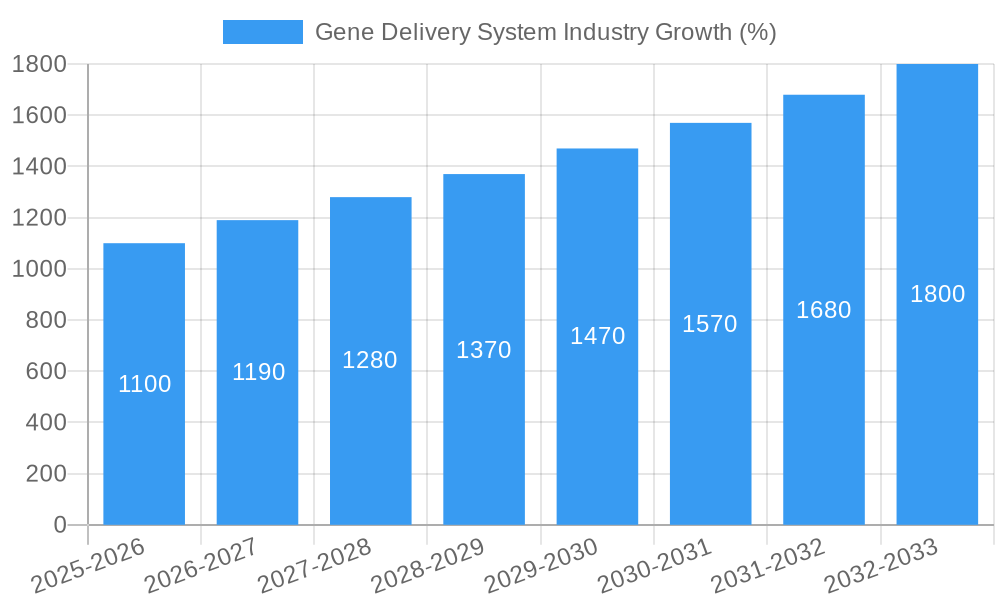
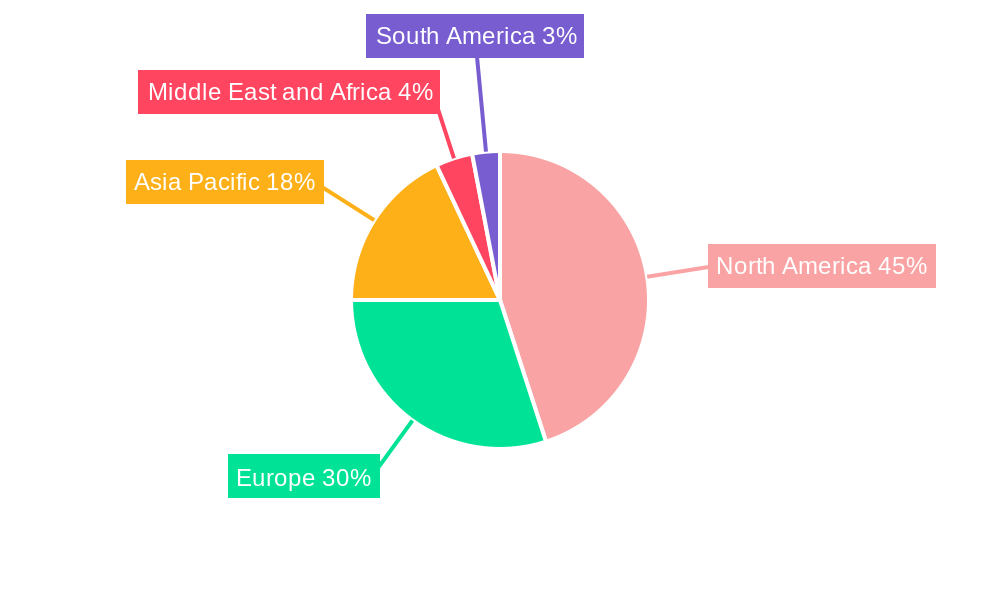
The global gene delivery system market is experiencing robust growth, projected to reach a substantial size driven by the increasing prevalence of chronic diseases like cancer and infectious diseases, coupled with the burgeoning field of gene therapy. The market's 7.30% CAGR from 2019 to 2024 indicates a strong trajectory, poised for continued expansion throughout the forecast period (2025-2033). This growth is fueled by advancements in viral and non-viral delivery systems, offering improved efficacy and safety profiles. The oncology segment currently dominates the application landscape, reflecting the significant demand for innovative cancer treatments. However, growing research and development efforts in other therapeutic areas such as infectious diseases, cardiovascular disorders, and diabetes are expected to diversify market applications significantly in the coming years. The injectable route of administration currently holds a leading position due to its established efficacy in delivering therapeutic genes. However, ongoing research into non-invasive methods such as oral and nasal delivery systems is expected to disrupt the market, offering greater patient convenience and compliance. Key players like Becton Dickinson, Novartis, and Pfizer are actively investing in research and development, driving innovation and competition within this dynamic sector. The market's geographical distribution reflects a significant concentration in North America and Europe initially, but the Asia-Pacific region is predicted to show accelerated growth driven by increasing healthcare spending and expanding research infrastructure.
The competitive landscape is marked by a mix of large pharmaceutical companies and specialized biotech firms. Strategic alliances, mergers, and acquisitions are expected to shape the market further, leading to increased innovation and expansion into new geographical areas. Regulatory approvals and reimbursements pose key challenges; however, increasing government support for gene therapy research and the growing understanding of its potential among healthcare providers are expected to mitigate these hurdles. The continued advancement of gene editing technologies like CRISPR-Cas9 holds significant promise for further market expansion, potentially leading to more precise and effective gene therapies. The overall outlook for the gene delivery system market is highly positive, driven by substantial technological innovation, unmet medical needs, and growing investor interest. Specific growth projections will depend on the success of ongoing clinical trials and regulatory approvals for new gene therapies.
Gene Delivery System Industry Market Report: 2019-2033
This comprehensive report provides an in-depth analysis of the Gene Delivery System market, projecting a robust growth trajectory from 2019 to 2033. The report meticulously examines market dynamics, key players, technological advancements, and future opportunities within this rapidly evolving sector. With a focus on data-driven insights and strategic forecasting, this report is essential for stakeholders seeking to navigate the complexities of the gene delivery landscape. The study period covers 2019-2033, with 2025 serving as the base and estimated year. The forecast period spans 2025-2033, and the historical period encompasses 2019-2024. The market is segmented by delivery systems (viral, non-viral, hybrid), applications (oncology, infectious diseases, etc.), and routes of administration (oral, injectable, etc.). Leading companies like Becton Dickinson and Company, Shanghai Sunway Biotech Co Ltd, and Pfizer Inc. are profiled, alongside a detailed examination of market trends and competitive landscapes. The report is valued at xx Million and is projected to reach xx Million by 2033.
Gene Delivery System Industry Market Composition & Trends
The global gene delivery system market is characterized by a moderately concentrated landscape with several major players holding significant market share. The distribution is as follows: the top 5 companies hold approximately 45% of the market share in 2025, with the remaining 55% distributed across numerous smaller companies and emerging players. Innovation is a key driver, fueled by advancements in viral vector technology, non-viral delivery methods, and combined hybrid approaches. Regulatory landscapes vary across regions, impacting market entry and approval processes. Substitute products, while limited, include traditional drug delivery methods, which face limitations in gene-specific therapeutic applications. The market is primarily driven by end-users in the pharmaceutical and biotechnology sectors, with an increasing role of academic research institutions. M&A activities are significant, with deal values exceeding xx Million in the past five years. Notable examples include the acquisition of [Company Name] by [Acquiring Company] for xx Million in 2024 and the merger of [Company A] and [Company B] in 2023.
- Market Share Distribution (2025): Top 5 companies: 45%; Others: 55%.
- M&A Deal Value (2019-2024): Over xx Million.
- Key Innovation Catalysts: Advancements in viral vectors, non-viral delivery, and combined hybrid systems.
- Regulatory Landscape: Varies across global regions.
Gene Delivery System Industry Industry Evolution
The gene delivery system market has witnessed significant evolution, transitioning from early-stage research to clinical application and commercialization. Between 2019 and 2024, the Compound Annual Growth Rate (CAGR) was approximately 15%, driven by increased investment in gene therapy research and development, coupled with a growing understanding of the therapeutic potential of gene editing technologies. Technological advancements, such as CRISPR-Cas9 and other gene editing tools, have opened new avenues for targeted gene therapy. The market is further shaped by shifting consumer demands, prioritizing safe and efficient gene delivery methods with minimal side effects. This has spurred innovation in delivery vehicles and targeting mechanisms. The demand for personalized medicine is a key driver of market growth, with the tailoring of gene therapies to individual patient needs expected to drive growth in the forecast period. Adoption of advanced gene therapies is gradually increasing, with a notable rise in clinical trials and approvals for various therapeutic applications. The projected CAGR for 2025-2033 is estimated to be approximately 18%, propelled by an expanding pipeline of gene therapies and increased investor confidence in the sector.
Leading Regions, Countries, or Segments in Gene Delivery System Industry
The North American region currently dominates the gene delivery system market, driven by substantial investments in R&D, a robust regulatory framework supporting clinical trials, and a high concentration of major players. Within North America, the United States represents the largest market.
By Delivery Systems: Viral gene delivery systems currently hold the largest segment market share due to their proven efficacy and established production processes. However, non-viral systems are experiencing rapid growth due to safety concerns associated with viral vectors.
By Application: Oncology leads the application segment, followed by infectious diseases, reflecting the significant unmet medical needs in these areas and the substantial progress made in targeted gene therapies for cancer and infectious diseases.
By Route of Administration: Injectable routes dominate, reflecting existing infrastructure and established administration protocols. Oral administration is an area of growing interest, offering improved patient compliance.
Key Drivers:
- High Investment in R&D: Significant funding from both public and private sectors.
- Supportive Regulatory Environment: Streamlined approval processes in key markets.
- Strong Clinical Trial Pipeline: A large number of gene therapy clinical trials progressing.
Gene Delivery System Industry Product Innovations
Recent innovations focus on enhancing the safety, efficiency, and targeting capabilities of gene delivery systems. This includes developing novel viral vectors with reduced immunogenicity, refining non-viral delivery methods such as lipid nanoparticles for improved cellular uptake, and engineering targeted delivery systems to enhance therapeutic efficacy while minimizing off-target effects. These advancements aim to improve patient outcomes and overcome limitations of existing gene delivery approaches. Unique selling propositions include enhanced specificity, reduced toxicity, improved efficacy, and simplified administration.
Propelling Factors for Gene Delivery System Industry Growth
Technological advancements in gene editing, such as CRISPR-Cas9, along with improved vector design and delivery mechanisms, are key growth drivers. Increased investments from both public and private sectors fuel research and development. Favorable regulatory environments, including accelerated approval pathways for innovative therapies, further contribute to growth. Growing prevalence of genetic disorders and the increasing demand for personalized medicine further accelerate market expansion.
Obstacles in the Gene Delivery System Industry Market
High development costs, complex manufacturing processes, and stringent regulatory requirements present significant barriers to entry. Supply chain disruptions related to raw materials and specialized manufacturing capabilities can also impede market growth. Intense competition among established players and emerging companies further complicates the landscape. These challenges can result in prolonged development timelines and limit market accessibility. For example, obtaining regulatory approval for a new gene therapy can take several years and cost tens of millions of dollars.
Future Opportunities in Gene Delivery System Industry
Emerging opportunities lie in the development of novel gene editing technologies, innovative delivery systems targeting specific cell types, and personalized gene therapies tailored to individual genetic profiles. Expanding applications in previously underserved therapeutic areas, such as cardiovascular diseases and neurodegenerative disorders, present significant growth potential. Furthermore, the development of more efficient and cost-effective manufacturing processes holds significant promise.
Major Players in the Gene Delivery System Industry Ecosystem
- Becton Dickinson and Company
- Shanghai Sunway Biotech Co Ltd
- Bayer AG
- Novartis AG
- Amgen Inc
- Sirion-Biotech GmbH
- Takara Bio
- GenScript ProBio
- F Hoffmann-La Roche AG
- Shenzhen SiBiono GeneTech Co Ltd
- Batavia Biosciences
- Genezen
- Pfizer Inc
Key Developments in Gene Delivery System Industry Industry
August 2022: Versant Ventures launched Vector BioPharma AG, a biopharmaceutical company developing a precision gene delivery platform devoid of viral genes. This signifies a move towards safer and more efficient non-viral gene delivery systems.
November 2022: IMUNON entered into a technology evaluation agreement with Acuitas Therapeutics to evaluate IMUNON's PLACCINE plasmid DNA with Acuitas' Lipid Nanoparticle Delivery System. This collaboration highlights the growing importance of partnerships in advancing gene delivery technologies.
Strategic Gene Delivery System Industry Market Forecast
The gene delivery system market is poised for continued growth, driven by technological advancements, increased R&D investment, and expanding clinical applications. The market's future success hinges on overcoming existing challenges, such as high development costs and regulatory hurdles, while embracing opportunities presented by emerging technologies and expanding therapeutic applications. The forecast period of 2025-2033 anticipates significant market expansion, fueled by continued innovation and increased patient access to gene therapies.
Gene Delivery System Industry Segmentation
-
1. Delivery Systems
-
1.1. Viral Gene Delivery Systems
- 1.1.1. Adenovirus Systems
- 1.1.2. Lentiviral Systems
- 1.1.3. Retroviral Systems
- 1.1.4. Other Viral Gene Delivery Systems
- 1.2. Non-viral Gene Delivery
- 1.3. Combined Hybrid Delivery Systems
-
1.1. Viral Gene Delivery Systems
-
2. Application
- 2.1. Oncology
- 2.2. Infectious Diseases
- 2.3. Cardiovascular Disorders
- 2.4. Diabetes
-
3. Route of Administration
- 3.1. Oral
- 3.2. Injectable
- 3.3. Nasal
Gene Delivery System Industry Segmentation By Geography
-
1. North America
- 1.1. United States
- 1.2. Canada
- 1.3. Mexico
-
2. Europe
- 2.1. Germany
- 2.2. United Kingdom
- 2.3. France
- 2.4. Italy
- 2.5. Spain
- 2.6. Rest of Europe
-
3. Asia Pacific
- 3.1. China
- 3.2. Japan
- 3.3. India
- 3.4. Australia
- 3.5. South Korea
- 3.6. Rest of Asia Pacific
-
4. Middle East and Africa
- 4.1. GCC
- 4.2. South Africa
- 4.3. Rest of Middle East and Africa
-
5. South America
- 5.1. Brazil
- 5.2. Argentina
- 5.3. Rest of South America
Gene Delivery System Industry REPORT HIGHLIGHTS
| Aspects | Details |
|---|---|
| Study Period | 2019-2033 |
| Base Year | 2024 |
| Estimated Year | 2025 |
| Forecast Period | 2025-2033 |
| Historical Period | 2019-2024 |
| Growth Rate | CAGR of 7.30% from 2019-2033 |
| Segmentation |
|
Table of Contents
- 1. Introduction
- 1.1. Research Scope
- 1.2. Market Segmentation
- 1.3. Research Methodology
- 1.4. Definitions and Assumptions
- 2. Executive Summary
- 2.1. Introduction
- 3. Market Dynamics
- 3.1. Introduction
- 3.2. Market Drivers
- 3.2.1. Growing Burden of Chronic Diseases and Lifestyle Disorders; Technological Advancements in Research by Biopharmaceutical Companies
- 3.3. Market Restrains
- 3.3.1. High Cost of Treatment
- 3.4. Market Trends
- 3.4.1. Viral Gene Delivery Systems Segment is Expected to Hold the Largest Share in the Gene Delivery Systems Market
- 4. Market Factor Analysis
- 4.1. Porters Five Forces
- 4.2. Supply/Value Chain
- 4.3. PESTEL analysis
- 4.4. Market Entropy
- 4.5. Patent/Trademark Analysis
- 5. Global Gene Delivery System Industry Analysis, Insights and Forecast, 2019-2031
- 5.1. Market Analysis, Insights and Forecast - by Delivery Systems
- 5.1.1. Viral Gene Delivery Systems
- 5.1.1.1. Adenovirus Systems
- 5.1.1.2. Lentiviral Systems
- 5.1.1.3. Retroviral Systems
- 5.1.1.4. Other Viral Gene Delivery Systems
- 5.1.2. Non-viral Gene Delivery
- 5.1.3. Combined Hybrid Delivery Systems
- 5.1.1. Viral Gene Delivery Systems
- 5.2. Market Analysis, Insights and Forecast - by Application
- 5.2.1. Oncology
- 5.2.2. Infectious Diseases
- 5.2.3. Cardiovascular Disorders
- 5.2.4. Diabetes
- 5.3. Market Analysis, Insights and Forecast - by Route of Administration
- 5.3.1. Oral
- 5.3.2. Injectable
- 5.3.3. Nasal
- 5.4. Market Analysis, Insights and Forecast - by Region
- 5.4.1. North America
- 5.4.2. Europe
- 5.4.3. Asia Pacific
- 5.4.4. Middle East and Africa
- 5.4.5. South America
- 5.1. Market Analysis, Insights and Forecast - by Delivery Systems
- 6. North America Gene Delivery System Industry Analysis, Insights and Forecast, 2019-2031
- 6.1. Market Analysis, Insights and Forecast - by Delivery Systems
- 6.1.1. Viral Gene Delivery Systems
- 6.1.1.1. Adenovirus Systems
- 6.1.1.2. Lentiviral Systems
- 6.1.1.3. Retroviral Systems
- 6.1.1.4. Other Viral Gene Delivery Systems
- 6.1.2. Non-viral Gene Delivery
- 6.1.3. Combined Hybrid Delivery Systems
- 6.1.1. Viral Gene Delivery Systems
- 6.2. Market Analysis, Insights and Forecast - by Application
- 6.2.1. Oncology
- 6.2.2. Infectious Diseases
- 6.2.3. Cardiovascular Disorders
- 6.2.4. Diabetes
- 6.3. Market Analysis, Insights and Forecast - by Route of Administration
- 6.3.1. Oral
- 6.3.2. Injectable
- 6.3.3. Nasal
- 6.1. Market Analysis, Insights and Forecast - by Delivery Systems
- 7. Europe Gene Delivery System Industry Analysis, Insights and Forecast, 2019-2031
- 7.1. Market Analysis, Insights and Forecast - by Delivery Systems
- 7.1.1. Viral Gene Delivery Systems
- 7.1.1.1. Adenovirus Systems
- 7.1.1.2. Lentiviral Systems
- 7.1.1.3. Retroviral Systems
- 7.1.1.4. Other Viral Gene Delivery Systems
- 7.1.2. Non-viral Gene Delivery
- 7.1.3. Combined Hybrid Delivery Systems
- 7.1.1. Viral Gene Delivery Systems
- 7.2. Market Analysis, Insights and Forecast - by Application
- 7.2.1. Oncology
- 7.2.2. Infectious Diseases
- 7.2.3. Cardiovascular Disorders
- 7.2.4. Diabetes
- 7.3. Market Analysis, Insights and Forecast - by Route of Administration
- 7.3.1. Oral
- 7.3.2. Injectable
- 7.3.3. Nasal
- 7.1. Market Analysis, Insights and Forecast - by Delivery Systems
- 8. Asia Pacific Gene Delivery System Industry Analysis, Insights and Forecast, 2019-2031
- 8.1. Market Analysis, Insights and Forecast - by Delivery Systems
- 8.1.1. Viral Gene Delivery Systems
- 8.1.1.1. Adenovirus Systems
- 8.1.1.2. Lentiviral Systems
- 8.1.1.3. Retroviral Systems
- 8.1.1.4. Other Viral Gene Delivery Systems
- 8.1.2. Non-viral Gene Delivery
- 8.1.3. Combined Hybrid Delivery Systems
- 8.1.1. Viral Gene Delivery Systems
- 8.2. Market Analysis, Insights and Forecast - by Application
- 8.2.1. Oncology
- 8.2.2. Infectious Diseases
- 8.2.3. Cardiovascular Disorders
- 8.2.4. Diabetes
- 8.3. Market Analysis, Insights and Forecast - by Route of Administration
- 8.3.1. Oral
- 8.3.2. Injectable
- 8.3.3. Nasal
- 8.1. Market Analysis, Insights and Forecast - by Delivery Systems
- 9. Middle East and Africa Gene Delivery System Industry Analysis, Insights and Forecast, 2019-2031
- 9.1. Market Analysis, Insights and Forecast - by Delivery Systems
- 9.1.1. Viral Gene Delivery Systems
- 9.1.1.1. Adenovirus Systems
- 9.1.1.2. Lentiviral Systems
- 9.1.1.3. Retroviral Systems
- 9.1.1.4. Other Viral Gene Delivery Systems
- 9.1.2. Non-viral Gene Delivery
- 9.1.3. Combined Hybrid Delivery Systems
- 9.1.1. Viral Gene Delivery Systems
- 9.2. Market Analysis, Insights and Forecast - by Application
- 9.2.1. Oncology
- 9.2.2. Infectious Diseases
- 9.2.3. Cardiovascular Disorders
- 9.2.4. Diabetes
- 9.3. Market Analysis, Insights and Forecast - by Route of Administration
- 9.3.1. Oral
- 9.3.2. Injectable
- 9.3.3. Nasal
- 9.1. Market Analysis, Insights and Forecast - by Delivery Systems
- 10. South America Gene Delivery System Industry Analysis, Insights and Forecast, 2019-2031
- 10.1. Market Analysis, Insights and Forecast - by Delivery Systems
- 10.1.1. Viral Gene Delivery Systems
- 10.1.1.1. Adenovirus Systems
- 10.1.1.2. Lentiviral Systems
- 10.1.1.3. Retroviral Systems
- 10.1.1.4. Other Viral Gene Delivery Systems
- 10.1.2. Non-viral Gene Delivery
- 10.1.3. Combined Hybrid Delivery Systems
- 10.1.1. Viral Gene Delivery Systems
- 10.2. Market Analysis, Insights and Forecast - by Application
- 10.2.1. Oncology
- 10.2.2. Infectious Diseases
- 10.2.3. Cardiovascular Disorders
- 10.2.4. Diabetes
- 10.3. Market Analysis, Insights and Forecast - by Route of Administration
- 10.3.1. Oral
- 10.3.2. Injectable
- 10.3.3. Nasal
- 10.1. Market Analysis, Insights and Forecast - by Delivery Systems
- 11. North America Gene Delivery System Industry Analysis, Insights and Forecast, 2019-2031
- 11.1. Market Analysis, Insights and Forecast - By Country/Sub-region
- 11.1.1 United States
- 11.1.2 Canada
- 11.1.3 Mexico
- 12. Europe Gene Delivery System Industry Analysis, Insights and Forecast, 2019-2031
- 12.1. Market Analysis, Insights and Forecast - By Country/Sub-region
- 12.1.1 Germany
- 12.1.2 United Kingdom
- 12.1.3 France
- 12.1.4 Italy
- 12.1.5 Spain
- 12.1.6 Rest of Europe
- 13. Asia Pacific Gene Delivery System Industry Analysis, Insights and Forecast, 2019-2031
- 13.1. Market Analysis, Insights and Forecast - By Country/Sub-region
- 13.1.1 China
- 13.1.2 Japan
- 13.1.3 India
- 13.1.4 Australia
- 13.1.5 South Korea
- 13.1.6 Rest of Asia Pacific
- 14. Middle East and Africa Gene Delivery System Industry Analysis, Insights and Forecast, 2019-2031
- 14.1. Market Analysis, Insights and Forecast - By Country/Sub-region
- 14.1.1 GCC
- 14.1.2 South Africa
- 14.1.3 Rest of Middle East and Africa
- 15. South America Gene Delivery System Industry Analysis, Insights and Forecast, 2019-2031
- 15.1. Market Analysis, Insights and Forecast - By Country/Sub-region
- 15.1.1 Brazil
- 15.1.2 Argentina
- 15.1.3 Rest of South America
- 16. Competitive Analysis
- 16.1. Global Market Share Analysis 2024
- 16.2. Company Profiles
- 16.2.1 Becton Dickinson and Company
- 16.2.1.1. Overview
- 16.2.1.2. Products
- 16.2.1.3. SWOT Analysis
- 16.2.1.4. Recent Developments
- 16.2.1.5. Financials (Based on Availability)
- 16.2.2 Shanghai Sunway Biotech Co Ltd
- 16.2.2.1. Overview
- 16.2.2.2. Products
- 16.2.2.3. SWOT Analysis
- 16.2.2.4. Recent Developments
- 16.2.2.5. Financials (Based on Availability)
- 16.2.3 Bayer AG
- 16.2.3.1. Overview
- 16.2.3.2. Products
- 16.2.3.3. SWOT Analysis
- 16.2.3.4. Recent Developments
- 16.2.3.5. Financials (Based on Availability)
- 16.2.4 Novartis AG
- 16.2.4.1. Overview
- 16.2.4.2. Products
- 16.2.4.3. SWOT Analysis
- 16.2.4.4. Recent Developments
- 16.2.4.5. Financials (Based on Availability)
- 16.2.5 Amgen Inc
- 16.2.5.1. Overview
- 16.2.5.2. Products
- 16.2.5.3. SWOT Analysis
- 16.2.5.4. Recent Developments
- 16.2.5.5. Financials (Based on Availability)
- 16.2.6 Sirion-Biotech GmbH
- 16.2.6.1. Overview
- 16.2.6.2. Products
- 16.2.6.3. SWOT Analysis
- 16.2.6.4. Recent Developments
- 16.2.6.5. Financials (Based on Availability)
- 16.2.7 Takara Bio
- 16.2.7.1. Overview
- 16.2.7.2. Products
- 16.2.7.3. SWOT Analysis
- 16.2.7.4. Recent Developments
- 16.2.7.5. Financials (Based on Availability)
- 16.2.8 GenScript ProBio
- 16.2.8.1. Overview
- 16.2.8.2. Products
- 16.2.8.3. SWOT Analysis
- 16.2.8.4. Recent Developments
- 16.2.8.5. Financials (Based on Availability)
- 16.2.9 F Hoffmann-La Roche AG
- 16.2.9.1. Overview
- 16.2.9.2. Products
- 16.2.9.3. SWOT Analysis
- 16.2.9.4. Recent Developments
- 16.2.9.5. Financials (Based on Availability)
- 16.2.10 Shenzhen SiBiono GeneTech Co Ltd
- 16.2.10.1. Overview
- 16.2.10.2. Products
- 16.2.10.3. SWOT Analysis
- 16.2.10.4. Recent Developments
- 16.2.10.5. Financials (Based on Availability)
- 16.2.11 Batavia Biosciences
- 16.2.11.1. Overview
- 16.2.11.2. Products
- 16.2.11.3. SWOT Analysis
- 16.2.11.4. Recent Developments
- 16.2.11.5. Financials (Based on Availability)
- 16.2.12 Genezen
- 16.2.12.1. Overview
- 16.2.12.2. Products
- 16.2.12.3. SWOT Analysis
- 16.2.12.4. Recent Developments
- 16.2.12.5. Financials (Based on Availability)
- 16.2.13 Pfizer Inc
- 16.2.13.1. Overview
- 16.2.13.2. Products
- 16.2.13.3. SWOT Analysis
- 16.2.13.4. Recent Developments
- 16.2.13.5. Financials (Based on Availability)
- 16.2.1 Becton Dickinson and Company
List of Figures
- Figure 1: Global Gene Delivery System Industry Revenue Breakdown (Million, %) by Region 2024 & 2032
- Figure 2: Global Gene Delivery System Industry Volume Breakdown (K Unit, %) by Region 2024 & 2032
- Figure 3: North America Gene Delivery System Industry Revenue (Million), by Country 2024 & 2032
- Figure 4: North America Gene Delivery System Industry Volume (K Unit), by Country 2024 & 2032
- Figure 5: North America Gene Delivery System Industry Revenue Share (%), by Country 2024 & 2032
- Figure 6: North America Gene Delivery System Industry Volume Share (%), by Country 2024 & 2032
- Figure 7: Europe Gene Delivery System Industry Revenue (Million), by Country 2024 & 2032
- Figure 8: Europe Gene Delivery System Industry Volume (K Unit), by Country 2024 & 2032
- Figure 9: Europe Gene Delivery System Industry Revenue Share (%), by Country 2024 & 2032
- Figure 10: Europe Gene Delivery System Industry Volume Share (%), by Country 2024 & 2032
- Figure 11: Asia Pacific Gene Delivery System Industry Revenue (Million), by Country 2024 & 2032
- Figure 12: Asia Pacific Gene Delivery System Industry Volume (K Unit), by Country 2024 & 2032
- Figure 13: Asia Pacific Gene Delivery System Industry Revenue Share (%), by Country 2024 & 2032
- Figure 14: Asia Pacific Gene Delivery System Industry Volume Share (%), by Country 2024 & 2032
- Figure 15: Middle East and Africa Gene Delivery System Industry Revenue (Million), by Country 2024 & 2032
- Figure 16: Middle East and Africa Gene Delivery System Industry Volume (K Unit), by Country 2024 & 2032
- Figure 17: Middle East and Africa Gene Delivery System Industry Revenue Share (%), by Country 2024 & 2032
- Figure 18: Middle East and Africa Gene Delivery System Industry Volume Share (%), by Country 2024 & 2032
- Figure 19: South America Gene Delivery System Industry Revenue (Million), by Country 2024 & 2032
- Figure 20: South America Gene Delivery System Industry Volume (K Unit), by Country 2024 & 2032
- Figure 21: South America Gene Delivery System Industry Revenue Share (%), by Country 2024 & 2032
- Figure 22: South America Gene Delivery System Industry Volume Share (%), by Country 2024 & 2032
- Figure 23: North America Gene Delivery System Industry Revenue (Million), by Delivery Systems 2024 & 2032
- Figure 24: North America Gene Delivery System Industry Volume (K Unit), by Delivery Systems 2024 & 2032
- Figure 25: North America Gene Delivery System Industry Revenue Share (%), by Delivery Systems 2024 & 2032
- Figure 26: North America Gene Delivery System Industry Volume Share (%), by Delivery Systems 2024 & 2032
- Figure 27: North America Gene Delivery System Industry Revenue (Million), by Application 2024 & 2032
- Figure 28: North America Gene Delivery System Industry Volume (K Unit), by Application 2024 & 2032
- Figure 29: North America Gene Delivery System Industry Revenue Share (%), by Application 2024 & 2032
- Figure 30: North America Gene Delivery System Industry Volume Share (%), by Application 2024 & 2032
- Figure 31: North America Gene Delivery System Industry Revenue (Million), by Route of Administration 2024 & 2032
- Figure 32: North America Gene Delivery System Industry Volume (K Unit), by Route of Administration 2024 & 2032
- Figure 33: North America Gene Delivery System Industry Revenue Share (%), by Route of Administration 2024 & 2032
- Figure 34: North America Gene Delivery System Industry Volume Share (%), by Route of Administration 2024 & 2032
- Figure 35: North America Gene Delivery System Industry Revenue (Million), by Country 2024 & 2032
- Figure 36: North America Gene Delivery System Industry Volume (K Unit), by Country 2024 & 2032
- Figure 37: North America Gene Delivery System Industry Revenue Share (%), by Country 2024 & 2032
- Figure 38: North America Gene Delivery System Industry Volume Share (%), by Country 2024 & 2032
- Figure 39: Europe Gene Delivery System Industry Revenue (Million), by Delivery Systems 2024 & 2032
- Figure 40: Europe Gene Delivery System Industry Volume (K Unit), by Delivery Systems 2024 & 2032
- Figure 41: Europe Gene Delivery System Industry Revenue Share (%), by Delivery Systems 2024 & 2032
- Figure 42: Europe Gene Delivery System Industry Volume Share (%), by Delivery Systems 2024 & 2032
- Figure 43: Europe Gene Delivery System Industry Revenue (Million), by Application 2024 & 2032
- Figure 44: Europe Gene Delivery System Industry Volume (K Unit), by Application 2024 & 2032
- Figure 45: Europe Gene Delivery System Industry Revenue Share (%), by Application 2024 & 2032
- Figure 46: Europe Gene Delivery System Industry Volume Share (%), by Application 2024 & 2032
- Figure 47: Europe Gene Delivery System Industry Revenue (Million), by Route of Administration 2024 & 2032
- Figure 48: Europe Gene Delivery System Industry Volume (K Unit), by Route of Administration 2024 & 2032
- Figure 49: Europe Gene Delivery System Industry Revenue Share (%), by Route of Administration 2024 & 2032
- Figure 50: Europe Gene Delivery System Industry Volume Share (%), by Route of Administration 2024 & 2032
- Figure 51: Europe Gene Delivery System Industry Revenue (Million), by Country 2024 & 2032
- Figure 52: Europe Gene Delivery System Industry Volume (K Unit), by Country 2024 & 2032
- Figure 53: Europe Gene Delivery System Industry Revenue Share (%), by Country 2024 & 2032
- Figure 54: Europe Gene Delivery System Industry Volume Share (%), by Country 2024 & 2032
- Figure 55: Asia Pacific Gene Delivery System Industry Revenue (Million), by Delivery Systems 2024 & 2032
- Figure 56: Asia Pacific Gene Delivery System Industry Volume (K Unit), by Delivery Systems 2024 & 2032
- Figure 57: Asia Pacific Gene Delivery System Industry Revenue Share (%), by Delivery Systems 2024 & 2032
- Figure 58: Asia Pacific Gene Delivery System Industry Volume Share (%), by Delivery Systems 2024 & 2032
- Figure 59: Asia Pacific Gene Delivery System Industry Revenue (Million), by Application 2024 & 2032
- Figure 60: Asia Pacific Gene Delivery System Industry Volume (K Unit), by Application 2024 & 2032
- Figure 61: Asia Pacific Gene Delivery System Industry Revenue Share (%), by Application 2024 & 2032
- Figure 62: Asia Pacific Gene Delivery System Industry Volume Share (%), by Application 2024 & 2032
- Figure 63: Asia Pacific Gene Delivery System Industry Revenue (Million), by Route of Administration 2024 & 2032
- Figure 64: Asia Pacific Gene Delivery System Industry Volume (K Unit), by Route of Administration 2024 & 2032
- Figure 65: Asia Pacific Gene Delivery System Industry Revenue Share (%), by Route of Administration 2024 & 2032
- Figure 66: Asia Pacific Gene Delivery System Industry Volume Share (%), by Route of Administration 2024 & 2032
- Figure 67: Asia Pacific Gene Delivery System Industry Revenue (Million), by Country 2024 & 2032
- Figure 68: Asia Pacific Gene Delivery System Industry Volume (K Unit), by Country 2024 & 2032
- Figure 69: Asia Pacific Gene Delivery System Industry Revenue Share (%), by Country 2024 & 2032
- Figure 70: Asia Pacific Gene Delivery System Industry Volume Share (%), by Country 2024 & 2032
- Figure 71: Middle East and Africa Gene Delivery System Industry Revenue (Million), by Delivery Systems 2024 & 2032
- Figure 72: Middle East and Africa Gene Delivery System Industry Volume (K Unit), by Delivery Systems 2024 & 2032
- Figure 73: Middle East and Africa Gene Delivery System Industry Revenue Share (%), by Delivery Systems 2024 & 2032
- Figure 74: Middle East and Africa Gene Delivery System Industry Volume Share (%), by Delivery Systems 2024 & 2032
- Figure 75: Middle East and Africa Gene Delivery System Industry Revenue (Million), by Application 2024 & 2032
- Figure 76: Middle East and Africa Gene Delivery System Industry Volume (K Unit), by Application 2024 & 2032
- Figure 77: Middle East and Africa Gene Delivery System Industry Revenue Share (%), by Application 2024 & 2032
- Figure 78: Middle East and Africa Gene Delivery System Industry Volume Share (%), by Application 2024 & 2032
- Figure 79: Middle East and Africa Gene Delivery System Industry Revenue (Million), by Route of Administration 2024 & 2032
- Figure 80: Middle East and Africa Gene Delivery System Industry Volume (K Unit), by Route of Administration 2024 & 2032
- Figure 81: Middle East and Africa Gene Delivery System Industry Revenue Share (%), by Route of Administration 2024 & 2032
- Figure 82: Middle East and Africa Gene Delivery System Industry Volume Share (%), by Route of Administration 2024 & 2032
- Figure 83: Middle East and Africa Gene Delivery System Industry Revenue (Million), by Country 2024 & 2032
- Figure 84: Middle East and Africa Gene Delivery System Industry Volume (K Unit), by Country 2024 & 2032
- Figure 85: Middle East and Africa Gene Delivery System Industry Revenue Share (%), by Country 2024 & 2032
- Figure 86: Middle East and Africa Gene Delivery System Industry Volume Share (%), by Country 2024 & 2032
- Figure 87: South America Gene Delivery System Industry Revenue (Million), by Delivery Systems 2024 & 2032
- Figure 88: South America Gene Delivery System Industry Volume (K Unit), by Delivery Systems 2024 & 2032
- Figure 89: South America Gene Delivery System Industry Revenue Share (%), by Delivery Systems 2024 & 2032
- Figure 90: South America Gene Delivery System Industry Volume Share (%), by Delivery Systems 2024 & 2032
- Figure 91: South America Gene Delivery System Industry Revenue (Million), by Application 2024 & 2032
- Figure 92: South America Gene Delivery System Industry Volume (K Unit), by Application 2024 & 2032
- Figure 93: South America Gene Delivery System Industry Revenue Share (%), by Application 2024 & 2032
- Figure 94: South America Gene Delivery System Industry Volume Share (%), by Application 2024 & 2032
- Figure 95: South America Gene Delivery System Industry Revenue (Million), by Route of Administration 2024 & 2032
- Figure 96: South America Gene Delivery System Industry Volume (K Unit), by Route of Administration 2024 & 2032
- Figure 97: South America Gene Delivery System Industry Revenue Share (%), by Route of Administration 2024 & 2032
- Figure 98: South America Gene Delivery System Industry Volume Share (%), by Route of Administration 2024 & 2032
- Figure 99: South America Gene Delivery System Industry Revenue (Million), by Country 2024 & 2032
- Figure 100: South America Gene Delivery System Industry Volume (K Unit), by Country 2024 & 2032
- Figure 101: South America Gene Delivery System Industry Revenue Share (%), by Country 2024 & 2032
- Figure 102: South America Gene Delivery System Industry Volume Share (%), by Country 2024 & 2032
List of Tables
- Table 1: Global Gene Delivery System Industry Revenue Million Forecast, by Region 2019 & 2032
- Table 2: Global Gene Delivery System Industry Volume K Unit Forecast, by Region 2019 & 2032
- Table 3: Global Gene Delivery System Industry Revenue Million Forecast, by Delivery Systems 2019 & 2032
- Table 4: Global Gene Delivery System Industry Volume K Unit Forecast, by Delivery Systems 2019 & 2032
- Table 5: Global Gene Delivery System Industry Revenue Million Forecast, by Application 2019 & 2032
- Table 6: Global Gene Delivery System Industry Volume K Unit Forecast, by Application 2019 & 2032
- Table 7: Global Gene Delivery System Industry Revenue Million Forecast, by Route of Administration 2019 & 2032
- Table 8: Global Gene Delivery System Industry Volume K Unit Forecast, by Route of Administration 2019 & 2032
- Table 9: Global Gene Delivery System Industry Revenue Million Forecast, by Region 2019 & 2032
- Table 10: Global Gene Delivery System Industry Volume K Unit Forecast, by Region 2019 & 2032
- Table 11: Global Gene Delivery System Industry Revenue Million Forecast, by Country 2019 & 2032
- Table 12: Global Gene Delivery System Industry Volume K Unit Forecast, by Country 2019 & 2032
- Table 13: United States Gene Delivery System Industry Revenue (Million) Forecast, by Application 2019 & 2032
- Table 14: United States Gene Delivery System Industry Volume (K Unit) Forecast, by Application 2019 & 2032
- Table 15: Canada Gene Delivery System Industry Revenue (Million) Forecast, by Application 2019 & 2032
- Table 16: Canada Gene Delivery System Industry Volume (K Unit) Forecast, by Application 2019 & 2032
- Table 17: Mexico Gene Delivery System Industry Revenue (Million) Forecast, by Application 2019 & 2032
- Table 18: Mexico Gene Delivery System Industry Volume (K Unit) Forecast, by Application 2019 & 2032
- Table 19: Global Gene Delivery System Industry Revenue Million Forecast, by Country 2019 & 2032
- Table 20: Global Gene Delivery System Industry Volume K Unit Forecast, by Country 2019 & 2032
- Table 21: Germany Gene Delivery System Industry Revenue (Million) Forecast, by Application 2019 & 2032
- Table 22: Germany Gene Delivery System Industry Volume (K Unit) Forecast, by Application 2019 & 2032
- Table 23: United Kingdom Gene Delivery System Industry Revenue (Million) Forecast, by Application 2019 & 2032
- Table 24: United Kingdom Gene Delivery System Industry Volume (K Unit) Forecast, by Application 2019 & 2032
- Table 25: France Gene Delivery System Industry Revenue (Million) Forecast, by Application 2019 & 2032
- Table 26: France Gene Delivery System Industry Volume (K Unit) Forecast, by Application 2019 & 2032
- Table 27: Italy Gene Delivery System Industry Revenue (Million) Forecast, by Application 2019 & 2032
- Table 28: Italy Gene Delivery System Industry Volume (K Unit) Forecast, by Application 2019 & 2032
- Table 29: Spain Gene Delivery System Industry Revenue (Million) Forecast, by Application 2019 & 2032
- Table 30: Spain Gene Delivery System Industry Volume (K Unit) Forecast, by Application 2019 & 2032
- Table 31: Rest of Europe Gene Delivery System Industry Revenue (Million) Forecast, by Application 2019 & 2032
- Table 32: Rest of Europe Gene Delivery System Industry Volume (K Unit) Forecast, by Application 2019 & 2032
- Table 33: Global Gene Delivery System Industry Revenue Million Forecast, by Country 2019 & 2032
- Table 34: Global Gene Delivery System Industry Volume K Unit Forecast, by Country 2019 & 2032
- Table 35: China Gene Delivery System Industry Revenue (Million) Forecast, by Application 2019 & 2032
- Table 36: China Gene Delivery System Industry Volume (K Unit) Forecast, by Application 2019 & 2032
- Table 37: Japan Gene Delivery System Industry Revenue (Million) Forecast, by Application 2019 & 2032
- Table 38: Japan Gene Delivery System Industry Volume (K Unit) Forecast, by Application 2019 & 2032
- Table 39: India Gene Delivery System Industry Revenue (Million) Forecast, by Application 2019 & 2032
- Table 40: India Gene Delivery System Industry Volume (K Unit) Forecast, by Application 2019 & 2032
- Table 41: Australia Gene Delivery System Industry Revenue (Million) Forecast, by Application 2019 & 2032
- Table 42: Australia Gene Delivery System Industry Volume (K Unit) Forecast, by Application 2019 & 2032
- Table 43: South Korea Gene Delivery System Industry Revenue (Million) Forecast, by Application 2019 & 2032
- Table 44: South Korea Gene Delivery System Industry Volume (K Unit) Forecast, by Application 2019 & 2032
- Table 45: Rest of Asia Pacific Gene Delivery System Industry Revenue (Million) Forecast, by Application 2019 & 2032
- Table 46: Rest of Asia Pacific Gene Delivery System Industry Volume (K Unit) Forecast, by Application 2019 & 2032
- Table 47: Global Gene Delivery System Industry Revenue Million Forecast, by Country 2019 & 2032
- Table 48: Global Gene Delivery System Industry Volume K Unit Forecast, by Country 2019 & 2032
- Table 49: GCC Gene Delivery System Industry Revenue (Million) Forecast, by Application 2019 & 2032
- Table 50: GCC Gene Delivery System Industry Volume (K Unit) Forecast, by Application 2019 & 2032
- Table 51: South Africa Gene Delivery System Industry Revenue (Million) Forecast, by Application 2019 & 2032
- Table 52: South Africa Gene Delivery System Industry Volume (K Unit) Forecast, by Application 2019 & 2032
- Table 53: Rest of Middle East and Africa Gene Delivery System Industry Revenue (Million) Forecast, by Application 2019 & 2032
- Table 54: Rest of Middle East and Africa Gene Delivery System Industry Volume (K Unit) Forecast, by Application 2019 & 2032
- Table 55: Global Gene Delivery System Industry Revenue Million Forecast, by Country 2019 & 2032
- Table 56: Global Gene Delivery System Industry Volume K Unit Forecast, by Country 2019 & 2032
- Table 57: Brazil Gene Delivery System Industry Revenue (Million) Forecast, by Application 2019 & 2032
- Table 58: Brazil Gene Delivery System Industry Volume (K Unit) Forecast, by Application 2019 & 2032
- Table 59: Argentina Gene Delivery System Industry Revenue (Million) Forecast, by Application 2019 & 2032
- Table 60: Argentina Gene Delivery System Industry Volume (K Unit) Forecast, by Application 2019 & 2032
- Table 61: Rest of South America Gene Delivery System Industry Revenue (Million) Forecast, by Application 2019 & 2032
- Table 62: Rest of South America Gene Delivery System Industry Volume (K Unit) Forecast, by Application 2019 & 2032
- Table 63: Global Gene Delivery System Industry Revenue Million Forecast, by Delivery Systems 2019 & 2032
- Table 64: Global Gene Delivery System Industry Volume K Unit Forecast, by Delivery Systems 2019 & 2032
- Table 65: Global Gene Delivery System Industry Revenue Million Forecast, by Application 2019 & 2032
- Table 66: Global Gene Delivery System Industry Volume K Unit Forecast, by Application 2019 & 2032
- Table 67: Global Gene Delivery System Industry Revenue Million Forecast, by Route of Administration 2019 & 2032
- Table 68: Global Gene Delivery System Industry Volume K Unit Forecast, by Route of Administration 2019 & 2032
- Table 69: Global Gene Delivery System Industry Revenue Million Forecast, by Country 2019 & 2032
- Table 70: Global Gene Delivery System Industry Volume K Unit Forecast, by Country 2019 & 2032
- Table 71: United States Gene Delivery System Industry Revenue (Million) Forecast, by Application 2019 & 2032
- Table 72: United States Gene Delivery System Industry Volume (K Unit) Forecast, by Application 2019 & 2032
- Table 73: Canada Gene Delivery System Industry Revenue (Million) Forecast, by Application 2019 & 2032
- Table 74: Canada Gene Delivery System Industry Volume (K Unit) Forecast, by Application 2019 & 2032
- Table 75: Mexico Gene Delivery System Industry Revenue (Million) Forecast, by Application 2019 & 2032
- Table 76: Mexico Gene Delivery System Industry Volume (K Unit) Forecast, by Application 2019 & 2032
- Table 77: Global Gene Delivery System Industry Revenue Million Forecast, by Delivery Systems 2019 & 2032
- Table 78: Global Gene Delivery System Industry Volume K Unit Forecast, by Delivery Systems 2019 & 2032
- Table 79: Global Gene Delivery System Industry Revenue Million Forecast, by Application 2019 & 2032
- Table 80: Global Gene Delivery System Industry Volume K Unit Forecast, by Application 2019 & 2032
- Table 81: Global Gene Delivery System Industry Revenue Million Forecast, by Route of Administration 2019 & 2032
- Table 82: Global Gene Delivery System Industry Volume K Unit Forecast, by Route of Administration 2019 & 2032
- Table 83: Global Gene Delivery System Industry Revenue Million Forecast, by Country 2019 & 2032
- Table 84: Global Gene Delivery System Industry Volume K Unit Forecast, by Country 2019 & 2032
- Table 85: Germany Gene Delivery System Industry Revenue (Million) Forecast, by Application 2019 & 2032
- Table 86: Germany Gene Delivery System Industry Volume (K Unit) Forecast, by Application 2019 & 2032
- Table 87: United Kingdom Gene Delivery System Industry Revenue (Million) Forecast, by Application 2019 & 2032
- Table 88: United Kingdom Gene Delivery System Industry Volume (K Unit) Forecast, by Application 2019 & 2032
- Table 89: France Gene Delivery System Industry Revenue (Million) Forecast, by Application 2019 & 2032
- Table 90: France Gene Delivery System Industry Volume (K Unit) Forecast, by Application 2019 & 2032
- Table 91: Italy Gene Delivery System Industry Revenue (Million) Forecast, by Application 2019 & 2032
- Table 92: Italy Gene Delivery System Industry Volume (K Unit) Forecast, by Application 2019 & 2032
- Table 93: Spain Gene Delivery System Industry Revenue (Million) Forecast, by Application 2019 & 2032
- Table 94: Spain Gene Delivery System Industry Volume (K Unit) Forecast, by Application 2019 & 2032
- Table 95: Rest of Europe Gene Delivery System Industry Revenue (Million) Forecast, by Application 2019 & 2032
- Table 96: Rest of Europe Gene Delivery System Industry Volume (K Unit) Forecast, by Application 2019 & 2032
- Table 97: Global Gene Delivery System Industry Revenue Million Forecast, by Delivery Systems 2019 & 2032
- Table 98: Global Gene Delivery System Industry Volume K Unit Forecast, by Delivery Systems 2019 & 2032
- Table 99: Global Gene Delivery System Industry Revenue Million Forecast, by Application 2019 & 2032
- Table 100: Global Gene Delivery System Industry Volume K Unit Forecast, by Application 2019 & 2032
- Table 101: Global Gene Delivery System Industry Revenue Million Forecast, by Route of Administration 2019 & 2032
- Table 102: Global Gene Delivery System Industry Volume K Unit Forecast, by Route of Administration 2019 & 2032
- Table 103: Global Gene Delivery System Industry Revenue Million Forecast, by Country 2019 & 2032
- Table 104: Global Gene Delivery System Industry Volume K Unit Forecast, by Country 2019 & 2032
- Table 105: China Gene Delivery System Industry Revenue (Million) Forecast, by Application 2019 & 2032
- Table 106: China Gene Delivery System Industry Volume (K Unit) Forecast, by Application 2019 & 2032
- Table 107: Japan Gene Delivery System Industry Revenue (Million) Forecast, by Application 2019 & 2032
- Table 108: Japan Gene Delivery System Industry Volume (K Unit) Forecast, by Application 2019 & 2032
- Table 109: India Gene Delivery System Industry Revenue (Million) Forecast, by Application 2019 & 2032
- Table 110: India Gene Delivery System Industry Volume (K Unit) Forecast, by Application 2019 & 2032
- Table 111: Australia Gene Delivery System Industry Revenue (Million) Forecast, by Application 2019 & 2032
- Table 112: Australia Gene Delivery System Industry Volume (K Unit) Forecast, by Application 2019 & 2032
- Table 113: South Korea Gene Delivery System Industry Revenue (Million) Forecast, by Application 2019 & 2032
- Table 114: South Korea Gene Delivery System Industry Volume (K Unit) Forecast, by Application 2019 & 2032
- Table 115: Rest of Asia Pacific Gene Delivery System Industry Revenue (Million) Forecast, by Application 2019 & 2032
- Table 116: Rest of Asia Pacific Gene Delivery System Industry Volume (K Unit) Forecast, by Application 2019 & 2032
- Table 117: Global Gene Delivery System Industry Revenue Million Forecast, by Delivery Systems 2019 & 2032
- Table 118: Global Gene Delivery System Industry Volume K Unit Forecast, by Delivery Systems 2019 & 2032
- Table 119: Global Gene Delivery System Industry Revenue Million Forecast, by Application 2019 & 2032
- Table 120: Global Gene Delivery System Industry Volume K Unit Forecast, by Application 2019 & 2032
- Table 121: Global Gene Delivery System Industry Revenue Million Forecast, by Route of Administration 2019 & 2032
- Table 122: Global Gene Delivery System Industry Volume K Unit Forecast, by Route of Administration 2019 & 2032
- Table 123: Global Gene Delivery System Industry Revenue Million Forecast, by Country 2019 & 2032
- Table 124: Global Gene Delivery System Industry Volume K Unit Forecast, by Country 2019 & 2032
- Table 125: GCC Gene Delivery System Industry Revenue (Million) Forecast, by Application 2019 & 2032
- Table 126: GCC Gene Delivery System Industry Volume (K Unit) Forecast, by Application 2019 & 2032
- Table 127: South Africa Gene Delivery System Industry Revenue (Million) Forecast, by Application 2019 & 2032
- Table 128: South Africa Gene Delivery System Industry Volume (K Unit) Forecast, by Application 2019 & 2032
- Table 129: Rest of Middle East and Africa Gene Delivery System Industry Revenue (Million) Forecast, by Application 2019 & 2032
- Table 130: Rest of Middle East and Africa Gene Delivery System Industry Volume (K Unit) Forecast, by Application 2019 & 2032
- Table 131: Global Gene Delivery System Industry Revenue Million Forecast, by Delivery Systems 2019 & 2032
- Table 132: Global Gene Delivery System Industry Volume K Unit Forecast, by Delivery Systems 2019 & 2032
- Table 133: Global Gene Delivery System Industry Revenue Million Forecast, by Application 2019 & 2032
- Table 134: Global Gene Delivery System Industry Volume K Unit Forecast, by Application 2019 & 2032
- Table 135: Global Gene Delivery System Industry Revenue Million Forecast, by Route of Administration 2019 & 2032
- Table 136: Global Gene Delivery System Industry Volume K Unit Forecast, by Route of Administration 2019 & 2032
- Table 137: Global Gene Delivery System Industry Revenue Million Forecast, by Country 2019 & 2032
- Table 138: Global Gene Delivery System Industry Volume K Unit Forecast, by Country 2019 & 2032
- Table 139: Brazil Gene Delivery System Industry Revenue (Million) Forecast, by Application 2019 & 2032
- Table 140: Brazil Gene Delivery System Industry Volume (K Unit) Forecast, by Application 2019 & 2032
- Table 141: Argentina Gene Delivery System Industry Revenue (Million) Forecast, by Application 2019 & 2032
- Table 142: Argentina Gene Delivery System Industry Volume (K Unit) Forecast, by Application 2019 & 2032
- Table 143: Rest of South America Gene Delivery System Industry Revenue (Million) Forecast, by Application 2019 & 2032
- Table 144: Rest of South America Gene Delivery System Industry Volume (K Unit) Forecast, by Application 2019 & 2032
Frequently Asked Questions
1. What is the projected Compound Annual Growth Rate (CAGR) of the Gene Delivery System Industry?
The projected CAGR is approximately 7.30%.
2. Which companies are prominent players in the Gene Delivery System Industry?
Key companies in the market include Becton Dickinson and Company, Shanghai Sunway Biotech Co Ltd, Bayer AG, Novartis AG, Amgen Inc, Sirion-Biotech GmbH, Takara Bio, GenScript ProBio, F Hoffmann-La Roche AG, Shenzhen SiBiono GeneTech Co Ltd, Batavia Biosciences, Genezen, Pfizer Inc.
3. What are the main segments of the Gene Delivery System Industry?
The market segments include Delivery Systems, Application, Route of Administration.
4. Can you provide details about the market size?
The market size is estimated to be USD XX Million as of 2022.
5. What are some drivers contributing to market growth?
Growing Burden of Chronic Diseases and Lifestyle Disorders; Technological Advancements in Research by Biopharmaceutical Companies.
6. What are the notable trends driving market growth?
Viral Gene Delivery Systems Segment is Expected to Hold the Largest Share in the Gene Delivery Systems Market.
7. Are there any restraints impacting market growth?
High Cost of Treatment.
8. Can you provide examples of recent developments in the market?
In August 2022, Versant Ventures launched Vector BioPharma AG, a biopharmaceutical company developing a precision gene delivery platform devoid of viral genes.
9. What pricing options are available for accessing the report?
Pricing options include single-user, multi-user, and enterprise licenses priced at USD 4750, USD 5250, and USD 8750 respectively.
10. Is the market size provided in terms of value or volume?
The market size is provided in terms of value, measured in Million and volume, measured in K Unit.
11. Are there any specific market keywords associated with the report?
Yes, the market keyword associated with the report is "Gene Delivery System Industry," which aids in identifying and referencing the specific market segment covered.
12. How do I determine which pricing option suits my needs best?
The pricing options vary based on user requirements and access needs. Individual users may opt for single-user licenses, while businesses requiring broader access may choose multi-user or enterprise licenses for cost-effective access to the report.
13. Are there any additional resources or data provided in the Gene Delivery System Industry report?
While the report offers comprehensive insights, it's advisable to review the specific contents or supplementary materials provided to ascertain if additional resources or data are available.
14. How can I stay updated on further developments or reports in the Gene Delivery System Industry?
To stay informed about further developments, trends, and reports in the Gene Delivery System Industry, consider subscribing to industry newsletters, following relevant companies and organizations, or regularly checking reputable industry news sources and publications.
Methodology
Step 1 - Identification of Relevant Samples Size from Population Database


Step 2 - Approaches for Defining Global Market Size (Value, Volume* & Price*)

Note*: In applicable scenarios
Step 3 - Data Sources
Primary Research
- Web Analytics
- Survey Reports
- Research Institute
- Latest Research Reports
- Opinion Leaders
Secondary Research
- Annual Reports
- White Paper
- Latest Press Release
- Industry Association
- Paid Database
- Investor Presentations

Step 4 - Data Triangulation
Involves using different sources of information in order to increase the validity of a study
These sources are likely to be stakeholders in a program - participants, other researchers, program staff, other community members, and so on.
Then we put all data in single framework & apply various statistical tools to find out the dynamic on the market.
During the analysis stage, feedback from the stakeholder groups would be compared to determine areas of agreement as well as areas of divergence
