

Key Insights
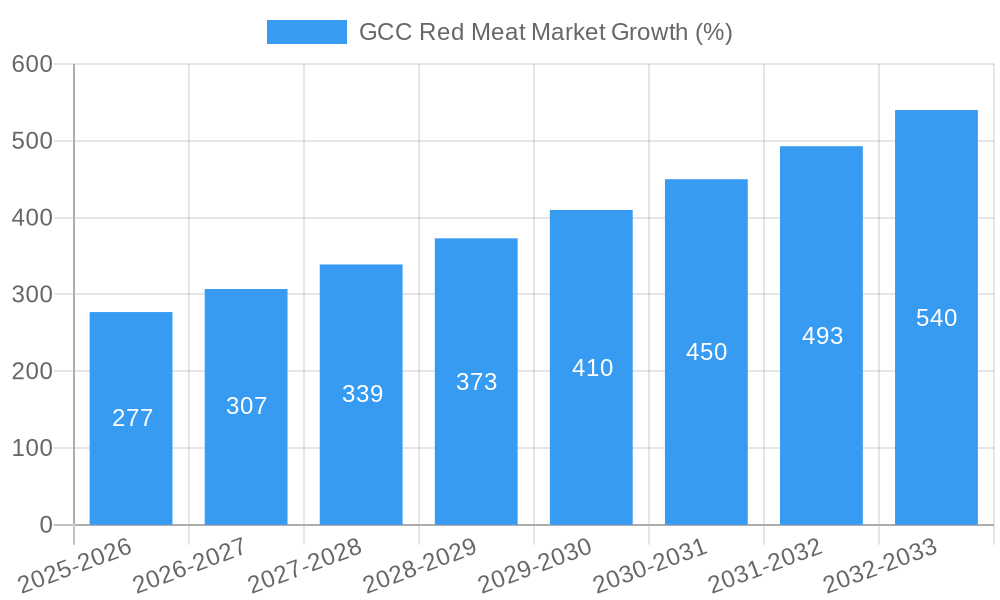
The GCC red meat market, valued at $3.93 billion in 2025, is projected to experience robust growth, exhibiting a Compound Annual Growth Rate (CAGR) of 7.02% from 2025 to 2033. This expansion is driven by several key factors. Rising disposable incomes within the GCC region are fueling increased demand for protein-rich foods, with red meat remaining a staple in many diets. Furthermore, the growing popularity of convenient, ready-to-eat red meat products, particularly canned and processed options, contributes significantly to market growth. Government initiatives promoting food security and diversification within the region also play a supportive role, encouraging investment in the red meat sector and bolstering domestic production. However, challenges remain. Fluctuations in global meat prices, coupled with increasing concerns about the environmental impact of red meat consumption, pose potential restraints on market expansion. The market is segmented by distribution channel (off-trade, primarily supermarkets and retail outlets, and on-trade, encompassing restaurants and food service establishments) and form (canned, fresh/chilled, frozen, and processed). Key players like Almunajem Foods, BRF S.A, and JBS S.A are vying for market share, deploying strategies focused on product innovation, brand building, and efficient supply chains to cater to the evolving consumer preferences in the GCC. Competition is expected to intensify as regional players expand their product offerings and international companies seek opportunities within this lucrative market. The UAE, Saudi Arabia, and South Africa represent significant market segments within the Middle East and Africa region, exhibiting differing growth trajectories based on unique socio-economic factors and consumer preferences.
The projected growth trajectory for the GCC red meat market indicates significant opportunities for businesses operating in this sector. The continued focus on product diversification, catering to evolving consumer demands for convenience and health-conscious options, combined with strategic investments in sustainable and efficient production methods, will be crucial for achieving sustainable growth and market leadership. The balance between meeting the escalating demand for red meat and addressing concerns about sustainability and price volatility will shape the future landscape of this dynamic market. Understanding regional nuances and consumer preferences will be paramount for success within the diverse GCC market.

GCC Red Meat Market: A Comprehensive Market Report (2019-2033)
This insightful report provides a detailed analysis of the GCC red meat market, offering a comprehensive overview of market dynamics, key players, and future growth prospects. With a study period spanning 2019-2033, a base year of 2025, and a forecast period of 2025-2033, this report is an indispensable resource for stakeholders seeking to understand and capitalize on opportunities within this dynamic sector. The market is expected to reach xx Million by 2033, driven by factors such as increasing consumer demand and strategic partnerships.
GCC Red Meat Market Composition & Trends
This section evaluates the competitive landscape of the GCC red meat market, examining market concentration, innovation drivers, regulatory frameworks, substitute products, end-user profiles, and mergers & acquisitions (M&A) activity. The market exhibits a moderately concentrated structure, with key players such as Almunajem Foods, Tanmiah Food Company, and JBS SA holding significant market share. However, the presence of numerous smaller players indicates a dynamic and competitive environment.
- Market Share Distribution: Almunajem Foods holds an estimated xx% market share, followed by Tanmiah Food Company at xx% and JBS SA at xx%. The remaining market share is distributed among other players, including The Organic Meat Company Ltd, BRF S.A., The Savola Group, Kibsons International LLC, and Golden Gate Meat Company.
- M&A Activity: The GCC red meat market has witnessed significant M&A activity in recent years, with deal values totaling an estimated xx Million in the period 2019-2024. These activities reflect the industry's consolidation and expansion strategies.
- Innovation Catalysts: Technological advancements in meat processing, packaging, and distribution are driving innovation within the market. The increasing demand for sustainable and ethically sourced red meat is also fostering innovation in farming practices and product offerings.
- Regulatory Landscape: Government regulations concerning food safety, labeling, and animal welfare play a crucial role in shaping market dynamics. These regulations impact production methods, pricing, and market access for various players.
- Substitute Products: Poultry and seafood are major substitute products for red meat, impacting market share and consumer choices. The growing popularity of plant-based meat alternatives further adds to the competitive landscape.
GCC Red Meat Market Industry Evolution
This section delves into the historical and projected evolution of the GCC red meat market, focusing on growth trajectories, technological advancements, and evolving consumer preferences. The market has witnessed robust growth during the historical period (2019-2024), with a Compound Annual Growth Rate (CAGR) of xx%. This growth is projected to continue during the forecast period (2025-2033), albeit at a slightly moderated pace, with a projected CAGR of xx%. Several factors contribute to this growth, including rising disposable incomes, changing dietary habits, and increased urbanization. The adoption of advanced technologies in meat processing and supply chain management is also contributing to improved efficiency and product quality. Consumer preferences are shifting towards healthier and more sustainable red meat options, driving innovation in product offerings and marketing strategies. This includes a growing interest in organic and grass-fed red meat. The increasing demand for convenience has also led to the growth of processed red meat products.
Leading Regions, Countries, or Segments in GCC Red Meat Market
The GCC red meat market is a dynamic landscape characterized by diverse segments and significant regional variations. In 2025, the off-trade distribution channel held a commanding position, accounting for an estimated xx% of total sales. This dominance stems from the extensive retail infrastructure, including a vast network of supermarkets and hypermarkets, and the strong consumer preference for purchasing red meat from these established outlets.
Key Drivers of Off-Trade Dominance:
- Extensive and readily accessible retail infrastructure ensuring widespread product availability.
- A growing consumer preference for the convenience and wide selection offered by established retail stores.
- Significant investment in robust cold chain logistics guarantees product freshness and maintains high quality standards.
Fresh/Chilled Segment: This segment commands a substantial market share, fueled by consumer demand for the superior quality and freshness associated with chilled red meat.
Frozen Segment: The frozen segment continues to experience steady growth, driven by its inherent convenience and extended shelf life, providing consumers with a practical and longer-lasting option.
On-Trade Segment: While smaller than the off-trade segment, the on-trade sector exhibits promising growth potential, largely influenced by the flourishing food service industry and increasing demand for high-quality red meat in restaurants and hotels.
Significant disparities exist in consumption patterns and market size across the GCC countries, with Saudi Arabia and the UAE consistently demonstrating the highest levels of red meat consumption and the largest market share.
GCC Red Meat Market Product Innovations
The GCC red meat market showcases ongoing innovation, focusing on enhancing product quality, convenience, and safety. Innovations include the introduction of ready-to-cook meals featuring red meat, value-added processed products like marinated cuts and flavorful sausages, and improvements in packaging technologies extending shelf life and preserving freshness. Companies are also exploring sustainable farming practices and offering ethically sourced red meat options to cater to the evolving preferences of health-conscious consumers. Technological advancements such as improved refrigeration techniques and modified atmosphere packaging (MAP) play a significant role in maintaining the quality and extending the shelf life of red meat products.
Propelling Factors for GCC Red Meat Market Growth
Several factors fuel the expansion of the GCC red meat market. Rising disposable incomes and a growing middle class are boosting demand. Government support for the agricultural sector, along with investments in modern meat processing facilities and cold chain infrastructure, enhance supply and quality. Further, urbanization leads to increased demand from densely populated areas, while changing dietary habits, including increased protein consumption, create growth opportunities.
Obstacles in the GCC Red Meat Market
Challenges include the volatility of global red meat prices, potential supply chain disruptions due to geopolitical instability or disease outbreaks, and intense competition from other protein sources. Stringent food safety regulations can also raise compliance costs for businesses. Climate change effects on livestock production also pose a long-term threat.
Future Opportunities in GCC Red Meat Market
Future opportunities lie in leveraging technological advancements, such as precision livestock farming and innovative meat processing technologies, to enhance efficiency and sustainability. Developing value-added processed meat products catering to specific consumer preferences and health needs also offers significant growth potential. Expanding into new markets within the GCC region and exploring export possibilities to other countries will also create additional opportunities.
Major Players in the GCC Red Meat Market Ecosystem
- Almunajem Foods
- The Organic Meat Company Ltd
- BRF S.A.
- The Savola Group
- Kibsons International LLC
- JBS S.A.
- Tanmiah Food Company
- Golden Gate Meat Company
Key Developments in GCC Red Meat Market Industry
- December 2021: Tanmiah Food Company's subsidiary, Gulf Brand Fast Food Co., signed a master franchise agreement with Popeyes, expanding into the quick-service restaurant sector.
- July 2022: Tanmiah Food Company and Tyson Foods partnered to expand meat production capacity in the Middle East.
- February 2023: Tanmiah Food Company and Tyson Foods renewed their partnership, aiming to capitalize on growth opportunities in Saudi Arabia and the broader Middle East. These partnerships reflect the growing interest in strategic collaborations to enhance market share and production capacity within the GCC.
Strategic GCC Red Meat Market Forecast
The GCC red meat market is poised for continued growth, driven by a confluence of factors including rising incomes, population growth, and sustained government investment. While challenges exist, the market's strong fundamentals, coupled with ongoing innovation and strategic partnerships, suggest significant growth potential in the years to come. The focus on sustainability, product diversification, and technological advancements will further shape the future of the GCC red meat market.
GCC Red Meat Market Segmentation
-
1. Type
- 1.1. Beef
- 1.2. Mutton
- 1.3. Other Meat
-
2. Form
- 2.1. Canned
- 2.2. Fresh / Chilled
- 2.3. Frozen
- 2.4. Processed
-
3. Distribution Channel
-
3.1. Off-Trade
- 3.1.1. Convenience Stores
- 3.1.2. Online Channel
- 3.1.3. Supermarkets and Hypermarkets
- 3.1.4. Others
- 3.2. On-Trade
-
3.1. Off-Trade
GCC Red Meat Market Segmentation By Geography
-
1. North America
- 1.1. United States
- 1.2. Canada
- 1.3. Mexico
-
2. South America
- 2.1. Brazil
- 2.2. Argentina
- 2.3. Rest of South America
-
3. Europe
- 3.1. United Kingdom
- 3.2. Germany
- 3.3. France
- 3.4. Italy
- 3.5. Spain
- 3.6. Russia
- 3.7. Benelux
- 3.8. Nordics
- 3.9. Rest of Europe
-
4. Middle East & Africa
- 4.1. Turkey
- 4.2. Israel
- 4.3. GCC
- 4.4. North Africa
- 4.5. South Africa
- 4.6. Rest of Middle East & Africa
-
5. Asia Pacific
- 5.1. China
- 5.2. India
- 5.3. Japan
- 5.4. South Korea
- 5.5. ASEAN
- 5.6. Oceania
- 5.7. Rest of Asia Pacific

GCC Red Meat Market REPORT HIGHLIGHTS
| Aspects | Details |
|---|---|
| Study Period | 2019-2033 |
| Base Year | 2024 |
| Estimated Year | 2025 |
| Forecast Period | 2025-2033 |
| Historical Period | 2019-2024 |
| Growth Rate | CAGR of 7.02% from 2019-2033 |
| Segmentation |
|
Table of Contents
- 1. Introduction
- 1.1. Research Scope
- 1.2. Market Segmentation
- 1.3. Research Methodology
- 1.4. Definitions and Assumptions
- 2. Executive Summary
- 2.1. Introduction
- 3. Market Dynamics
- 3.1. Introduction
- 3.2. Market Drivers
- 3.2.1. Rising Demand for Clean Label Food & Beverage Products; Rising Demand for Dairy Products
- 3.3. Market Restrains
- 3.3.1. Presence of Preservatives in Ready Meals may Hamper the Market Growth
- 3.4. Market Trends
- 3.4.1. OTHER KEY INDUSTRY TRENDS COVERED IN THE REPORT
- 4. Market Factor Analysis
- 4.1. Porters Five Forces
- 4.2. Supply/Value Chain
- 4.3. PESTEL analysis
- 4.4. Market Entropy
- 4.5. Patent/Trademark Analysis
- 5. Global GCC Red Meat Market Analysis, Insights and Forecast, 2019-2031
- 5.1. Market Analysis, Insights and Forecast - by Type
- 5.1.1. Beef
- 5.1.2. Mutton
- 5.1.3. Other Meat
- 5.2. Market Analysis, Insights and Forecast - by Form
- 5.2.1. Canned
- 5.2.2. Fresh / Chilled
- 5.2.3. Frozen
- 5.2.4. Processed
- 5.3. Market Analysis, Insights and Forecast - by Distribution Channel
- 5.3.1. Off-Trade
- 5.3.1.1. Convenience Stores
- 5.3.1.2. Online Channel
- 5.3.1.3. Supermarkets and Hypermarkets
- 5.3.1.4. Others
- 5.3.2. On-Trade
- 5.3.1. Off-Trade
- 5.4. Market Analysis, Insights and Forecast - by Region
- 5.4.1. North America
- 5.4.2. South America
- 5.4.3. Europe
- 5.4.4. Middle East & Africa
- 5.4.5. Asia Pacific
- 5.1. Market Analysis, Insights and Forecast - by Type
- 6. North America GCC Red Meat Market Analysis, Insights and Forecast, 2019-2031
- 6.1. Market Analysis, Insights and Forecast - by Type
- 6.1.1. Beef
- 6.1.2. Mutton
- 6.1.3. Other Meat
- 6.2. Market Analysis, Insights and Forecast - by Form
- 6.2.1. Canned
- 6.2.2. Fresh / Chilled
- 6.2.3. Frozen
- 6.2.4. Processed
- 6.3. Market Analysis, Insights and Forecast - by Distribution Channel
- 6.3.1. Off-Trade
- 6.3.1.1. Convenience Stores
- 6.3.1.2. Online Channel
- 6.3.1.3. Supermarkets and Hypermarkets
- 6.3.1.4. Others
- 6.3.2. On-Trade
- 6.3.1. Off-Trade
- 6.1. Market Analysis, Insights and Forecast - by Type
- 7. South America GCC Red Meat Market Analysis, Insights and Forecast, 2019-2031
- 7.1. Market Analysis, Insights and Forecast - by Type
- 7.1.1. Beef
- 7.1.2. Mutton
- 7.1.3. Other Meat
- 7.2. Market Analysis, Insights and Forecast - by Form
- 7.2.1. Canned
- 7.2.2. Fresh / Chilled
- 7.2.3. Frozen
- 7.2.4. Processed
- 7.3. Market Analysis, Insights and Forecast - by Distribution Channel
- 7.3.1. Off-Trade
- 7.3.1.1. Convenience Stores
- 7.3.1.2. Online Channel
- 7.3.1.3. Supermarkets and Hypermarkets
- 7.3.1.4. Others
- 7.3.2. On-Trade
- 7.3.1. Off-Trade
- 7.1. Market Analysis, Insights and Forecast - by Type
- 8. Europe GCC Red Meat Market Analysis, Insights and Forecast, 2019-2031
- 8.1. Market Analysis, Insights and Forecast - by Type
- 8.1.1. Beef
- 8.1.2. Mutton
- 8.1.3. Other Meat
- 8.2. Market Analysis, Insights and Forecast - by Form
- 8.2.1. Canned
- 8.2.2. Fresh / Chilled
- 8.2.3. Frozen
- 8.2.4. Processed
- 8.3. Market Analysis, Insights and Forecast - by Distribution Channel
- 8.3.1. Off-Trade
- 8.3.1.1. Convenience Stores
- 8.3.1.2. Online Channel
- 8.3.1.3. Supermarkets and Hypermarkets
- 8.3.1.4. Others
- 8.3.2. On-Trade
- 8.3.1. Off-Trade
- 8.1. Market Analysis, Insights and Forecast - by Type
- 9. Middle East & Africa GCC Red Meat Market Analysis, Insights and Forecast, 2019-2031
- 9.1. Market Analysis, Insights and Forecast - by Type
- 9.1.1. Beef
- 9.1.2. Mutton
- 9.1.3. Other Meat
- 9.2. Market Analysis, Insights and Forecast - by Form
- 9.2.1. Canned
- 9.2.2. Fresh / Chilled
- 9.2.3. Frozen
- 9.2.4. Processed
- 9.3. Market Analysis, Insights and Forecast - by Distribution Channel
- 9.3.1. Off-Trade
- 9.3.1.1. Convenience Stores
- 9.3.1.2. Online Channel
- 9.3.1.3. Supermarkets and Hypermarkets
- 9.3.1.4. Others
- 9.3.2. On-Trade
- 9.3.1. Off-Trade
- 9.1. Market Analysis, Insights and Forecast - by Type
- 10. Asia Pacific GCC Red Meat Market Analysis, Insights and Forecast, 2019-2031
- 10.1. Market Analysis, Insights and Forecast - by Type
- 10.1.1. Beef
- 10.1.2. Mutton
- 10.1.3. Other Meat
- 10.2. Market Analysis, Insights and Forecast - by Form
- 10.2.1. Canned
- 10.2.2. Fresh / Chilled
- 10.2.3. Frozen
- 10.2.4. Processed
- 10.3. Market Analysis, Insights and Forecast - by Distribution Channel
- 10.3.1. Off-Trade
- 10.3.1.1. Convenience Stores
- 10.3.1.2. Online Channel
- 10.3.1.3. Supermarkets and Hypermarkets
- 10.3.1.4. Others
- 10.3.2. On-Trade
- 10.3.1. Off-Trade
- 10.1. Market Analysis, Insights and Forecast - by Type
- 11. UAE GCC Red Meat Market Analysis, Insights and Forecast, 2019-2031
- 12. South Africa GCC Red Meat Market Analysis, Insights and Forecast, 2019-2031
- 13. Saudi Arabia GCC Red Meat Market Analysis, Insights and Forecast, 2019-2031
- 14. Rest of MEA GCC Red Meat Market Analysis, Insights and Forecast, 2019-2031
- 15. Competitive Analysis
- 15.1. Global Market Share Analysis 2024
- 15.2. Company Profiles
- 15.2.1 Almunajem Foods
- 15.2.1.1. Overview
- 15.2.1.2. Products
- 15.2.1.3. SWOT Analysis
- 15.2.1.4. Recent Developments
- 15.2.1.5. Financials (Based on Availability)
- 15.2.2 The Organic Meat Company Ltd
- 15.2.2.1. Overview
- 15.2.2.2. Products
- 15.2.2.3. SWOT Analysis
- 15.2.2.4. Recent Developments
- 15.2.2.5. Financials (Based on Availability)
- 15.2.3 BRF S A
- 15.2.3.1. Overview
- 15.2.3.2. Products
- 15.2.3.3. SWOT Analysis
- 15.2.3.4. Recent Developments
- 15.2.3.5. Financials (Based on Availability)
- 15.2.4 The Savola Grou
- 15.2.4.1. Overview
- 15.2.4.2. Products
- 15.2.4.3. SWOT Analysis
- 15.2.4.4. Recent Developments
- 15.2.4.5. Financials (Based on Availability)
- 15.2.5 Kibsons International LLC
- 15.2.5.1. Overview
- 15.2.5.2. Products
- 15.2.5.3. SWOT Analysis
- 15.2.5.4. Recent Developments
- 15.2.5.5. Financials (Based on Availability)
- 15.2.6 JBS SA
- 15.2.6.1. Overview
- 15.2.6.2. Products
- 15.2.6.3. SWOT Analysis
- 15.2.6.4. Recent Developments
- 15.2.6.5. Financials (Based on Availability)
- 15.2.7 Tanmiah Food Company
- 15.2.7.1. Overview
- 15.2.7.2. Products
- 15.2.7.3. SWOT Analysis
- 15.2.7.4. Recent Developments
- 15.2.7.5. Financials (Based on Availability)
- 15.2.8 Golden Gate Meat Company
- 15.2.8.1. Overview
- 15.2.8.2. Products
- 15.2.8.3. SWOT Analysis
- 15.2.8.4. Recent Developments
- 15.2.8.5. Financials (Based on Availability)
- 15.2.1 Almunajem Foods
List of Figures
- Figure 1: Global GCC Red Meat Market Revenue Breakdown (Million, %) by Region 2024 & 2032
- Figure 2: Global GCC Red Meat Market Volume Breakdown (K Tons, %) by Region 2024 & 2032
- Figure 3: Middle East & Africa GCC Red Meat Market Revenue (Million), by Country 2024 & 2032
- Figure 4: Middle East & Africa GCC Red Meat Market Volume (K Tons), by Country 2024 & 2032
- Figure 5: Middle East & Africa GCC Red Meat Market Revenue Share (%), by Country 2024 & 2032
- Figure 6: Middle East & Africa GCC Red Meat Market Volume Share (%), by Country 2024 & 2032
- Figure 7: North America GCC Red Meat Market Revenue (Million), by Type 2024 & 2032
- Figure 8: North America GCC Red Meat Market Volume (K Tons), by Type 2024 & 2032
- Figure 9: North America GCC Red Meat Market Revenue Share (%), by Type 2024 & 2032
- Figure 10: North America GCC Red Meat Market Volume Share (%), by Type 2024 & 2032
- Figure 11: North America GCC Red Meat Market Revenue (Million), by Form 2024 & 2032
- Figure 12: North America GCC Red Meat Market Volume (K Tons), by Form 2024 & 2032
- Figure 13: North America GCC Red Meat Market Revenue Share (%), by Form 2024 & 2032
- Figure 14: North America GCC Red Meat Market Volume Share (%), by Form 2024 & 2032
- Figure 15: North America GCC Red Meat Market Revenue (Million), by Distribution Channel 2024 & 2032
- Figure 16: North America GCC Red Meat Market Volume (K Tons), by Distribution Channel 2024 & 2032
- Figure 17: North America GCC Red Meat Market Revenue Share (%), by Distribution Channel 2024 & 2032
- Figure 18: North America GCC Red Meat Market Volume Share (%), by Distribution Channel 2024 & 2032
- Figure 19: North America GCC Red Meat Market Revenue (Million), by Country 2024 & 2032
- Figure 20: North America GCC Red Meat Market Volume (K Tons), by Country 2024 & 2032
- Figure 21: North America GCC Red Meat Market Revenue Share (%), by Country 2024 & 2032
- Figure 22: North America GCC Red Meat Market Volume Share (%), by Country 2024 & 2032
- Figure 23: South America GCC Red Meat Market Revenue (Million), by Type 2024 & 2032
- Figure 24: South America GCC Red Meat Market Volume (K Tons), by Type 2024 & 2032
- Figure 25: South America GCC Red Meat Market Revenue Share (%), by Type 2024 & 2032
- Figure 26: South America GCC Red Meat Market Volume Share (%), by Type 2024 & 2032
- Figure 27: South America GCC Red Meat Market Revenue (Million), by Form 2024 & 2032
- Figure 28: South America GCC Red Meat Market Volume (K Tons), by Form 2024 & 2032
- Figure 29: South America GCC Red Meat Market Revenue Share (%), by Form 2024 & 2032
- Figure 30: South America GCC Red Meat Market Volume Share (%), by Form 2024 & 2032
- Figure 31: South America GCC Red Meat Market Revenue (Million), by Distribution Channel 2024 & 2032
- Figure 32: South America GCC Red Meat Market Volume (K Tons), by Distribution Channel 2024 & 2032
- Figure 33: South America GCC Red Meat Market Revenue Share (%), by Distribution Channel 2024 & 2032
- Figure 34: South America GCC Red Meat Market Volume Share (%), by Distribution Channel 2024 & 2032
- Figure 35: South America GCC Red Meat Market Revenue (Million), by Country 2024 & 2032
- Figure 36: South America GCC Red Meat Market Volume (K Tons), by Country 2024 & 2032
- Figure 37: South America GCC Red Meat Market Revenue Share (%), by Country 2024 & 2032
- Figure 38: South America GCC Red Meat Market Volume Share (%), by Country 2024 & 2032
- Figure 39: Europe GCC Red Meat Market Revenue (Million), by Type 2024 & 2032
- Figure 40: Europe GCC Red Meat Market Volume (K Tons), by Type 2024 & 2032
- Figure 41: Europe GCC Red Meat Market Revenue Share (%), by Type 2024 & 2032
- Figure 42: Europe GCC Red Meat Market Volume Share (%), by Type 2024 & 2032
- Figure 43: Europe GCC Red Meat Market Revenue (Million), by Form 2024 & 2032
- Figure 44: Europe GCC Red Meat Market Volume (K Tons), by Form 2024 & 2032
- Figure 45: Europe GCC Red Meat Market Revenue Share (%), by Form 2024 & 2032
- Figure 46: Europe GCC Red Meat Market Volume Share (%), by Form 2024 & 2032
- Figure 47: Europe GCC Red Meat Market Revenue (Million), by Distribution Channel 2024 & 2032
- Figure 48: Europe GCC Red Meat Market Volume (K Tons), by Distribution Channel 2024 & 2032
- Figure 49: Europe GCC Red Meat Market Revenue Share (%), by Distribution Channel 2024 & 2032
- Figure 50: Europe GCC Red Meat Market Volume Share (%), by Distribution Channel 2024 & 2032
- Figure 51: Europe GCC Red Meat Market Revenue (Million), by Country 2024 & 2032
- Figure 52: Europe GCC Red Meat Market Volume (K Tons), by Country 2024 & 2032
- Figure 53: Europe GCC Red Meat Market Revenue Share (%), by Country 2024 & 2032
- Figure 54: Europe GCC Red Meat Market Volume Share (%), by Country 2024 & 2032
- Figure 55: Middle East & Africa GCC Red Meat Market Revenue (Million), by Type 2024 & 2032
- Figure 56: Middle East & Africa GCC Red Meat Market Volume (K Tons), by Type 2024 & 2032
- Figure 57: Middle East & Africa GCC Red Meat Market Revenue Share (%), by Type 2024 & 2032
- Figure 58: Middle East & Africa GCC Red Meat Market Volume Share (%), by Type 2024 & 2032
- Figure 59: Middle East & Africa GCC Red Meat Market Revenue (Million), by Form 2024 & 2032
- Figure 60: Middle East & Africa GCC Red Meat Market Volume (K Tons), by Form 2024 & 2032
- Figure 61: Middle East & Africa GCC Red Meat Market Revenue Share (%), by Form 2024 & 2032
- Figure 62: Middle East & Africa GCC Red Meat Market Volume Share (%), by Form 2024 & 2032
- Figure 63: Middle East & Africa GCC Red Meat Market Revenue (Million), by Distribution Channel 2024 & 2032
- Figure 64: Middle East & Africa GCC Red Meat Market Volume (K Tons), by Distribution Channel 2024 & 2032
- Figure 65: Middle East & Africa GCC Red Meat Market Revenue Share (%), by Distribution Channel 2024 & 2032
- Figure 66: Middle East & Africa GCC Red Meat Market Volume Share (%), by Distribution Channel 2024 & 2032
- Figure 67: Middle East & Africa GCC Red Meat Market Revenue (Million), by Country 2024 & 2032
- Figure 68: Middle East & Africa GCC Red Meat Market Volume (K Tons), by Country 2024 & 2032
- Figure 69: Middle East & Africa GCC Red Meat Market Revenue Share (%), by Country 2024 & 2032
- Figure 70: Middle East & Africa GCC Red Meat Market Volume Share (%), by Country 2024 & 2032
- Figure 71: Asia Pacific GCC Red Meat Market Revenue (Million), by Type 2024 & 2032
- Figure 72: Asia Pacific GCC Red Meat Market Volume (K Tons), by Type 2024 & 2032
- Figure 73: Asia Pacific GCC Red Meat Market Revenue Share (%), by Type 2024 & 2032
- Figure 74: Asia Pacific GCC Red Meat Market Volume Share (%), by Type 2024 & 2032
- Figure 75: Asia Pacific GCC Red Meat Market Revenue (Million), by Form 2024 & 2032
- Figure 76: Asia Pacific GCC Red Meat Market Volume (K Tons), by Form 2024 & 2032
- Figure 77: Asia Pacific GCC Red Meat Market Revenue Share (%), by Form 2024 & 2032
- Figure 78: Asia Pacific GCC Red Meat Market Volume Share (%), by Form 2024 & 2032
- Figure 79: Asia Pacific GCC Red Meat Market Revenue (Million), by Distribution Channel 2024 & 2032
- Figure 80: Asia Pacific GCC Red Meat Market Volume (K Tons), by Distribution Channel 2024 & 2032
- Figure 81: Asia Pacific GCC Red Meat Market Revenue Share (%), by Distribution Channel 2024 & 2032
- Figure 82: Asia Pacific GCC Red Meat Market Volume Share (%), by Distribution Channel 2024 & 2032
- Figure 83: Asia Pacific GCC Red Meat Market Revenue (Million), by Country 2024 & 2032
- Figure 84: Asia Pacific GCC Red Meat Market Volume (K Tons), by Country 2024 & 2032
- Figure 85: Asia Pacific GCC Red Meat Market Revenue Share (%), by Country 2024 & 2032
- Figure 86: Asia Pacific GCC Red Meat Market Volume Share (%), by Country 2024 & 2032
List of Tables
- Table 1: Global GCC Red Meat Market Revenue Million Forecast, by Region 2019 & 2032
- Table 2: Global GCC Red Meat Market Volume K Tons Forecast, by Region 2019 & 2032
- Table 3: Global GCC Red Meat Market Revenue Million Forecast, by Type 2019 & 2032
- Table 4: Global GCC Red Meat Market Volume K Tons Forecast, by Type 2019 & 2032
- Table 5: Global GCC Red Meat Market Revenue Million Forecast, by Form 2019 & 2032
- Table 6: Global GCC Red Meat Market Volume K Tons Forecast, by Form 2019 & 2032
- Table 7: Global GCC Red Meat Market Revenue Million Forecast, by Distribution Channel 2019 & 2032
- Table 8: Global GCC Red Meat Market Volume K Tons Forecast, by Distribution Channel 2019 & 2032
- Table 9: Global GCC Red Meat Market Revenue Million Forecast, by Region 2019 & 2032
- Table 10: Global GCC Red Meat Market Volume K Tons Forecast, by Region 2019 & 2032
- Table 11: Global GCC Red Meat Market Revenue Million Forecast, by Country 2019 & 2032
- Table 12: Global GCC Red Meat Market Volume K Tons Forecast, by Country 2019 & 2032
- Table 13: UAE GCC Red Meat Market Revenue (Million) Forecast, by Application 2019 & 2032
- Table 14: UAE GCC Red Meat Market Volume (K Tons) Forecast, by Application 2019 & 2032
- Table 15: South Africa GCC Red Meat Market Revenue (Million) Forecast, by Application 2019 & 2032
- Table 16: South Africa GCC Red Meat Market Volume (K Tons) Forecast, by Application 2019 & 2032
- Table 17: Saudi Arabia GCC Red Meat Market Revenue (Million) Forecast, by Application 2019 & 2032
- Table 18: Saudi Arabia GCC Red Meat Market Volume (K Tons) Forecast, by Application 2019 & 2032
- Table 19: Rest of MEA GCC Red Meat Market Revenue (Million) Forecast, by Application 2019 & 2032
- Table 20: Rest of MEA GCC Red Meat Market Volume (K Tons) Forecast, by Application 2019 & 2032
- Table 21: Global GCC Red Meat Market Revenue Million Forecast, by Type 2019 & 2032
- Table 22: Global GCC Red Meat Market Volume K Tons Forecast, by Type 2019 & 2032
- Table 23: Global GCC Red Meat Market Revenue Million Forecast, by Form 2019 & 2032
- Table 24: Global GCC Red Meat Market Volume K Tons Forecast, by Form 2019 & 2032
- Table 25: Global GCC Red Meat Market Revenue Million Forecast, by Distribution Channel 2019 & 2032
- Table 26: Global GCC Red Meat Market Volume K Tons Forecast, by Distribution Channel 2019 & 2032
- Table 27: Global GCC Red Meat Market Revenue Million Forecast, by Country 2019 & 2032
- Table 28: Global GCC Red Meat Market Volume K Tons Forecast, by Country 2019 & 2032
- Table 29: United States GCC Red Meat Market Revenue (Million) Forecast, by Application 2019 & 2032
- Table 30: United States GCC Red Meat Market Volume (K Tons) Forecast, by Application 2019 & 2032
- Table 31: Canada GCC Red Meat Market Revenue (Million) Forecast, by Application 2019 & 2032
- Table 32: Canada GCC Red Meat Market Volume (K Tons) Forecast, by Application 2019 & 2032
- Table 33: Mexico GCC Red Meat Market Revenue (Million) Forecast, by Application 2019 & 2032
- Table 34: Mexico GCC Red Meat Market Volume (K Tons) Forecast, by Application 2019 & 2032
- Table 35: Global GCC Red Meat Market Revenue Million Forecast, by Type 2019 & 2032
- Table 36: Global GCC Red Meat Market Volume K Tons Forecast, by Type 2019 & 2032
- Table 37: Global GCC Red Meat Market Revenue Million Forecast, by Form 2019 & 2032
- Table 38: Global GCC Red Meat Market Volume K Tons Forecast, by Form 2019 & 2032
- Table 39: Global GCC Red Meat Market Revenue Million Forecast, by Distribution Channel 2019 & 2032
- Table 40: Global GCC Red Meat Market Volume K Tons Forecast, by Distribution Channel 2019 & 2032
- Table 41: Global GCC Red Meat Market Revenue Million Forecast, by Country 2019 & 2032
- Table 42: Global GCC Red Meat Market Volume K Tons Forecast, by Country 2019 & 2032
- Table 43: Brazil GCC Red Meat Market Revenue (Million) Forecast, by Application 2019 & 2032
- Table 44: Brazil GCC Red Meat Market Volume (K Tons) Forecast, by Application 2019 & 2032
- Table 45: Argentina GCC Red Meat Market Revenue (Million) Forecast, by Application 2019 & 2032
- Table 46: Argentina GCC Red Meat Market Volume (K Tons) Forecast, by Application 2019 & 2032
- Table 47: Rest of South America GCC Red Meat Market Revenue (Million) Forecast, by Application 2019 & 2032
- Table 48: Rest of South America GCC Red Meat Market Volume (K Tons) Forecast, by Application 2019 & 2032
- Table 49: Global GCC Red Meat Market Revenue Million Forecast, by Type 2019 & 2032
- Table 50: Global GCC Red Meat Market Volume K Tons Forecast, by Type 2019 & 2032
- Table 51: Global GCC Red Meat Market Revenue Million Forecast, by Form 2019 & 2032
- Table 52: Global GCC Red Meat Market Volume K Tons Forecast, by Form 2019 & 2032
- Table 53: Global GCC Red Meat Market Revenue Million Forecast, by Distribution Channel 2019 & 2032
- Table 54: Global GCC Red Meat Market Volume K Tons Forecast, by Distribution Channel 2019 & 2032
- Table 55: Global GCC Red Meat Market Revenue Million Forecast, by Country 2019 & 2032
- Table 56: Global GCC Red Meat Market Volume K Tons Forecast, by Country 2019 & 2032
- Table 57: United Kingdom GCC Red Meat Market Revenue (Million) Forecast, by Application 2019 & 2032
- Table 58: United Kingdom GCC Red Meat Market Volume (K Tons) Forecast, by Application 2019 & 2032
- Table 59: Germany GCC Red Meat Market Revenue (Million) Forecast, by Application 2019 & 2032
- Table 60: Germany GCC Red Meat Market Volume (K Tons) Forecast, by Application 2019 & 2032
- Table 61: France GCC Red Meat Market Revenue (Million) Forecast, by Application 2019 & 2032
- Table 62: France GCC Red Meat Market Volume (K Tons) Forecast, by Application 2019 & 2032
- Table 63: Italy GCC Red Meat Market Revenue (Million) Forecast, by Application 2019 & 2032
- Table 64: Italy GCC Red Meat Market Volume (K Tons) Forecast, by Application 2019 & 2032
- Table 65: Spain GCC Red Meat Market Revenue (Million) Forecast, by Application 2019 & 2032
- Table 66: Spain GCC Red Meat Market Volume (K Tons) Forecast, by Application 2019 & 2032
- Table 67: Russia GCC Red Meat Market Revenue (Million) Forecast, by Application 2019 & 2032
- Table 68: Russia GCC Red Meat Market Volume (K Tons) Forecast, by Application 2019 & 2032
- Table 69: Benelux GCC Red Meat Market Revenue (Million) Forecast, by Application 2019 & 2032
- Table 70: Benelux GCC Red Meat Market Volume (K Tons) Forecast, by Application 2019 & 2032
- Table 71: Nordics GCC Red Meat Market Revenue (Million) Forecast, by Application 2019 & 2032
- Table 72: Nordics GCC Red Meat Market Volume (K Tons) Forecast, by Application 2019 & 2032
- Table 73: Rest of Europe GCC Red Meat Market Revenue (Million) Forecast, by Application 2019 & 2032
- Table 74: Rest of Europe GCC Red Meat Market Volume (K Tons) Forecast, by Application 2019 & 2032
- Table 75: Global GCC Red Meat Market Revenue Million Forecast, by Type 2019 & 2032
- Table 76: Global GCC Red Meat Market Volume K Tons Forecast, by Type 2019 & 2032
- Table 77: Global GCC Red Meat Market Revenue Million Forecast, by Form 2019 & 2032
- Table 78: Global GCC Red Meat Market Volume K Tons Forecast, by Form 2019 & 2032
- Table 79: Global GCC Red Meat Market Revenue Million Forecast, by Distribution Channel 2019 & 2032
- Table 80: Global GCC Red Meat Market Volume K Tons Forecast, by Distribution Channel 2019 & 2032
- Table 81: Global GCC Red Meat Market Revenue Million Forecast, by Country 2019 & 2032
- Table 82: Global GCC Red Meat Market Volume K Tons Forecast, by Country 2019 & 2032
- Table 83: Turkey GCC Red Meat Market Revenue (Million) Forecast, by Application 2019 & 2032
- Table 84: Turkey GCC Red Meat Market Volume (K Tons) Forecast, by Application 2019 & 2032
- Table 85: Israel GCC Red Meat Market Revenue (Million) Forecast, by Application 2019 & 2032
- Table 86: Israel GCC Red Meat Market Volume (K Tons) Forecast, by Application 2019 & 2032
- Table 87: GCC GCC Red Meat Market Revenue (Million) Forecast, by Application 2019 & 2032
- Table 88: GCC GCC Red Meat Market Volume (K Tons) Forecast, by Application 2019 & 2032
- Table 89: North Africa GCC Red Meat Market Revenue (Million) Forecast, by Application 2019 & 2032
- Table 90: North Africa GCC Red Meat Market Volume (K Tons) Forecast, by Application 2019 & 2032
- Table 91: South Africa GCC Red Meat Market Revenue (Million) Forecast, by Application 2019 & 2032
- Table 92: South Africa GCC Red Meat Market Volume (K Tons) Forecast, by Application 2019 & 2032
- Table 93: Rest of Middle East & Africa GCC Red Meat Market Revenue (Million) Forecast, by Application 2019 & 2032
- Table 94: Rest of Middle East & Africa GCC Red Meat Market Volume (K Tons) Forecast, by Application 2019 & 2032
- Table 95: Global GCC Red Meat Market Revenue Million Forecast, by Type 2019 & 2032
- Table 96: Global GCC Red Meat Market Volume K Tons Forecast, by Type 2019 & 2032
- Table 97: Global GCC Red Meat Market Revenue Million Forecast, by Form 2019 & 2032
- Table 98: Global GCC Red Meat Market Volume K Tons Forecast, by Form 2019 & 2032
- Table 99: Global GCC Red Meat Market Revenue Million Forecast, by Distribution Channel 2019 & 2032
- Table 100: Global GCC Red Meat Market Volume K Tons Forecast, by Distribution Channel 2019 & 2032
- Table 101: Global GCC Red Meat Market Revenue Million Forecast, by Country 2019 & 2032
- Table 102: Global GCC Red Meat Market Volume K Tons Forecast, by Country 2019 & 2032
- Table 103: China GCC Red Meat Market Revenue (Million) Forecast, by Application 2019 & 2032
- Table 104: China GCC Red Meat Market Volume (K Tons) Forecast, by Application 2019 & 2032
- Table 105: India GCC Red Meat Market Revenue (Million) Forecast, by Application 2019 & 2032
- Table 106: India GCC Red Meat Market Volume (K Tons) Forecast, by Application 2019 & 2032
- Table 107: Japan GCC Red Meat Market Revenue (Million) Forecast, by Application 2019 & 2032
- Table 108: Japan GCC Red Meat Market Volume (K Tons) Forecast, by Application 2019 & 2032
- Table 109: South Korea GCC Red Meat Market Revenue (Million) Forecast, by Application 2019 & 2032
- Table 110: South Korea GCC Red Meat Market Volume (K Tons) Forecast, by Application 2019 & 2032
- Table 111: ASEAN GCC Red Meat Market Revenue (Million) Forecast, by Application 2019 & 2032
- Table 112: ASEAN GCC Red Meat Market Volume (K Tons) Forecast, by Application 2019 & 2032
- Table 113: Oceania GCC Red Meat Market Revenue (Million) Forecast, by Application 2019 & 2032
- Table 114: Oceania GCC Red Meat Market Volume (K Tons) Forecast, by Application 2019 & 2032
- Table 115: Rest of Asia Pacific GCC Red Meat Market Revenue (Million) Forecast, by Application 2019 & 2032
- Table 116: Rest of Asia Pacific GCC Red Meat Market Volume (K Tons) Forecast, by Application 2019 & 2032
Frequently Asked Questions
1. What is the projected Compound Annual Growth Rate (CAGR) of the GCC Red Meat Market?
The projected CAGR is approximately 7.02%.
2. Which companies are prominent players in the GCC Red Meat Market?
Key companies in the market include Almunajem Foods, The Organic Meat Company Ltd, BRF S A, The Savola Grou, Kibsons International LLC, JBS SA, Tanmiah Food Company, Golden Gate Meat Company.
3. What are the main segments of the GCC Red Meat Market?
The market segments include Type, Form, Distribution Channel.
4. Can you provide details about the market size?
The market size is estimated to be USD 3.93 Million as of 2022.
5. What are some drivers contributing to market growth?
Rising Demand for Clean Label Food & Beverage Products; Rising Demand for Dairy Products.
6. What are the notable trends driving market growth?
OTHER KEY INDUSTRY TRENDS COVERED IN THE REPORT.
7. Are there any restraints impacting market growth?
Presence of Preservatives in Ready Meals may Hamper the Market Growth.
8. Can you provide examples of recent developments in the market?
February 2023: Saudi-based Tanmiah Food Company and US-based Tyson Foods Inc. renewed their partnership signed previously in 2022. The partnership was signed in order to recognize the potential growth opportunities across Saudi Arabia and the broader Middle East.July 2022: Tanmiah Food Company and Tyson Foods entered a strategic partnership to expand meat production capacity. The investment is expected to enable Tanmiah Food Company to access the high demand for protein in the Middle East and other international markets.December 2021: Tanmiah Food Company’s wholly owned subsidiary Gulf Brand Fast Food Co. signed a master franchise and development agreement with Popeyes, an international quick service restaurant chain, to diversify across the value chain by offering high-quality food options, including Popeyes Chicken Sandwich made from fresh and locally sourced fresh chicken.
9. What pricing options are available for accessing the report?
Pricing options include single-user, multi-user, and enterprise licenses priced at USD 3800, USD 4500, and USD 5800 respectively.
10. Is the market size provided in terms of value or volume?
The market size is provided in terms of value, measured in Million and volume, measured in K Tons.
11. Are there any specific market keywords associated with the report?
Yes, the market keyword associated with the report is "GCC Red Meat Market," which aids in identifying and referencing the specific market segment covered.
12. How do I determine which pricing option suits my needs best?
The pricing options vary based on user requirements and access needs. Individual users may opt for single-user licenses, while businesses requiring broader access may choose multi-user or enterprise licenses for cost-effective access to the report.
13. Are there any additional resources or data provided in the GCC Red Meat Market report?
While the report offers comprehensive insights, it's advisable to review the specific contents or supplementary materials provided to ascertain if additional resources or data are available.
14. How can I stay updated on further developments or reports in the GCC Red Meat Market?
To stay informed about further developments, trends, and reports in the GCC Red Meat Market, consider subscribing to industry newsletters, following relevant companies and organizations, or regularly checking reputable industry news sources and publications.
Methodology
Step 1 - Identification of Relevant Samples Size from Population Database


Step 2 - Approaches for Defining Global Market Size (Value, Volume* & Price*)

Note*: In applicable scenarios
Step 3 - Data Sources
Primary Research
- Web Analytics
- Survey Reports
- Research Institute
- Latest Research Reports
- Opinion Leaders
Secondary Research
- Annual Reports
- White Paper
- Latest Press Release
- Industry Association
- Paid Database
- Investor Presentations

Step 4 - Data Triangulation
Involves using different sources of information in order to increase the validity of a study
These sources are likely to be stakeholders in a program - participants, other researchers, program staff, other community members, and so on.
Then we put all data in single framework & apply various statistical tools to find out the dynamic on the market.
During the analysis stage, feedback from the stakeholder groups would be compared to determine areas of agreement as well as areas of divergence
