

Key Insights
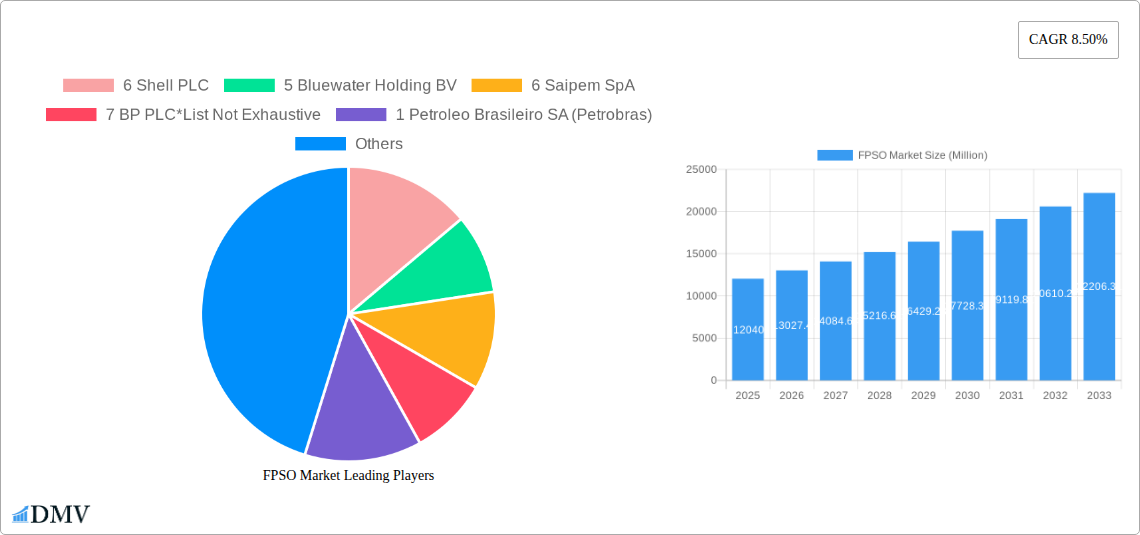
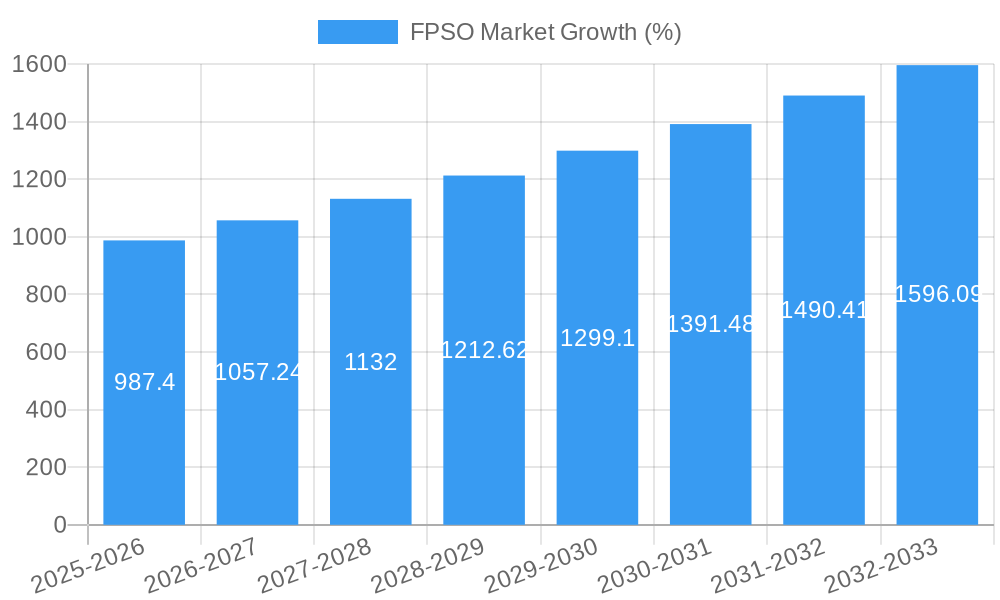
The Floating Production Storage and Offloading (FPSO) market is experiencing robust growth, projected to reach $12.04 billion in 2025 and maintain a Compound Annual Growth Rate (CAGR) of 8.50% from 2025 to 2033. This expansion is driven by several key factors. Firstly, the increasing demand for offshore oil and gas resources, particularly in deepwater and ultra-deepwater environments where FPSOs offer a cost-effective solution, is a significant driver. Secondly, technological advancements in FPSO design and construction, leading to enhanced efficiency and capacity, are fueling market growth. This includes improvements in subsea processing technologies and the integration of renewable energy sources for reduced operational costs and environmental impact. Finally, government initiatives promoting offshore energy exploration and production in various regions, alongside the strategic expansion of existing offshore fields, further contribute to this positive market outlook. The market is segmented by water depth (shallow, deep, ultra-deep) and ownership (operator-owned, contractor-owned), reflecting diverse operational models and investment strategies within the industry.
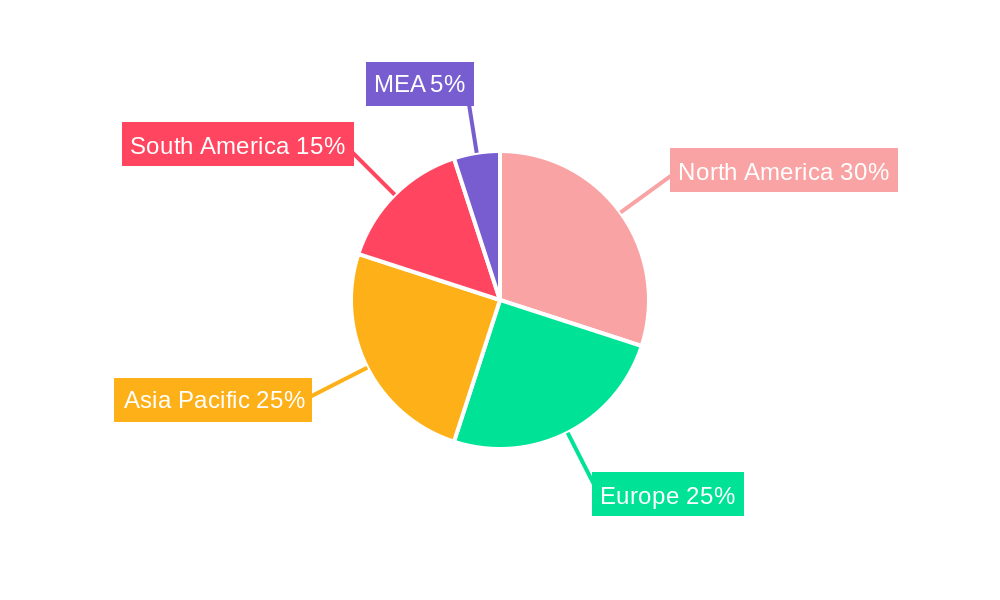
The geographical distribution of the FPSO market is broad, with significant activity across North America, Europe, Asia-Pacific, and South America. Regions like Brazil and the Gulf of Mexico, known for their significant offshore oil and gas reserves, represent key markets. However, growth is also expected in emerging regions with untapped offshore resources, particularly in Asia-Pacific and Africa. While challenges remain, such as fluctuating oil prices and the increasing focus on renewable energy transitions, the long-term outlook for the FPSO market remains positive due to the continued reliance on offshore oil and gas production and the ongoing development of new technologies to address environmental concerns and operational efficiency. The major players in the market, including Shell PLC, Bluewater Holding BV, Saipem SpA, and others, are actively investing in new projects and technological advancements to maintain their market share and capitalize on emerging opportunities.
FPSO Market Report: A Comprehensive Analysis (2019-2033)
This insightful report provides a comprehensive analysis of the FPSO (Floating Production, Storage, and Offloading) market, offering a detailed overview of market trends, key players, technological advancements, and future growth prospects. The study covers the period from 2019 to 2033, with 2025 as the base and estimated year. This report is crucial for stakeholders seeking to understand the dynamics of this rapidly evolving industry and make informed strategic decisions. The global FPSO market is projected to reach xx Million by 2033, exhibiting a substantial Compound Annual Growth Rate (CAGR) of xx% during the forecast period (2025-2033).
FPSO Market Composition & Trends
The FPSO market is characterized by a moderately concentrated landscape with key players exhibiting varying market shares. Major companies like Shell PLC, BP PLC, Chevron Corporation, TotalEnergies SE, ExxonMobil Corp, SBM Offshore NV, and Modec Inc. dominate the market. However, the presence of numerous smaller players contributes to a dynamic and competitive environment.
Market share distribution is influenced by factors such as technological capabilities, operational expertise, and strategic partnerships. M&A activity plays a significant role in shaping market dynamics. For example, in recent years, we have seen several substantial M&A deals with a total value exceeding xx Million.
- Market Concentration: Moderately concentrated, with a few dominant players and numerous smaller companies.
- Innovation Catalysts: Technological advancements in subsea technology, automation, and digitalization.
- Regulatory Landscape: Stringent environmental regulations and safety standards impacting operations and investments.
- Substitute Products: Limited direct substitutes, but alternative oil and gas extraction methods pose indirect competition.
- End-User Profiles: Primarily upstream oil and gas companies and national oil companies.
- M&A Activities: Significant M&A activity observed in recent years, with total deal values exceeding xx Million.
FPSO Market Industry Evolution
The FPSO market has experienced significant growth over the historical period (2019-2024), driven by increasing offshore oil and gas exploration and production activities in deepwater and ultra-deepwater regions. Technological advancements have enabled the development of larger and more sophisticated FPSOs capable of handling complex projects. The market has also seen a shift towards operator-owned FPSOs, reflecting the growing preference for greater control over operations. The average annual growth rate during this period was approximately xx%. The forecast period (2025-2033) anticipates continued expansion fueled by technological innovations, exploration in new frontiers, and investment in renewable energy projects, although potentially subject to fluctuating oil prices and geopolitical instability. The increasing focus on carbon emissions reduction will also influence design considerations for new FPSO projects.
Leading Regions, Countries, or Segments in FPSO Market
The deepwater segment currently dominates the FPSO market, driven by significant exploration and production activities in deepwater regions worldwide, particularly in South America, Africa, and Asia. Operator-owned FPSOs are also prevalent as companies seek greater control over operations.
- Key Drivers (Deepwater Segment):
- Substantial investments in deepwater exploration and production projects.
- Technological advancements enabling efficient operations in challenging environments.
- Government support and favorable regulatory frameworks in key regions.
- Dominance Factors (Deepwater Segment): High demand for deepwater oil and gas resources, coupled with technological developments that allow for economically viable production at great depths.
- Key Drivers (Operator-Owned Segment): Greater control over operations and asset optimization, leading to improved efficiency and profitability.
FPSO Market Product Innovations
Recent innovations in FPSO technology include improved hull designs for enhanced stability and efficiency in harsh weather conditions, advanced automation systems for optimizing production and reducing operational costs, and integrated digital platforms for real-time monitoring and data analysis. These innovations enable greater efficiency, safety, and environmental sustainability in FPSO operations. The development of integrated solutions combining multiple functionalities within a single platform is also a significant trend.
Propelling Factors for FPSO Market Growth
Several factors contribute to the growth of the FPSO market. Technological advancements leading to more efficient and cost-effective FPSO designs are key. The exploration and exploitation of oil and gas reserves in increasingly challenging deepwater and ultra-deepwater environments drive demand for these specialized vessels. Government policies and initiatives promoting energy independence and supporting offshore oil and gas exploration also fuel market expansion. Furthermore, rising global energy demand continues to bolster the market.
Obstacles in the FPSO Market
The FPSO market faces various challenges. High capital expenditure required for FPSO construction and installation, coupled with long lead times, represents a significant barrier. Fluctuations in oil and gas prices can also impact investment decisions and project viability. Stringent environmental regulations and safety standards necessitate significant upfront investment in compliance measures. Supply chain disruptions and skilled labor shortages also pose ongoing operational challenges.
Future Opportunities in FPSO Market
Emerging opportunities exist in new geographic regions with untapped oil and gas reserves, particularly in less-explored deepwater areas. Technological advancements in areas such as subsea processing and renewable energy integration offer significant potential for growth. The increasing adoption of digital technologies and automation can further enhance efficiency and reduce operating costs. The potential shift toward carbon-neutral operations presents opportunities for environmentally friendly FPSO designs.
Major Players in the FPSO Market Ecosystem
- Shell PLC
- Bluewater Holding BV
- Saipem SpA
- BP PLC
- Petroleo Brasileiro SA (Petrobras)
- Teekay Offshore Partners LP
- Chevron Corporation
- TotalEnergies SE
- Petrofac Limited
- ExxonMobil Corp
- Modec Inc
- BW Offshore Limited
- SBM Offshore NV
- CNOOC Ltd
Key Developments in FPSO Market Industry
- May 2023: SBM Offshore and Esso Exploration & Production Guyana signed a 10-year Operations and Maintenance Enabling Agreement for four FPSOs (Liza Destiny, Liza Unity, Prosperity, and ONE GUYANA). This significantly strengthens SBM Offshore's position in the Guyana market.
- April 2023: Shell resumed operations at the Pierce field after upgrading the Haewene Brim FPSO to enable gas production. This demonstrates the adaptability and longevity of FPSO assets.
- April 2023: KBR secured a USD 9.4 Billion engineering contract for Equinor's Bay du Nord FPSO project in Canada. This highlights the substantial investment in new FPSO projects.
Strategic FPSO Market Forecast
The FPSO market is poised for continued growth, driven by ongoing demand for offshore oil and gas, technological innovation, and exploration in new and challenging environments. New projects, particularly in deepwater and ultra-deepwater regions, will drive substantial market expansion. The growing emphasis on environmental sustainability will also influence the design and operation of future FPSO facilities, presenting opportunities for companies specializing in environmentally friendly technologies.
FPSO Market Segmentation
-
1. Ownership
- 1.1. Operator-owned
- 1.2. Contractor-owned
-
2. Water Depth
- 2.1. Shallow Water
- 2.2. Deep Water
- 2.3. Ultra-deep Water
FPSO Market Segmentation By Geography
-
1. North America
- 1.1. United States
- 1.2. Canada
- 1.3. Mexico
- 1.4. Rest of North America
-
2. Europe
- 2.1. Norway
- 2.2. United Kingdom
- 2.3. Russia
- 2.4. Netherland
- 2.5. France
- 2.6. Italy
- 2.7. NORDIC
- 2.8. Germany
- 2.9. Spain
- 2.10. Rest of Europe
-
3. Asia Pacific
- 3.1. China
- 3.2. India
- 3.3. Australia
- 3.4. Indonesia
- 3.5. Malaysia
- 3.6. Thailand
- 3.7. Japan
- 3.8. Vietnam
- 3.9. Rest of Asia Pacific
-
4. South America
- 4.1. Brazil
- 4.2. Argentina
- 4.3. Venezuela
- 4.4. Colombia
- 4.5. Rest of South America
-
5. Middle East and Africa
- 5.1. Saudi Arabia
- 5.2. United Arab Emirates
- 5.3. Nigeria
- 5.4. Algeria
- 5.5. Qatar
- 5.6. South Africa
- 5.7. Egypt
- 5.8. Rest of Middle East and Africa
FPSO Market REPORT HIGHLIGHTS
| Aspects | Details |
|---|---|
| Study Period | 2019-2033 |
| Base Year | 2024 |
| Estimated Year | 2025 |
| Forecast Period | 2025-2033 |
| Historical Period | 2019-2024 |
| Growth Rate | CAGR of 8.50% from 2019-2033 |
| Segmentation |
|
Table of Contents
- 1. Introduction
- 1.1. Research Scope
- 1.2. Market Segmentation
- 1.3. Research Methodology
- 1.4. Definitions and Assumptions
- 2. Executive Summary
- 2.1. Introduction
- 3. Market Dynamics
- 3.1. Introduction
- 3.2. Market Drivers
- 3.2.1. 4.; Increasing Offshore Oil and Gas Exploration and Production Activities4.; Growing Demand for Energy
- 3.3. Market Restrains
- 3.3.1. 4.; High Upfront Costs
- 3.4. Market Trends
- 3.4.1. Contractor-owned FPSO Expected to Dominate the Market
- 4. Market Factor Analysis
- 4.1. Porters Five Forces
- 4.2. Supply/Value Chain
- 4.3. PESTEL analysis
- 4.4. Market Entropy
- 4.5. Patent/Trademark Analysis
- 5. Global FPSO Market Analysis, Insights and Forecast, 2019-2031
- 5.1. Market Analysis, Insights and Forecast - by Ownership
- 5.1.1. Operator-owned
- 5.1.2. Contractor-owned
- 5.2. Market Analysis, Insights and Forecast - by Water Depth
- 5.2.1. Shallow Water
- 5.2.2. Deep Water
- 5.2.3. Ultra-deep Water
- 5.3. Market Analysis, Insights and Forecast - by Region
- 5.3.1. North America
- 5.3.2. Europe
- 5.3.3. Asia Pacific
- 5.3.4. South America
- 5.3.5. Middle East and Africa
- 5.1. Market Analysis, Insights and Forecast - by Ownership
- 6. North America FPSO Market Analysis, Insights and Forecast, 2019-2031
- 6.1. Market Analysis, Insights and Forecast - by Ownership
- 6.1.1. Operator-owned
- 6.1.2. Contractor-owned
- 6.2. Market Analysis, Insights and Forecast - by Water Depth
- 6.2.1. Shallow Water
- 6.2.2. Deep Water
- 6.2.3. Ultra-deep Water
- 6.1. Market Analysis, Insights and Forecast - by Ownership
- 7. Europe FPSO Market Analysis, Insights and Forecast, 2019-2031
- 7.1. Market Analysis, Insights and Forecast - by Ownership
- 7.1.1. Operator-owned
- 7.1.2. Contractor-owned
- 7.2. Market Analysis, Insights and Forecast - by Water Depth
- 7.2.1. Shallow Water
- 7.2.2. Deep Water
- 7.2.3. Ultra-deep Water
- 7.1. Market Analysis, Insights and Forecast - by Ownership
- 8. Asia Pacific FPSO Market Analysis, Insights and Forecast, 2019-2031
- 8.1. Market Analysis, Insights and Forecast - by Ownership
- 8.1.1. Operator-owned
- 8.1.2. Contractor-owned
- 8.2. Market Analysis, Insights and Forecast - by Water Depth
- 8.2.1. Shallow Water
- 8.2.2. Deep Water
- 8.2.3. Ultra-deep Water
- 8.1. Market Analysis, Insights and Forecast - by Ownership
- 9. South America FPSO Market Analysis, Insights and Forecast, 2019-2031
- 9.1. Market Analysis, Insights and Forecast - by Ownership
- 9.1.1. Operator-owned
- 9.1.2. Contractor-owned
- 9.2. Market Analysis, Insights and Forecast - by Water Depth
- 9.2.1. Shallow Water
- 9.2.2. Deep Water
- 9.2.3. Ultra-deep Water
- 9.1. Market Analysis, Insights and Forecast - by Ownership
- 10. Middle East and Africa FPSO Market Analysis, Insights and Forecast, 2019-2031
- 10.1. Market Analysis, Insights and Forecast - by Ownership
- 10.1.1. Operator-owned
- 10.1.2. Contractor-owned
- 10.2. Market Analysis, Insights and Forecast - by Water Depth
- 10.2.1. Shallow Water
- 10.2.2. Deep Water
- 10.2.3. Ultra-deep Water
- 10.1. Market Analysis, Insights and Forecast - by Ownership
- 11. North America FPSO Market Analysis, Insights and Forecast, 2019-2031
- 11.1. Market Analysis, Insights and Forecast - By Country/Sub-region
- 11.1.1 United States
- 11.1.2 Canada
- 11.1.3 Mexico
- 12. Europe FPSO Market Analysis, Insights and Forecast, 2019-2031
- 12.1. Market Analysis, Insights and Forecast - By Country/Sub-region
- 12.1.1 Germany
- 12.1.2 United Kingdom
- 12.1.3 France
- 12.1.4 Spain
- 12.1.5 Italy
- 12.1.6 Spain
- 12.1.7 Belgium
- 12.1.8 Netherland
- 12.1.9 Nordics
- 12.1.10 Rest of Europe
- 13. Asia Pacific FPSO Market Analysis, Insights and Forecast, 2019-2031
- 13.1. Market Analysis, Insights and Forecast - By Country/Sub-region
- 13.1.1 China
- 13.1.2 Japan
- 13.1.3 India
- 13.1.4 South Korea
- 13.1.5 Southeast Asia
- 13.1.6 Australia
- 13.1.7 Indonesia
- 13.1.8 Phillipes
- 13.1.9 Singapore
- 13.1.10 Thailandc
- 13.1.11 Rest of Asia Pacific
- 14. South America FPSO Market Analysis, Insights and Forecast, 2019-2031
- 14.1. Market Analysis, Insights and Forecast - By Country/Sub-region
- 14.1.1 Brazil
- 14.1.2 Argentina
- 14.1.3 Peru
- 14.1.4 Chile
- 14.1.5 Colombia
- 14.1.6 Ecuador
- 14.1.7 Venezuela
- 14.1.8 Rest of South America
- 15. North America FPSO Market Analysis, Insights and Forecast, 2019-2031
- 15.1. Market Analysis, Insights and Forecast - By Country/Sub-region
- 15.1.1 United States
- 15.1.2 Canada
- 15.1.3 Mexico
- 16. MEA FPSO Market Analysis, Insights and Forecast, 2019-2031
- 16.1. Market Analysis, Insights and Forecast - By Country/Sub-region
- 16.1.1 United Arab Emirates
- 16.1.2 Saudi Arabia
- 16.1.3 South Africa
- 16.1.4 Rest of Middle East and Africa
- 17. Competitive Analysis
- 17.1. Global Market Share Analysis 2024
- 17.2. Company Profiles
- 17.2.1 6 Shell PLC
- 17.2.1.1. Overview
- 17.2.1.2. Products
- 17.2.1.3. SWOT Analysis
- 17.2.1.4. Recent Developments
- 17.2.1.5. Financials (Based on Availability)
- 17.2.2 5 Bluewater Holding BV
- 17.2.2.1. Overview
- 17.2.2.2. Products
- 17.2.2.3. SWOT Analysis
- 17.2.2.4. Recent Developments
- 17.2.2.5. Financials (Based on Availability)
- 17.2.3 6 Saipem SpA
- 17.2.3.1. Overview
- 17.2.3.2. Products
- 17.2.3.3. SWOT Analysis
- 17.2.3.4. Recent Developments
- 17.2.3.5. Financials (Based on Availability)
- 17.2.4 7 BP PLC*List Not Exhaustive
- 17.2.4.1. Overview
- 17.2.4.2. Products
- 17.2.4.3. SWOT Analysis
- 17.2.4.4. Recent Developments
- 17.2.4.5. Financials (Based on Availability)
- 17.2.5 1 Petroleo Brasileiro SA (Petrobras)
- 17.2.5.1. Overview
- 17.2.5.2. Products
- 17.2.5.3. SWOT Analysis
- 17.2.5.4. Recent Developments
- 17.2.5.5. Financials (Based on Availability)
- 17.2.6 4 Teekay Offshore Partners LP
- 17.2.6.1. Overview
- 17.2.6.2. Products
- 17.2.6.3. SWOT Analysis
- 17.2.6.4. Recent Developments
- 17.2.6.5. Financials (Based on Availability)
- 17.2.7 5 Chevron Corporation
- 17.2.7.1. Overview
- 17.2.7.2. Products
- 17.2.7.3. SWOT Analysis
- 17.2.7.4. Recent Developments
- 17.2.7.5. Financials (Based on Availability)
- 17.2.8 3 TotalEnergies SE
- 17.2.8.1. Overview
- 17.2.8.2. Products
- 17.2.8.3. SWOT Analysis
- 17.2.8.4. Recent Developments
- 17.2.8.5. Financials (Based on Availability)
- 17.2.9 7 Petrofac Limited
- 17.2.9.1. Overview
- 17.2.9.2. Products
- 17.2.9.3. SWOT Analysis
- 17.2.9.4. Recent Developments
- 17.2.9.5. Financials (Based on Availability)
- 17.2.10 4 ExxonMobil Corp
- 17.2.10.1. Overview
- 17.2.10.2. Products
- 17.2.10.3. SWOT Analysis
- 17.2.10.4. Recent Developments
- 17.2.10.5. Financials (Based on Availability)
- 17.2.11 1 Modec Inc
- 17.2.11.1. Overview
- 17.2.11.2. Products
- 17.2.11.3. SWOT Analysis
- 17.2.11.4. Recent Developments
- 17.2.11.5. Financials (Based on Availability)
- 17.2.12 3 BW Offshore Limited
- 17.2.12.1. Overview
- 17.2.12.2. Products
- 17.2.12.3. SWOT Analysis
- 17.2.12.4. Recent Developments
- 17.2.12.5. Financials (Based on Availability)
- 17.2.13 FPSO Operators
- 17.2.13.1. Overview
- 17.2.13.2. Products
- 17.2.13.3. SWOT Analysis
- 17.2.13.4. Recent Developments
- 17.2.13.5. Financials (Based on Availability)
- 17.2.14 2 SBM Offshore NV
- 17.2.14.1. Overview
- 17.2.14.2. Products
- 17.2.14.3. SWOT Analysis
- 17.2.14.4. Recent Developments
- 17.2.14.5. Financials (Based on Availability)
- 17.2.15 2 CNOOC Ltd
- 17.2.15.1. Overview
- 17.2.15.2. Products
- 17.2.15.3. SWOT Analysis
- 17.2.15.4. Recent Developments
- 17.2.15.5. Financials (Based on Availability)
- 17.2.16 FPSO Contractors
- 17.2.16.1. Overview
- 17.2.16.2. Products
- 17.2.16.3. SWOT Analysis
- 17.2.16.4. Recent Developments
- 17.2.16.5. Financials (Based on Availability)
- 17.2.1 6 Shell PLC
List of Figures
- Figure 1: Global FPSO Market Revenue Breakdown (Million, %) by Region 2024 & 2032
- Figure 2: North America FPSO Market Revenue (Million), by Country 2024 & 2032
- Figure 3: North America FPSO Market Revenue Share (%), by Country 2024 & 2032
- Figure 4: Europe FPSO Market Revenue (Million), by Country 2024 & 2032
- Figure 5: Europe FPSO Market Revenue Share (%), by Country 2024 & 2032
- Figure 6: Asia Pacific FPSO Market Revenue (Million), by Country 2024 & 2032
- Figure 7: Asia Pacific FPSO Market Revenue Share (%), by Country 2024 & 2032
- Figure 8: South America FPSO Market Revenue (Million), by Country 2024 & 2032
- Figure 9: South America FPSO Market Revenue Share (%), by Country 2024 & 2032
- Figure 10: North America FPSO Market Revenue (Million), by Country 2024 & 2032
- Figure 11: North America FPSO Market Revenue Share (%), by Country 2024 & 2032
- Figure 12: MEA FPSO Market Revenue (Million), by Country 2024 & 2032
- Figure 13: MEA FPSO Market Revenue Share (%), by Country 2024 & 2032
- Figure 14: North America FPSO Market Revenue (Million), by Ownership 2024 & 2032
- Figure 15: North America FPSO Market Revenue Share (%), by Ownership 2024 & 2032
- Figure 16: North America FPSO Market Revenue (Million), by Water Depth 2024 & 2032
- Figure 17: North America FPSO Market Revenue Share (%), by Water Depth 2024 & 2032
- Figure 18: North America FPSO Market Revenue (Million), by Country 2024 & 2032
- Figure 19: North America FPSO Market Revenue Share (%), by Country 2024 & 2032
- Figure 20: Europe FPSO Market Revenue (Million), by Ownership 2024 & 2032
- Figure 21: Europe FPSO Market Revenue Share (%), by Ownership 2024 & 2032
- Figure 22: Europe FPSO Market Revenue (Million), by Water Depth 2024 & 2032
- Figure 23: Europe FPSO Market Revenue Share (%), by Water Depth 2024 & 2032
- Figure 24: Europe FPSO Market Revenue (Million), by Country 2024 & 2032
- Figure 25: Europe FPSO Market Revenue Share (%), by Country 2024 & 2032
- Figure 26: Asia Pacific FPSO Market Revenue (Million), by Ownership 2024 & 2032
- Figure 27: Asia Pacific FPSO Market Revenue Share (%), by Ownership 2024 & 2032
- Figure 28: Asia Pacific FPSO Market Revenue (Million), by Water Depth 2024 & 2032
- Figure 29: Asia Pacific FPSO Market Revenue Share (%), by Water Depth 2024 & 2032
- Figure 30: Asia Pacific FPSO Market Revenue (Million), by Country 2024 & 2032
- Figure 31: Asia Pacific FPSO Market Revenue Share (%), by Country 2024 & 2032
- Figure 32: South America FPSO Market Revenue (Million), by Ownership 2024 & 2032
- Figure 33: South America FPSO Market Revenue Share (%), by Ownership 2024 & 2032
- Figure 34: South America FPSO Market Revenue (Million), by Water Depth 2024 & 2032
- Figure 35: South America FPSO Market Revenue Share (%), by Water Depth 2024 & 2032
- Figure 36: South America FPSO Market Revenue (Million), by Country 2024 & 2032
- Figure 37: South America FPSO Market Revenue Share (%), by Country 2024 & 2032
- Figure 38: Middle East and Africa FPSO Market Revenue (Million), by Ownership 2024 & 2032
- Figure 39: Middle East and Africa FPSO Market Revenue Share (%), by Ownership 2024 & 2032
- Figure 40: Middle East and Africa FPSO Market Revenue (Million), by Water Depth 2024 & 2032
- Figure 41: Middle East and Africa FPSO Market Revenue Share (%), by Water Depth 2024 & 2032
- Figure 42: Middle East and Africa FPSO Market Revenue (Million), by Country 2024 & 2032
- Figure 43: Middle East and Africa FPSO Market Revenue Share (%), by Country 2024 & 2032
List of Tables
- Table 1: Global FPSO Market Revenue Million Forecast, by Region 2019 & 2032
- Table 2: Global FPSO Market Revenue Million Forecast, by Ownership 2019 & 2032
- Table 3: Global FPSO Market Revenue Million Forecast, by Water Depth 2019 & 2032
- Table 4: Global FPSO Market Revenue Million Forecast, by Region 2019 & 2032
- Table 5: Global FPSO Market Revenue Million Forecast, by Country 2019 & 2032
- Table 6: United States FPSO Market Revenue (Million) Forecast, by Application 2019 & 2032
- Table 7: Canada FPSO Market Revenue (Million) Forecast, by Application 2019 & 2032
- Table 8: Mexico FPSO Market Revenue (Million) Forecast, by Application 2019 & 2032
- Table 9: Global FPSO Market Revenue Million Forecast, by Country 2019 & 2032
- Table 10: Germany FPSO Market Revenue (Million) Forecast, by Application 2019 & 2032
- Table 11: United Kingdom FPSO Market Revenue (Million) Forecast, by Application 2019 & 2032
- Table 12: France FPSO Market Revenue (Million) Forecast, by Application 2019 & 2032
- Table 13: Spain FPSO Market Revenue (Million) Forecast, by Application 2019 & 2032
- Table 14: Italy FPSO Market Revenue (Million) Forecast, by Application 2019 & 2032
- Table 15: Spain FPSO Market Revenue (Million) Forecast, by Application 2019 & 2032
- Table 16: Belgium FPSO Market Revenue (Million) Forecast, by Application 2019 & 2032
- Table 17: Netherland FPSO Market Revenue (Million) Forecast, by Application 2019 & 2032
- Table 18: Nordics FPSO Market Revenue (Million) Forecast, by Application 2019 & 2032
- Table 19: Rest of Europe FPSO Market Revenue (Million) Forecast, by Application 2019 & 2032
- Table 20: Global FPSO Market Revenue Million Forecast, by Country 2019 & 2032
- Table 21: China FPSO Market Revenue (Million) Forecast, by Application 2019 & 2032
- Table 22: Japan FPSO Market Revenue (Million) Forecast, by Application 2019 & 2032
- Table 23: India FPSO Market Revenue (Million) Forecast, by Application 2019 & 2032
- Table 24: South Korea FPSO Market Revenue (Million) Forecast, by Application 2019 & 2032
- Table 25: Southeast Asia FPSO Market Revenue (Million) Forecast, by Application 2019 & 2032
- Table 26: Australia FPSO Market Revenue (Million) Forecast, by Application 2019 & 2032
- Table 27: Indonesia FPSO Market Revenue (Million) Forecast, by Application 2019 & 2032
- Table 28: Phillipes FPSO Market Revenue (Million) Forecast, by Application 2019 & 2032
- Table 29: Singapore FPSO Market Revenue (Million) Forecast, by Application 2019 & 2032
- Table 30: Thailandc FPSO Market Revenue (Million) Forecast, by Application 2019 & 2032
- Table 31: Rest of Asia Pacific FPSO Market Revenue (Million) Forecast, by Application 2019 & 2032
- Table 32: Global FPSO Market Revenue Million Forecast, by Country 2019 & 2032
- Table 33: Brazil FPSO Market Revenue (Million) Forecast, by Application 2019 & 2032
- Table 34: Argentina FPSO Market Revenue (Million) Forecast, by Application 2019 & 2032
- Table 35: Peru FPSO Market Revenue (Million) Forecast, by Application 2019 & 2032
- Table 36: Chile FPSO Market Revenue (Million) Forecast, by Application 2019 & 2032
- Table 37: Colombia FPSO Market Revenue (Million) Forecast, by Application 2019 & 2032
- Table 38: Ecuador FPSO Market Revenue (Million) Forecast, by Application 2019 & 2032
- Table 39: Venezuela FPSO Market Revenue (Million) Forecast, by Application 2019 & 2032
- Table 40: Rest of South America FPSO Market Revenue (Million) Forecast, by Application 2019 & 2032
- Table 41: Global FPSO Market Revenue Million Forecast, by Country 2019 & 2032
- Table 42: United States FPSO Market Revenue (Million) Forecast, by Application 2019 & 2032
- Table 43: Canada FPSO Market Revenue (Million) Forecast, by Application 2019 & 2032
- Table 44: Mexico FPSO Market Revenue (Million) Forecast, by Application 2019 & 2032
- Table 45: Global FPSO Market Revenue Million Forecast, by Country 2019 & 2032
- Table 46: United Arab Emirates FPSO Market Revenue (Million) Forecast, by Application 2019 & 2032
- Table 47: Saudi Arabia FPSO Market Revenue (Million) Forecast, by Application 2019 & 2032
- Table 48: South Africa FPSO Market Revenue (Million) Forecast, by Application 2019 & 2032
- Table 49: Rest of Middle East and Africa FPSO Market Revenue (Million) Forecast, by Application 2019 & 2032
- Table 50: Global FPSO Market Revenue Million Forecast, by Ownership 2019 & 2032
- Table 51: Global FPSO Market Revenue Million Forecast, by Water Depth 2019 & 2032
- Table 52: Global FPSO Market Revenue Million Forecast, by Country 2019 & 2032
- Table 53: United States FPSO Market Revenue (Million) Forecast, by Application 2019 & 2032
- Table 54: Canada FPSO Market Revenue (Million) Forecast, by Application 2019 & 2032
- Table 55: Mexico FPSO Market Revenue (Million) Forecast, by Application 2019 & 2032
- Table 56: Rest of North America FPSO Market Revenue (Million) Forecast, by Application 2019 & 2032
- Table 57: Global FPSO Market Revenue Million Forecast, by Ownership 2019 & 2032
- Table 58: Global FPSO Market Revenue Million Forecast, by Water Depth 2019 & 2032
- Table 59: Global FPSO Market Revenue Million Forecast, by Country 2019 & 2032
- Table 60: Norway FPSO Market Revenue (Million) Forecast, by Application 2019 & 2032
- Table 61: United Kingdom FPSO Market Revenue (Million) Forecast, by Application 2019 & 2032
- Table 62: Russia FPSO Market Revenue (Million) Forecast, by Application 2019 & 2032
- Table 63: Netherland FPSO Market Revenue (Million) Forecast, by Application 2019 & 2032
- Table 64: France FPSO Market Revenue (Million) Forecast, by Application 2019 & 2032
- Table 65: Italy FPSO Market Revenue (Million) Forecast, by Application 2019 & 2032
- Table 66: NORDIC FPSO Market Revenue (Million) Forecast, by Application 2019 & 2032
- Table 67: Germany FPSO Market Revenue (Million) Forecast, by Application 2019 & 2032
- Table 68: Spain FPSO Market Revenue (Million) Forecast, by Application 2019 & 2032
- Table 69: Rest of Europe FPSO Market Revenue (Million) Forecast, by Application 2019 & 2032
- Table 70: Global FPSO Market Revenue Million Forecast, by Ownership 2019 & 2032
- Table 71: Global FPSO Market Revenue Million Forecast, by Water Depth 2019 & 2032
- Table 72: Global FPSO Market Revenue Million Forecast, by Country 2019 & 2032
- Table 73: China FPSO Market Revenue (Million) Forecast, by Application 2019 & 2032
- Table 74: India FPSO Market Revenue (Million) Forecast, by Application 2019 & 2032
- Table 75: Australia FPSO Market Revenue (Million) Forecast, by Application 2019 & 2032
- Table 76: Indonesia FPSO Market Revenue (Million) Forecast, by Application 2019 & 2032
- Table 77: Malaysia FPSO Market Revenue (Million) Forecast, by Application 2019 & 2032
- Table 78: Thailand FPSO Market Revenue (Million) Forecast, by Application 2019 & 2032
- Table 79: Japan FPSO Market Revenue (Million) Forecast, by Application 2019 & 2032
- Table 80: Vietnam FPSO Market Revenue (Million) Forecast, by Application 2019 & 2032
- Table 81: Rest of Asia Pacific FPSO Market Revenue (Million) Forecast, by Application 2019 & 2032
- Table 82: Global FPSO Market Revenue Million Forecast, by Ownership 2019 & 2032
- Table 83: Global FPSO Market Revenue Million Forecast, by Water Depth 2019 & 2032
- Table 84: Global FPSO Market Revenue Million Forecast, by Country 2019 & 2032
- Table 85: Brazil FPSO Market Revenue (Million) Forecast, by Application 2019 & 2032
- Table 86: Argentina FPSO Market Revenue (Million) Forecast, by Application 2019 & 2032
- Table 87: Venezuela FPSO Market Revenue (Million) Forecast, by Application 2019 & 2032
- Table 88: Colombia FPSO Market Revenue (Million) Forecast, by Application 2019 & 2032
- Table 89: Rest of South America FPSO Market Revenue (Million) Forecast, by Application 2019 & 2032
- Table 90: Global FPSO Market Revenue Million Forecast, by Ownership 2019 & 2032
- Table 91: Global FPSO Market Revenue Million Forecast, by Water Depth 2019 & 2032
- Table 92: Global FPSO Market Revenue Million Forecast, by Country 2019 & 2032
- Table 93: Saudi Arabia FPSO Market Revenue (Million) Forecast, by Application 2019 & 2032
- Table 94: United Arab Emirates FPSO Market Revenue (Million) Forecast, by Application 2019 & 2032
- Table 95: Nigeria FPSO Market Revenue (Million) Forecast, by Application 2019 & 2032
- Table 96: Algeria FPSO Market Revenue (Million) Forecast, by Application 2019 & 2032
- Table 97: Qatar FPSO Market Revenue (Million) Forecast, by Application 2019 & 2032
- Table 98: South Africa FPSO Market Revenue (Million) Forecast, by Application 2019 & 2032
- Table 99: Egypt FPSO Market Revenue (Million) Forecast, by Application 2019 & 2032
- Table 100: Rest of Middle East and Africa FPSO Market Revenue (Million) Forecast, by Application 2019 & 2032
Frequently Asked Questions
1. What is the projected Compound Annual Growth Rate (CAGR) of the FPSO Market?
The projected CAGR is approximately 8.50%.
2. Which companies are prominent players in the FPSO Market?
Key companies in the market include 6 Shell PLC, 5 Bluewater Holding BV, 6 Saipem SpA, 7 BP PLC*List Not Exhaustive, 1 Petroleo Brasileiro SA (Petrobras), 4 Teekay Offshore Partners LP, 5 Chevron Corporation, 3 TotalEnergies SE, 7 Petrofac Limited, 4 ExxonMobil Corp, 1 Modec Inc, 3 BW Offshore Limited, FPSO Operators, 2 SBM Offshore NV, 2 CNOOC Ltd, FPSO Contractors.
3. What are the main segments of the FPSO Market?
The market segments include Ownership, Water Depth.
4. Can you provide details about the market size?
The market size is estimated to be USD 12.04 Million as of 2022.
5. What are some drivers contributing to market growth?
4.; Increasing Offshore Oil and Gas Exploration and Production Activities4.; Growing Demand for Energy.
6. What are the notable trends driving market growth?
Contractor-owned FPSO Expected to Dominate the Market.
7. Are there any restraints impacting market growth?
4.; High Upfront Costs.
8. Can you provide examples of recent developments in the market?
May 2023: SBM Offshore and Esso Exploration & Production Guyana entered a 10-year Operations and Maintenance Enabling Agreement. The agreement entails SBM Offshore being responsible for the operations and maintenance of four FPSOs: Liza Destiny, Liza Unity, Prosperity, and ONE GUYANA.
9. What pricing options are available for accessing the report?
Pricing options include single-user, multi-user, and enterprise licenses priced at USD 4750, USD 5250, and USD 8750 respectively.
10. Is the market size provided in terms of value or volume?
The market size is provided in terms of value, measured in Million.
11. Are there any specific market keywords associated with the report?
Yes, the market keyword associated with the report is "FPSO Market," which aids in identifying and referencing the specific market segment covered.
12. How do I determine which pricing option suits my needs best?
The pricing options vary based on user requirements and access needs. Individual users may opt for single-user licenses, while businesses requiring broader access may choose multi-user or enterprise licenses for cost-effective access to the report.
13. Are there any additional resources or data provided in the FPSO Market report?
While the report offers comprehensive insights, it's advisable to review the specific contents or supplementary materials provided to ascertain if additional resources or data are available.
14. How can I stay updated on further developments or reports in the FPSO Market?
To stay informed about further developments, trends, and reports in the FPSO Market, consider subscribing to industry newsletters, following relevant companies and organizations, or regularly checking reputable industry news sources and publications.
Methodology
Step 1 - Identification of Relevant Samples Size from Population Database


Step 2 - Approaches for Defining Global Market Size (Value, Volume* & Price*)

Note*: In applicable scenarios
Step 3 - Data Sources
Primary Research
- Web Analytics
- Survey Reports
- Research Institute
- Latest Research Reports
- Opinion Leaders
Secondary Research
- Annual Reports
- White Paper
- Latest Press Release
- Industry Association
- Paid Database
- Investor Presentations

Step 4 - Data Triangulation
Involves using different sources of information in order to increase the validity of a study
These sources are likely to be stakeholders in a program - participants, other researchers, program staff, other community members, and so on.
Then we put all data in single framework & apply various statistical tools to find out the dynamic on the market.
During the analysis stage, feedback from the stakeholder groups would be compared to determine areas of agreement as well as areas of divergence
