

Key Insights
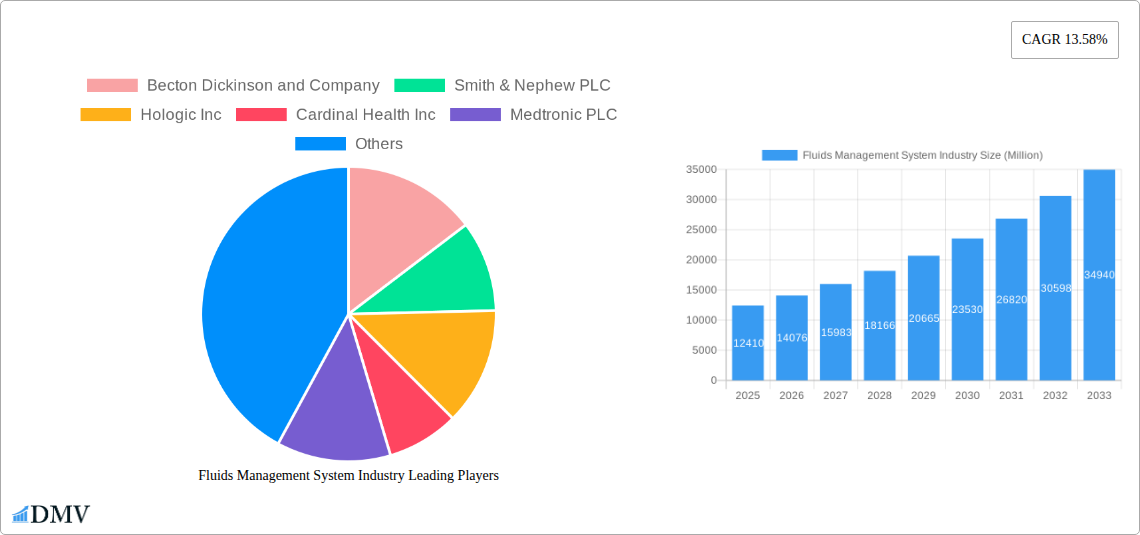
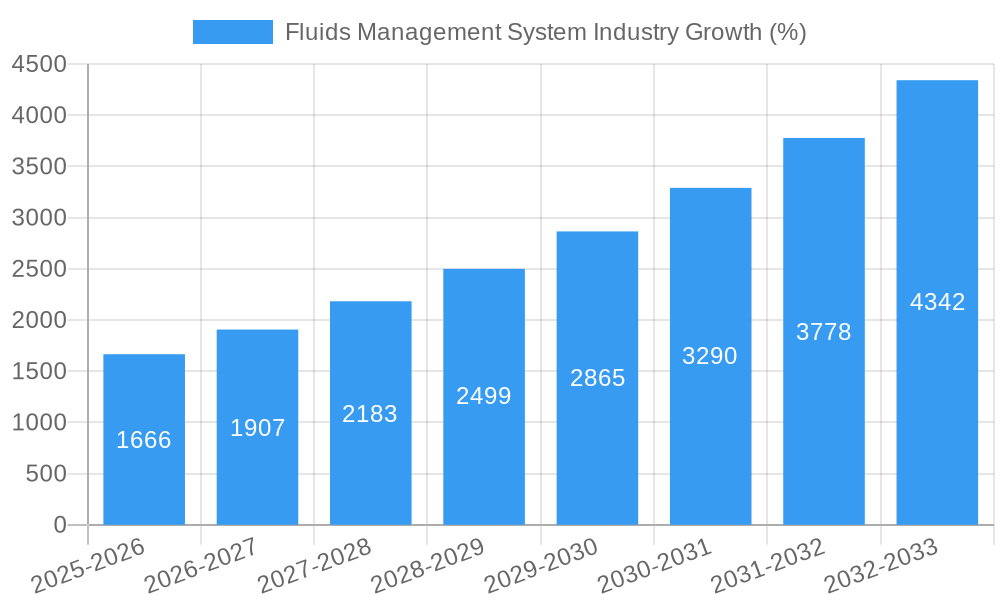
The global fluids management system market, valued at $12.41 billion in 2025, is projected to experience robust growth, driven by a compound annual growth rate (CAGR) of 13.58% from 2025 to 2033. This expansion is fueled by several key factors. Firstly, the rising prevalence of chronic diseases like diabetes and cardiovascular ailments necessitates increased use of dialysis and other fluid management therapies. Secondly, advancements in minimally invasive surgical techniques, particularly in arthroscopy, laparoscopy, and cardiology, are creating a higher demand for sophisticated fluid management systems ensuring precise fluid control and reduced complications. Technological innovations, such as improved catheter designs, enhanced fluid warming systems, and more efficient waste management solutions, contribute significantly to market growth. The increasing adoption of advanced imaging techniques to monitor fluid balance in patients further boosts the market. Finally, the growing geriatric population, which is more susceptible to fluid imbalances and related complications, is driving demand for effective fluid management across various healthcare settings.
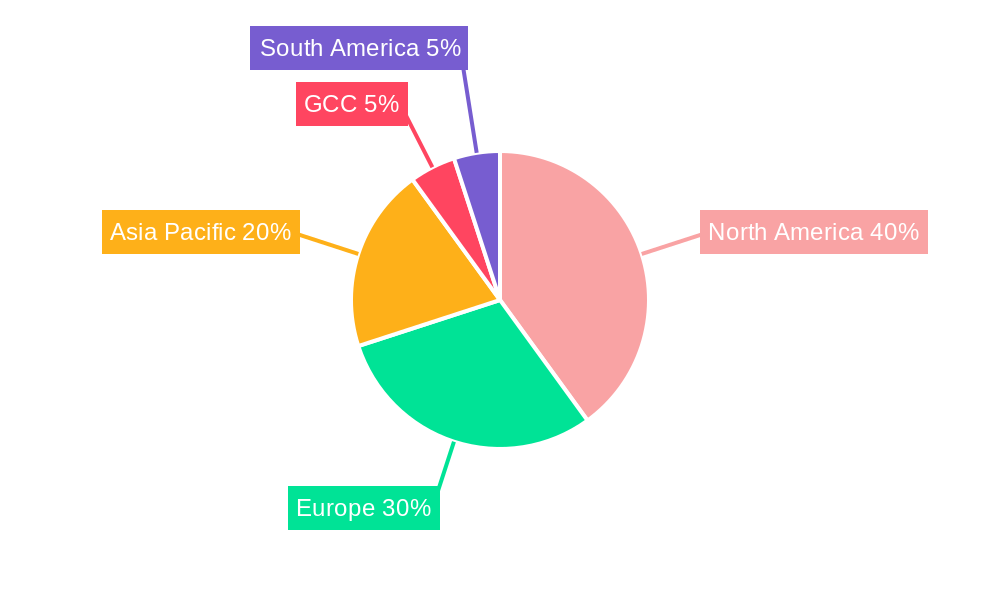
Geographically, North America currently dominates the market owing to well-established healthcare infrastructure, high adoption of advanced technologies, and favorable reimbursement policies. However, the Asia-Pacific region is anticipated to witness the fastest growth during the forecast period, driven by rapidly improving healthcare infrastructure, rising disposable incomes, and a growing awareness about advanced medical treatments. Market segmentation reveals that disposables and accessories constitute a significant portion of the market, reflecting the high volume consumption of items like catheters, tubing sets, and transducers. Within applications, arthroscopy, laparoscopy, and cardiology are major contributors, underscoring the significant role of minimally invasive procedures and cardiac care in driving demand. Key players in the market, including Becton Dickinson, Smith & Nephew, and Medtronic, are investing heavily in research and development to enhance product offerings and expand their market presence through strategic acquisitions and partnerships. Competitive intensity is expected to remain high, with companies focusing on innovation and diversification to maintain a competitive edge.
Fluids Management System Industry Market Report: 2019-2033
This comprehensive report provides an in-depth analysis of the Fluids Management System industry, projecting a market valuation of xx Million by 2033. It offers invaluable insights for stakeholders, investors, and industry professionals seeking to understand the market's dynamic landscape and navigate future opportunities. The study period covers 2019-2033, with 2025 as the base and estimated year. This report is crucial for strategic decision-making, encompassing market sizing, segmentation, competitive analysis, and future projections.
Fluids Management System Industry Market Composition & Trends
The global Fluids Management System market, valued at xx Million in 2025, exhibits a moderately consolidated structure. Key players, including Becton Dickinson and Company, Smith & Nephew PLC, Hologic Inc, Cardinal Health Inc, Medtronic PLC, Stryker Corporation, Johnson & Johnson, B Braun Melsungen AG, Smiths Medical Inc, and Baxter International Inc, hold significant market share, though the exact distribution remains dynamic due to ongoing mergers and acquisitions (M&A) activity. The market's growth is fueled by technological advancements such as minimally invasive surgical techniques and the increasing prevalence of chronic diseases. Stringent regulatory frameworks, particularly concerning device safety and efficacy, significantly influence market dynamics. Substitute products, though limited, pose a competitive challenge. The end-user profile comprises hospitals, ambulatory surgical centers, and clinics globally, with variations in adoption rates based on healthcare infrastructure and economic factors. M&A activity in the past five years has exceeded xx Million, signifying consolidation trends and strategic investments in the sector.
- Market Concentration: Moderately Consolidated
- Innovation Catalysts: Minimally invasive surgery, technological advancements in catheter design.
- Regulatory Landscape: Stringent, focusing on safety and efficacy.
- Substitute Products: Limited, primarily impacting niche segments.
- End-User Profile: Hospitals, ambulatory surgical centers, clinics.
- M&A Activity: Over xx Million in the last 5 years.
Fluids Management System Industry Industry Evolution
The Fluids Management System market has demonstrated a Compound Annual Growth Rate (CAGR) of xx% during the historical period (2019-2024) and is projected to maintain a CAGR of xx% during the forecast period (2025-2033). This growth is driven by several factors, including an aging global population leading to increased incidences of chronic diseases requiring fluid management solutions, rising disposable incomes in emerging economies increasing healthcare spending, and a growing preference for minimally invasive surgical procedures. Technological advancements, particularly in catheter technology, fluid warming systems, and disposable devices, are further propelling market expansion. Consumer demand is shifting towards more sophisticated, user-friendly, and cost-effective solutions, driving innovation in the sector. The adoption rate of advanced fluid management systems has shown significant growth, exceeding xx% in key regions. The increasing focus on reducing healthcare-associated infections also influences the demand for disposable products. Furthermore, strategic partnerships and technological collaborations between manufacturers and healthcare providers are influencing the evolution of this market.
Leading Regions, Countries, or Segments in Fluids Management System Industry
The North American region currently dominates the Fluids Management System market, driven by factors such as advanced healthcare infrastructure, high healthcare expenditure, and a high prevalence of chronic diseases. Within this region, the United States holds the largest market share, followed by Canada.
Key Drivers for North American Dominance:
- High healthcare expenditure.
- Advanced healthcare infrastructure.
- High prevalence of chronic diseases.
- Strong regulatory support for medical device innovation.
- Significant investments in R&D.
Leading Segments:
- Disposables and Accessories: Catheters hold the largest market share within this segment, followed by bloodlines and tubing sets, driven by the growing demand for single-use devices to minimize infection risks.
- Application: Cardiology currently holds the largest share in the application segment, driven by the prevalence of cardiovascular diseases and the increasing adoption of minimally invasive cardiac procedures. Urology and Gastroenterology are also significant segments experiencing notable growth.
- Product: Dialyzers lead the product segment, attributed to a substantial increase in end-stage renal disease cases. Fluid warming systems are also gaining popularity due to increased awareness about maintaining body temperature during surgery.
Europe and Asia-Pacific also exhibit significant growth potential, primarily driven by increasing healthcare expenditure and rising adoption of minimally invasive procedures in these regions.
Fluids Management System Industry Product Innovations
Recent innovations in the fluids management system industry have focused on improving the safety, efficacy, and usability of existing products. This includes the development of smaller, more flexible catheters, improved fluid warming systems with precise temperature control, and the incorporation of advanced materials to enhance biocompatibility and reduce the risk of infection. Furthermore, integrated monitoring systems are being incorporated into various devices to provide real-time data on fluid parameters. These innovations aim to enhance patient outcomes and reduce procedural complications.
Propelling Factors for Fluids Management System Industry Growth
Technological advancements, particularly in minimally invasive surgical techniques and catheter technology, are key growth drivers. The rising prevalence of chronic diseases demanding fluid management, coupled with increased healthcare spending globally, contributes significantly. Favorable regulatory environments supporting medical device innovation and the growing adoption of disposable products for infection control further boost market expansion.
Obstacles in the Fluids Management System Industry Market
Stringent regulatory requirements and lengthy approval processes can hinder market entry and innovation. Supply chain disruptions, particularly regarding raw materials, can impact production and pricing. Intense competition among established players and emerging market entrants puts pressure on margins and necessitates continuous innovation. The impact of these factors on revenue is estimated to be approximately xx Million annually.
Future Opportunities in Fluids Management System Industry
Emerging markets in developing economies present significant untapped potential. Technological advancements, such as smart catheters with integrated sensors and improved fluid management algorithms, offer substantial opportunities for growth. The growing focus on personalized medicine and the development of tailored fluid management solutions based on patient-specific needs are also emerging trends.
Major Players in the Fluids Management System Industry Ecosystem
- Becton Dickinson and Company (https://www.bd.com/)
- Smith & Nephew PLC (https://www.smith-nephew.com/)
- Hologic Inc (https://www.hologic.com/)
- Cardinal Health Inc (https://www.cardinalhealth.com/)
- Medtronic PLC (https://www.medtronic.com/)
- Stryker Corporation (https://www.stryker.com/)
- Johnson & Johnson (https://www.jnj.com/)
- B Braun Melsungen AG (https://www.bbraun.com/)
- Smiths Medical Inc (https://www.smiths-medical.com/)
- Baxter International Inc (https://www.baxter.com/)
Key Developments in Fluids Management System Industry Industry
- April 2022: Transit Scientific receives FDA clearance for its XO Cross Support catheter platform for coronary use. This significantly enhances the safety and efficacy of coronary procedures.
- February 2022: Medtronic plc announces FDA approval of Freezor and Freezor Xtra Cardiac Cryoablation Focal Catheters for pediatric AVNRT treatment, expanding treatment options for this specific patient population.
Strategic Fluids Management System Industry Market Forecast
The Fluids Management System market is poised for continued growth, driven by technological innovation, increasing healthcare spending, and the rising prevalence of chronic diseases. Emerging markets and the adoption of new technologies, particularly in minimally invasive procedures, present significant opportunities. The market is expected to experience healthy growth, exceeding projections in several key segments. Strategic partnerships and investments in R&D will continue to shape the competitive landscape, further propelling market expansion.
Fluids Management System Industry Segmentation
-
1. Product
- 1.1. Dialyzers
- 1.2. Insufflators
- 1.3. Suction and Irrigation Systems
- 1.4. Fluid Warming Systems
- 1.5. Fluid Waste Management
- 1.6. Other Products
-
2. Disposables and Accessories
- 2.1. Catheters
- 2.2. Bloodlines
- 2.3. Transducers
- 2.4. Valves
- 2.5. Tubing Sets
- 2.6. Other Disposables and Accessories
-
3. Application
- 3.1. Arthroscopy
- 3.2. Laparoscopy
- 3.3. Neurology
- 3.4. Cardiology
- 3.5. Urology
- 3.6. Dental
- 3.7. Gastroenterology
- 3.8. Other Applications
Fluids Management System Industry Segmentation By Geography
-
1. North America
- 1.1. United States
- 1.2. Canada
- 1.3. Mexico
-
2. Europe
- 2.1. Germany
- 2.2. United Kingdom
- 2.3. France
- 2.4. Italy
- 2.5. Spain
- 2.6. Rest of Europe
-
3. Asia Pacific
- 3.1. China
- 3.2. Japan
- 3.3. India
- 3.4. Australia
- 3.5. South Korea
- 3.6. Rest of Asia Pacific
- 4. Middle East
-
5. GCC
- 5.1. South Africa
- 5.2. Rest of Middle East
-
6. South America
- 6.1. Brazil
- 6.2. Argentina
- 6.3. Rest of South America
Fluids Management System Industry REPORT HIGHLIGHTS
| Aspects | Details |
|---|---|
| Study Period | 2019-2033 |
| Base Year | 2024 |
| Estimated Year | 2025 |
| Forecast Period | 2025-2033 |
| Historical Period | 2019-2024 |
| Growth Rate | CAGR of 13.58% from 2019-2033 |
| Segmentation |
|
Table of Contents
- 1. Introduction
- 1.1. Research Scope
- 1.2. Market Segmentation
- 1.3. Research Methodology
- 1.4. Definitions and Assumptions
- 2. Executive Summary
- 2.1. Introduction
- 3. Market Dynamics
- 3.1. Introduction
- 3.2. Market Drivers
- 3.2.1. Rise in the Number of Minimally-invasive Surgery Procedures; Rising Burden of Chronic Diseases; Technological Advancements
- 3.3. Market Restrains
- 3.3.1. Lack of Skilled Labor; Expensive Surgical Procedures
- 3.4. Market Trends
- 3.4.1. Cardiology Segment is Expected to Witness Growth Over the Forecast Period
- 4. Market Factor Analysis
- 4.1. Porters Five Forces
- 4.2. Supply/Value Chain
- 4.3. PESTEL analysis
- 4.4. Market Entropy
- 4.5. Patent/Trademark Analysis
- 5. Global Fluids Management System Industry Analysis, Insights and Forecast, 2019-2031
- 5.1. Market Analysis, Insights and Forecast - by Product
- 5.1.1. Dialyzers
- 5.1.2. Insufflators
- 5.1.3. Suction and Irrigation Systems
- 5.1.4. Fluid Warming Systems
- 5.1.5. Fluid Waste Management
- 5.1.6. Other Products
- 5.2. Market Analysis, Insights and Forecast - by Disposables and Accessories
- 5.2.1. Catheters
- 5.2.2. Bloodlines
- 5.2.3. Transducers
- 5.2.4. Valves
- 5.2.5. Tubing Sets
- 5.2.6. Other Disposables and Accessories
- 5.3. Market Analysis, Insights and Forecast - by Application
- 5.3.1. Arthroscopy
- 5.3.2. Laparoscopy
- 5.3.3. Neurology
- 5.3.4. Cardiology
- 5.3.5. Urology
- 5.3.6. Dental
- 5.3.7. Gastroenterology
- 5.3.8. Other Applications
- 5.4. Market Analysis, Insights and Forecast - by Region
- 5.4.1. North America
- 5.4.2. Europe
- 5.4.3. Asia Pacific
- 5.4.4. Middle East
- 5.4.5. GCC
- 5.4.6. South America
- 5.1. Market Analysis, Insights and Forecast - by Product
- 6. North America Fluids Management System Industry Analysis, Insights and Forecast, 2019-2031
- 6.1. Market Analysis, Insights and Forecast - by Product
- 6.1.1. Dialyzers
- 6.1.2. Insufflators
- 6.1.3. Suction and Irrigation Systems
- 6.1.4. Fluid Warming Systems
- 6.1.5. Fluid Waste Management
- 6.1.6. Other Products
- 6.2. Market Analysis, Insights and Forecast - by Disposables and Accessories
- 6.2.1. Catheters
- 6.2.2. Bloodlines
- 6.2.3. Transducers
- 6.2.4. Valves
- 6.2.5. Tubing Sets
- 6.2.6. Other Disposables and Accessories
- 6.3. Market Analysis, Insights and Forecast - by Application
- 6.3.1. Arthroscopy
- 6.3.2. Laparoscopy
- 6.3.3. Neurology
- 6.3.4. Cardiology
- 6.3.5. Urology
- 6.3.6. Dental
- 6.3.7. Gastroenterology
- 6.3.8. Other Applications
- 6.1. Market Analysis, Insights and Forecast - by Product
- 7. Europe Fluids Management System Industry Analysis, Insights and Forecast, 2019-2031
- 7.1. Market Analysis, Insights and Forecast - by Product
- 7.1.1. Dialyzers
- 7.1.2. Insufflators
- 7.1.3. Suction and Irrigation Systems
- 7.1.4. Fluid Warming Systems
- 7.1.5. Fluid Waste Management
- 7.1.6. Other Products
- 7.2. Market Analysis, Insights and Forecast - by Disposables and Accessories
- 7.2.1. Catheters
- 7.2.2. Bloodlines
- 7.2.3. Transducers
- 7.2.4. Valves
- 7.2.5. Tubing Sets
- 7.2.6. Other Disposables and Accessories
- 7.3. Market Analysis, Insights and Forecast - by Application
- 7.3.1. Arthroscopy
- 7.3.2. Laparoscopy
- 7.3.3. Neurology
- 7.3.4. Cardiology
- 7.3.5. Urology
- 7.3.6. Dental
- 7.3.7. Gastroenterology
- 7.3.8. Other Applications
- 7.1. Market Analysis, Insights and Forecast - by Product
- 8. Asia Pacific Fluids Management System Industry Analysis, Insights and Forecast, 2019-2031
- 8.1. Market Analysis, Insights and Forecast - by Product
- 8.1.1. Dialyzers
- 8.1.2. Insufflators
- 8.1.3. Suction and Irrigation Systems
- 8.1.4. Fluid Warming Systems
- 8.1.5. Fluid Waste Management
- 8.1.6. Other Products
- 8.2. Market Analysis, Insights and Forecast - by Disposables and Accessories
- 8.2.1. Catheters
- 8.2.2. Bloodlines
- 8.2.3. Transducers
- 8.2.4. Valves
- 8.2.5. Tubing Sets
- 8.2.6. Other Disposables and Accessories
- 8.3. Market Analysis, Insights and Forecast - by Application
- 8.3.1. Arthroscopy
- 8.3.2. Laparoscopy
- 8.3.3. Neurology
- 8.3.4. Cardiology
- 8.3.5. Urology
- 8.3.6. Dental
- 8.3.7. Gastroenterology
- 8.3.8. Other Applications
- 8.1. Market Analysis, Insights and Forecast - by Product
- 9. Middle East Fluids Management System Industry Analysis, Insights and Forecast, 2019-2031
- 9.1. Market Analysis, Insights and Forecast - by Product
- 9.1.1. Dialyzers
- 9.1.2. Insufflators
- 9.1.3. Suction and Irrigation Systems
- 9.1.4. Fluid Warming Systems
- 9.1.5. Fluid Waste Management
- 9.1.6. Other Products
- 9.2. Market Analysis, Insights and Forecast - by Disposables and Accessories
- 9.2.1. Catheters
- 9.2.2. Bloodlines
- 9.2.3. Transducers
- 9.2.4. Valves
- 9.2.5. Tubing Sets
- 9.2.6. Other Disposables and Accessories
- 9.3. Market Analysis, Insights and Forecast - by Application
- 9.3.1. Arthroscopy
- 9.3.2. Laparoscopy
- 9.3.3. Neurology
- 9.3.4. Cardiology
- 9.3.5. Urology
- 9.3.6. Dental
- 9.3.7. Gastroenterology
- 9.3.8. Other Applications
- 9.1. Market Analysis, Insights and Forecast - by Product
- 10. GCC Fluids Management System Industry Analysis, Insights and Forecast, 2019-2031
- 10.1. Market Analysis, Insights and Forecast - by Product
- 10.1.1. Dialyzers
- 10.1.2. Insufflators
- 10.1.3. Suction and Irrigation Systems
- 10.1.4. Fluid Warming Systems
- 10.1.5. Fluid Waste Management
- 10.1.6. Other Products
- 10.2. Market Analysis, Insights and Forecast - by Disposables and Accessories
- 10.2.1. Catheters
- 10.2.2. Bloodlines
- 10.2.3. Transducers
- 10.2.4. Valves
- 10.2.5. Tubing Sets
- 10.2.6. Other Disposables and Accessories
- 10.3. Market Analysis, Insights and Forecast - by Application
- 10.3.1. Arthroscopy
- 10.3.2. Laparoscopy
- 10.3.3. Neurology
- 10.3.4. Cardiology
- 10.3.5. Urology
- 10.3.6. Dental
- 10.3.7. Gastroenterology
- 10.3.8. Other Applications
- 10.1. Market Analysis, Insights and Forecast - by Product
- 11. South America Fluids Management System Industry Analysis, Insights and Forecast, 2019-2031
- 11.1. Market Analysis, Insights and Forecast - by Product
- 11.1.1. Dialyzers
- 11.1.2. Insufflators
- 11.1.3. Suction and Irrigation Systems
- 11.1.4. Fluid Warming Systems
- 11.1.5. Fluid Waste Management
- 11.1.6. Other Products
- 11.2. Market Analysis, Insights and Forecast - by Disposables and Accessories
- 11.2.1. Catheters
- 11.2.2. Bloodlines
- 11.2.3. Transducers
- 11.2.4. Valves
- 11.2.5. Tubing Sets
- 11.2.6. Other Disposables and Accessories
- 11.3. Market Analysis, Insights and Forecast - by Application
- 11.3.1. Arthroscopy
- 11.3.2. Laparoscopy
- 11.3.3. Neurology
- 11.3.4. Cardiology
- 11.3.5. Urology
- 11.3.6. Dental
- 11.3.7. Gastroenterology
- 11.3.8. Other Applications
- 11.1. Market Analysis, Insights and Forecast - by Product
- 12. North America Fluids Management System Industry Analysis, Insights and Forecast, 2019-2031
- 12.1. Market Analysis, Insights and Forecast - By Country/Sub-region
- 12.1.1. undefined
- 13. Europe Fluids Management System Industry Analysis, Insights and Forecast, 2019-2031
- 13.1. Market Analysis, Insights and Forecast - By Country/Sub-region
- 13.1.1. undefined
- 14. Asia Pacific Fluids Management System Industry Analysis, Insights and Forecast, 2019-2031
- 14.1. Market Analysis, Insights and Forecast - By Country/Sub-region
- 14.1.1. undefined
- 15. GCC Fluids Management System Industry Analysis, Insights and Forecast, 2019-2031
- 15.1. Market Analysis, Insights and Forecast - By Country/Sub-region
- 15.1.1. undefined
- 16. South America Fluids Management System Industry Analysis, Insights and Forecast, 2019-2031
- 16.1. Market Analysis, Insights and Forecast - By Country/Sub-region
- 16.1.1. undefined
- 17. Competitive Analysis
- 17.1. Global Market Share Analysis 2024
- 17.2. Company Profiles
- 17.2.1 Becton Dickinson and Company
- 17.2.1.1. Overview
- 17.2.1.2. Products
- 17.2.1.3. SWOT Analysis
- 17.2.1.4. Recent Developments
- 17.2.1.5. Financials (Based on Availability)
- 17.2.2 Smith & Nephew PLC
- 17.2.2.1. Overview
- 17.2.2.2. Products
- 17.2.2.3. SWOT Analysis
- 17.2.2.4. Recent Developments
- 17.2.2.5. Financials (Based on Availability)
- 17.2.3 Hologic Inc
- 17.2.3.1. Overview
- 17.2.3.2. Products
- 17.2.3.3. SWOT Analysis
- 17.2.3.4. Recent Developments
- 17.2.3.5. Financials (Based on Availability)
- 17.2.4 Cardinal Health Inc
- 17.2.4.1. Overview
- 17.2.4.2. Products
- 17.2.4.3. SWOT Analysis
- 17.2.4.4. Recent Developments
- 17.2.4.5. Financials (Based on Availability)
- 17.2.5 Medtronic PLC
- 17.2.5.1. Overview
- 17.2.5.2. Products
- 17.2.5.3. SWOT Analysis
- 17.2.5.4. Recent Developments
- 17.2.5.5. Financials (Based on Availability)
- 17.2.6 Stryker Corporation
- 17.2.6.1. Overview
- 17.2.6.2. Products
- 17.2.6.3. SWOT Analysis
- 17.2.6.4. Recent Developments
- 17.2.6.5. Financials (Based on Availability)
- 17.2.7 Johnson & Johnson
- 17.2.7.1. Overview
- 17.2.7.2. Products
- 17.2.7.3. SWOT Analysis
- 17.2.7.4. Recent Developments
- 17.2.7.5. Financials (Based on Availability)
- 17.2.8 B Braun Melsungen AG
- 17.2.8.1. Overview
- 17.2.8.2. Products
- 17.2.8.3. SWOT Analysis
- 17.2.8.4. Recent Developments
- 17.2.8.5. Financials (Based on Availability)
- 17.2.9 Smiths Medical Inc
- 17.2.9.1. Overview
- 17.2.9.2. Products
- 17.2.9.3. SWOT Analysis
- 17.2.9.4. Recent Developments
- 17.2.9.5. Financials (Based on Availability)
- 17.2.10 Baxter International Inc
- 17.2.10.1. Overview
- 17.2.10.2. Products
- 17.2.10.3. SWOT Analysis
- 17.2.10.4. Recent Developments
- 17.2.10.5. Financials (Based on Availability)
- 17.2.1 Becton Dickinson and Company
List of Figures
- Figure 1: Global Fluids Management System Industry Revenue Breakdown (Million, %) by Region 2024 & 2032
- Figure 2: Global Fluids Management System Industry Volume Breakdown (K Unit, %) by Region 2024 & 2032
- Figure 3: North America Fluids Management System Industry Revenue (Million), by Country 2024 & 2032
- Figure 4: North America Fluids Management System Industry Volume (K Unit), by Country 2024 & 2032
- Figure 5: North America Fluids Management System Industry Revenue Share (%), by Country 2024 & 2032
- Figure 6: North America Fluids Management System Industry Volume Share (%), by Country 2024 & 2032
- Figure 7: Europe Fluids Management System Industry Revenue (Million), by Country 2024 & 2032
- Figure 8: Europe Fluids Management System Industry Volume (K Unit), by Country 2024 & 2032
- Figure 9: Europe Fluids Management System Industry Revenue Share (%), by Country 2024 & 2032
- Figure 10: Europe Fluids Management System Industry Volume Share (%), by Country 2024 & 2032
- Figure 11: Asia Pacific Fluids Management System Industry Revenue (Million), by Country 2024 & 2032
- Figure 12: Asia Pacific Fluids Management System Industry Volume (K Unit), by Country 2024 & 2032
- Figure 13: Asia Pacific Fluids Management System Industry Revenue Share (%), by Country 2024 & 2032
- Figure 14: Asia Pacific Fluids Management System Industry Volume Share (%), by Country 2024 & 2032
- Figure 15: GCC Fluids Management System Industry Revenue (Million), by Country 2024 & 2032
- Figure 16: GCC Fluids Management System Industry Volume (K Unit), by Country 2024 & 2032
- Figure 17: GCC Fluids Management System Industry Revenue Share (%), by Country 2024 & 2032
- Figure 18: GCC Fluids Management System Industry Volume Share (%), by Country 2024 & 2032
- Figure 19: South America Fluids Management System Industry Revenue (Million), by Country 2024 & 2032
- Figure 20: South America Fluids Management System Industry Volume (K Unit), by Country 2024 & 2032
- Figure 21: South America Fluids Management System Industry Revenue Share (%), by Country 2024 & 2032
- Figure 22: South America Fluids Management System Industry Volume Share (%), by Country 2024 & 2032
- Figure 23: North America Fluids Management System Industry Revenue (Million), by Product 2024 & 2032
- Figure 24: North America Fluids Management System Industry Volume (K Unit), by Product 2024 & 2032
- Figure 25: North America Fluids Management System Industry Revenue Share (%), by Product 2024 & 2032
- Figure 26: North America Fluids Management System Industry Volume Share (%), by Product 2024 & 2032
- Figure 27: North America Fluids Management System Industry Revenue (Million), by Disposables and Accessories 2024 & 2032
- Figure 28: North America Fluids Management System Industry Volume (K Unit), by Disposables and Accessories 2024 & 2032
- Figure 29: North America Fluids Management System Industry Revenue Share (%), by Disposables and Accessories 2024 & 2032
- Figure 30: North America Fluids Management System Industry Volume Share (%), by Disposables and Accessories 2024 & 2032
- Figure 31: North America Fluids Management System Industry Revenue (Million), by Application 2024 & 2032
- Figure 32: North America Fluids Management System Industry Volume (K Unit), by Application 2024 & 2032
- Figure 33: North America Fluids Management System Industry Revenue Share (%), by Application 2024 & 2032
- Figure 34: North America Fluids Management System Industry Volume Share (%), by Application 2024 & 2032
- Figure 35: North America Fluids Management System Industry Revenue (Million), by Country 2024 & 2032
- Figure 36: North America Fluids Management System Industry Volume (K Unit), by Country 2024 & 2032
- Figure 37: North America Fluids Management System Industry Revenue Share (%), by Country 2024 & 2032
- Figure 38: North America Fluids Management System Industry Volume Share (%), by Country 2024 & 2032
- Figure 39: Europe Fluids Management System Industry Revenue (Million), by Product 2024 & 2032
- Figure 40: Europe Fluids Management System Industry Volume (K Unit), by Product 2024 & 2032
- Figure 41: Europe Fluids Management System Industry Revenue Share (%), by Product 2024 & 2032
- Figure 42: Europe Fluids Management System Industry Volume Share (%), by Product 2024 & 2032
- Figure 43: Europe Fluids Management System Industry Revenue (Million), by Disposables and Accessories 2024 & 2032
- Figure 44: Europe Fluids Management System Industry Volume (K Unit), by Disposables and Accessories 2024 & 2032
- Figure 45: Europe Fluids Management System Industry Revenue Share (%), by Disposables and Accessories 2024 & 2032
- Figure 46: Europe Fluids Management System Industry Volume Share (%), by Disposables and Accessories 2024 & 2032
- Figure 47: Europe Fluids Management System Industry Revenue (Million), by Application 2024 & 2032
- Figure 48: Europe Fluids Management System Industry Volume (K Unit), by Application 2024 & 2032
- Figure 49: Europe Fluids Management System Industry Revenue Share (%), by Application 2024 & 2032
- Figure 50: Europe Fluids Management System Industry Volume Share (%), by Application 2024 & 2032
- Figure 51: Europe Fluids Management System Industry Revenue (Million), by Country 2024 & 2032
- Figure 52: Europe Fluids Management System Industry Volume (K Unit), by Country 2024 & 2032
- Figure 53: Europe Fluids Management System Industry Revenue Share (%), by Country 2024 & 2032
- Figure 54: Europe Fluids Management System Industry Volume Share (%), by Country 2024 & 2032
- Figure 55: Asia Pacific Fluids Management System Industry Revenue (Million), by Product 2024 & 2032
- Figure 56: Asia Pacific Fluids Management System Industry Volume (K Unit), by Product 2024 & 2032
- Figure 57: Asia Pacific Fluids Management System Industry Revenue Share (%), by Product 2024 & 2032
- Figure 58: Asia Pacific Fluids Management System Industry Volume Share (%), by Product 2024 & 2032
- Figure 59: Asia Pacific Fluids Management System Industry Revenue (Million), by Disposables and Accessories 2024 & 2032
- Figure 60: Asia Pacific Fluids Management System Industry Volume (K Unit), by Disposables and Accessories 2024 & 2032
- Figure 61: Asia Pacific Fluids Management System Industry Revenue Share (%), by Disposables and Accessories 2024 & 2032
- Figure 62: Asia Pacific Fluids Management System Industry Volume Share (%), by Disposables and Accessories 2024 & 2032
- Figure 63: Asia Pacific Fluids Management System Industry Revenue (Million), by Application 2024 & 2032
- Figure 64: Asia Pacific Fluids Management System Industry Volume (K Unit), by Application 2024 & 2032
- Figure 65: Asia Pacific Fluids Management System Industry Revenue Share (%), by Application 2024 & 2032
- Figure 66: Asia Pacific Fluids Management System Industry Volume Share (%), by Application 2024 & 2032
- Figure 67: Asia Pacific Fluids Management System Industry Revenue (Million), by Country 2024 & 2032
- Figure 68: Asia Pacific Fluids Management System Industry Volume (K Unit), by Country 2024 & 2032
- Figure 69: Asia Pacific Fluids Management System Industry Revenue Share (%), by Country 2024 & 2032
- Figure 70: Asia Pacific Fluids Management System Industry Volume Share (%), by Country 2024 & 2032
- Figure 71: Middle East Fluids Management System Industry Revenue (Million), by Product 2024 & 2032
- Figure 72: Middle East Fluids Management System Industry Volume (K Unit), by Product 2024 & 2032
- Figure 73: Middle East Fluids Management System Industry Revenue Share (%), by Product 2024 & 2032
- Figure 74: Middle East Fluids Management System Industry Volume Share (%), by Product 2024 & 2032
- Figure 75: Middle East Fluids Management System Industry Revenue (Million), by Disposables and Accessories 2024 & 2032
- Figure 76: Middle East Fluids Management System Industry Volume (K Unit), by Disposables and Accessories 2024 & 2032
- Figure 77: Middle East Fluids Management System Industry Revenue Share (%), by Disposables and Accessories 2024 & 2032
- Figure 78: Middle East Fluids Management System Industry Volume Share (%), by Disposables and Accessories 2024 & 2032
- Figure 79: Middle East Fluids Management System Industry Revenue (Million), by Application 2024 & 2032
- Figure 80: Middle East Fluids Management System Industry Volume (K Unit), by Application 2024 & 2032
- Figure 81: Middle East Fluids Management System Industry Revenue Share (%), by Application 2024 & 2032
- Figure 82: Middle East Fluids Management System Industry Volume Share (%), by Application 2024 & 2032
- Figure 83: Middle East Fluids Management System Industry Revenue (Million), by Country 2024 & 2032
- Figure 84: Middle East Fluids Management System Industry Volume (K Unit), by Country 2024 & 2032
- Figure 85: Middle East Fluids Management System Industry Revenue Share (%), by Country 2024 & 2032
- Figure 86: Middle East Fluids Management System Industry Volume Share (%), by Country 2024 & 2032
- Figure 87: GCC Fluids Management System Industry Revenue (Million), by Product 2024 & 2032
- Figure 88: GCC Fluids Management System Industry Volume (K Unit), by Product 2024 & 2032
- Figure 89: GCC Fluids Management System Industry Revenue Share (%), by Product 2024 & 2032
- Figure 90: GCC Fluids Management System Industry Volume Share (%), by Product 2024 & 2032
- Figure 91: GCC Fluids Management System Industry Revenue (Million), by Disposables and Accessories 2024 & 2032
- Figure 92: GCC Fluids Management System Industry Volume (K Unit), by Disposables and Accessories 2024 & 2032
- Figure 93: GCC Fluids Management System Industry Revenue Share (%), by Disposables and Accessories 2024 & 2032
- Figure 94: GCC Fluids Management System Industry Volume Share (%), by Disposables and Accessories 2024 & 2032
- Figure 95: GCC Fluids Management System Industry Revenue (Million), by Application 2024 & 2032
- Figure 96: GCC Fluids Management System Industry Volume (K Unit), by Application 2024 & 2032
- Figure 97: GCC Fluids Management System Industry Revenue Share (%), by Application 2024 & 2032
- Figure 98: GCC Fluids Management System Industry Volume Share (%), by Application 2024 & 2032
- Figure 99: GCC Fluids Management System Industry Revenue (Million), by Country 2024 & 2032
- Figure 100: GCC Fluids Management System Industry Volume (K Unit), by Country 2024 & 2032
- Figure 101: GCC Fluids Management System Industry Revenue Share (%), by Country 2024 & 2032
- Figure 102: GCC Fluids Management System Industry Volume Share (%), by Country 2024 & 2032
- Figure 103: South America Fluids Management System Industry Revenue (Million), by Product 2024 & 2032
- Figure 104: South America Fluids Management System Industry Volume (K Unit), by Product 2024 & 2032
- Figure 105: South America Fluids Management System Industry Revenue Share (%), by Product 2024 & 2032
- Figure 106: South America Fluids Management System Industry Volume Share (%), by Product 2024 & 2032
- Figure 107: South America Fluids Management System Industry Revenue (Million), by Disposables and Accessories 2024 & 2032
- Figure 108: South America Fluids Management System Industry Volume (K Unit), by Disposables and Accessories 2024 & 2032
- Figure 109: South America Fluids Management System Industry Revenue Share (%), by Disposables and Accessories 2024 & 2032
- Figure 110: South America Fluids Management System Industry Volume Share (%), by Disposables and Accessories 2024 & 2032
- Figure 111: South America Fluids Management System Industry Revenue (Million), by Application 2024 & 2032
- Figure 112: South America Fluids Management System Industry Volume (K Unit), by Application 2024 & 2032
- Figure 113: South America Fluids Management System Industry Revenue Share (%), by Application 2024 & 2032
- Figure 114: South America Fluids Management System Industry Volume Share (%), by Application 2024 & 2032
- Figure 115: South America Fluids Management System Industry Revenue (Million), by Country 2024 & 2032
- Figure 116: South America Fluids Management System Industry Volume (K Unit), by Country 2024 & 2032
- Figure 117: South America Fluids Management System Industry Revenue Share (%), by Country 2024 & 2032
- Figure 118: South America Fluids Management System Industry Volume Share (%), by Country 2024 & 2032
List of Tables
- Table 1: Global Fluids Management System Industry Revenue Million Forecast, by Region 2019 & 2032
- Table 2: Global Fluids Management System Industry Volume K Unit Forecast, by Region 2019 & 2032
- Table 3: Global Fluids Management System Industry Revenue Million Forecast, by Product 2019 & 2032
- Table 4: Global Fluids Management System Industry Volume K Unit Forecast, by Product 2019 & 2032
- Table 5: Global Fluids Management System Industry Revenue Million Forecast, by Disposables and Accessories 2019 & 2032
- Table 6: Global Fluids Management System Industry Volume K Unit Forecast, by Disposables and Accessories 2019 & 2032
- Table 7: Global Fluids Management System Industry Revenue Million Forecast, by Application 2019 & 2032
- Table 8: Global Fluids Management System Industry Volume K Unit Forecast, by Application 2019 & 2032
- Table 9: Global Fluids Management System Industry Revenue Million Forecast, by Region 2019 & 2032
- Table 10: Global Fluids Management System Industry Volume K Unit Forecast, by Region 2019 & 2032
- Table 11: Global Fluids Management System Industry Revenue Million Forecast, by Country 2019 & 2032
- Table 12: Global Fluids Management System Industry Volume K Unit Forecast, by Country 2019 & 2032
- Table 13: Global Fluids Management System Industry Revenue Million Forecast, by Country 2019 & 2032
- Table 14: Global Fluids Management System Industry Volume K Unit Forecast, by Country 2019 & 2032
- Table 15: Global Fluids Management System Industry Revenue Million Forecast, by Country 2019 & 2032
- Table 16: Global Fluids Management System Industry Volume K Unit Forecast, by Country 2019 & 2032
- Table 17: Global Fluids Management System Industry Revenue Million Forecast, by Country 2019 & 2032
- Table 18: Global Fluids Management System Industry Volume K Unit Forecast, by Country 2019 & 2032
- Table 19: Global Fluids Management System Industry Revenue Million Forecast, by Country 2019 & 2032
- Table 20: Global Fluids Management System Industry Volume K Unit Forecast, by Country 2019 & 2032
- Table 21: Global Fluids Management System Industry Revenue Million Forecast, by Product 2019 & 2032
- Table 22: Global Fluids Management System Industry Volume K Unit Forecast, by Product 2019 & 2032
- Table 23: Global Fluids Management System Industry Revenue Million Forecast, by Disposables and Accessories 2019 & 2032
- Table 24: Global Fluids Management System Industry Volume K Unit Forecast, by Disposables and Accessories 2019 & 2032
- Table 25: Global Fluids Management System Industry Revenue Million Forecast, by Application 2019 & 2032
- Table 26: Global Fluids Management System Industry Volume K Unit Forecast, by Application 2019 & 2032
- Table 27: Global Fluids Management System Industry Revenue Million Forecast, by Country 2019 & 2032
- Table 28: Global Fluids Management System Industry Volume K Unit Forecast, by Country 2019 & 2032
- Table 29: United States Fluids Management System Industry Revenue (Million) Forecast, by Application 2019 & 2032
- Table 30: United States Fluids Management System Industry Volume (K Unit) Forecast, by Application 2019 & 2032
- Table 31: Canada Fluids Management System Industry Revenue (Million) Forecast, by Application 2019 & 2032
- Table 32: Canada Fluids Management System Industry Volume (K Unit) Forecast, by Application 2019 & 2032
- Table 33: Mexico Fluids Management System Industry Revenue (Million) Forecast, by Application 2019 & 2032
- Table 34: Mexico Fluids Management System Industry Volume (K Unit) Forecast, by Application 2019 & 2032
- Table 35: Global Fluids Management System Industry Revenue Million Forecast, by Product 2019 & 2032
- Table 36: Global Fluids Management System Industry Volume K Unit Forecast, by Product 2019 & 2032
- Table 37: Global Fluids Management System Industry Revenue Million Forecast, by Disposables and Accessories 2019 & 2032
- Table 38: Global Fluids Management System Industry Volume K Unit Forecast, by Disposables and Accessories 2019 & 2032
- Table 39: Global Fluids Management System Industry Revenue Million Forecast, by Application 2019 & 2032
- Table 40: Global Fluids Management System Industry Volume K Unit Forecast, by Application 2019 & 2032
- Table 41: Global Fluids Management System Industry Revenue Million Forecast, by Country 2019 & 2032
- Table 42: Global Fluids Management System Industry Volume K Unit Forecast, by Country 2019 & 2032
- Table 43: Germany Fluids Management System Industry Revenue (Million) Forecast, by Application 2019 & 2032
- Table 44: Germany Fluids Management System Industry Volume (K Unit) Forecast, by Application 2019 & 2032
- Table 45: United Kingdom Fluids Management System Industry Revenue (Million) Forecast, by Application 2019 & 2032
- Table 46: United Kingdom Fluids Management System Industry Volume (K Unit) Forecast, by Application 2019 & 2032
- Table 47: France Fluids Management System Industry Revenue (Million) Forecast, by Application 2019 & 2032
- Table 48: France Fluids Management System Industry Volume (K Unit) Forecast, by Application 2019 & 2032
- Table 49: Italy Fluids Management System Industry Revenue (Million) Forecast, by Application 2019 & 2032
- Table 50: Italy Fluids Management System Industry Volume (K Unit) Forecast, by Application 2019 & 2032
- Table 51: Spain Fluids Management System Industry Revenue (Million) Forecast, by Application 2019 & 2032
- Table 52: Spain Fluids Management System Industry Volume (K Unit) Forecast, by Application 2019 & 2032
- Table 53: Rest of Europe Fluids Management System Industry Revenue (Million) Forecast, by Application 2019 & 2032
- Table 54: Rest of Europe Fluids Management System Industry Volume (K Unit) Forecast, by Application 2019 & 2032
- Table 55: Global Fluids Management System Industry Revenue Million Forecast, by Product 2019 & 2032
- Table 56: Global Fluids Management System Industry Volume K Unit Forecast, by Product 2019 & 2032
- Table 57: Global Fluids Management System Industry Revenue Million Forecast, by Disposables and Accessories 2019 & 2032
- Table 58: Global Fluids Management System Industry Volume K Unit Forecast, by Disposables and Accessories 2019 & 2032
- Table 59: Global Fluids Management System Industry Revenue Million Forecast, by Application 2019 & 2032
- Table 60: Global Fluids Management System Industry Volume K Unit Forecast, by Application 2019 & 2032
- Table 61: Global Fluids Management System Industry Revenue Million Forecast, by Country 2019 & 2032
- Table 62: Global Fluids Management System Industry Volume K Unit Forecast, by Country 2019 & 2032
- Table 63: China Fluids Management System Industry Revenue (Million) Forecast, by Application 2019 & 2032
- Table 64: China Fluids Management System Industry Volume (K Unit) Forecast, by Application 2019 & 2032
- Table 65: Japan Fluids Management System Industry Revenue (Million) Forecast, by Application 2019 & 2032
- Table 66: Japan Fluids Management System Industry Volume (K Unit) Forecast, by Application 2019 & 2032
- Table 67: India Fluids Management System Industry Revenue (Million) Forecast, by Application 2019 & 2032
- Table 68: India Fluids Management System Industry Volume (K Unit) Forecast, by Application 2019 & 2032
- Table 69: Australia Fluids Management System Industry Revenue (Million) Forecast, by Application 2019 & 2032
- Table 70: Australia Fluids Management System Industry Volume (K Unit) Forecast, by Application 2019 & 2032
- Table 71: South Korea Fluids Management System Industry Revenue (Million) Forecast, by Application 2019 & 2032
- Table 72: South Korea Fluids Management System Industry Volume (K Unit) Forecast, by Application 2019 & 2032
- Table 73: Rest of Asia Pacific Fluids Management System Industry Revenue (Million) Forecast, by Application 2019 & 2032
- Table 74: Rest of Asia Pacific Fluids Management System Industry Volume (K Unit) Forecast, by Application 2019 & 2032
- Table 75: Global Fluids Management System Industry Revenue Million Forecast, by Product 2019 & 2032
- Table 76: Global Fluids Management System Industry Volume K Unit Forecast, by Product 2019 & 2032
- Table 77: Global Fluids Management System Industry Revenue Million Forecast, by Disposables and Accessories 2019 & 2032
- Table 78: Global Fluids Management System Industry Volume K Unit Forecast, by Disposables and Accessories 2019 & 2032
- Table 79: Global Fluids Management System Industry Revenue Million Forecast, by Application 2019 & 2032
- Table 80: Global Fluids Management System Industry Volume K Unit Forecast, by Application 2019 & 2032
- Table 81: Global Fluids Management System Industry Revenue Million Forecast, by Country 2019 & 2032
- Table 82: Global Fluids Management System Industry Volume K Unit Forecast, by Country 2019 & 2032
- Table 83: Global Fluids Management System Industry Revenue Million Forecast, by Product 2019 & 2032
- Table 84: Global Fluids Management System Industry Volume K Unit Forecast, by Product 2019 & 2032
- Table 85: Global Fluids Management System Industry Revenue Million Forecast, by Disposables and Accessories 2019 & 2032
- Table 86: Global Fluids Management System Industry Volume K Unit Forecast, by Disposables and Accessories 2019 & 2032
- Table 87: Global Fluids Management System Industry Revenue Million Forecast, by Application 2019 & 2032
- Table 88: Global Fluids Management System Industry Volume K Unit Forecast, by Application 2019 & 2032
- Table 89: Global Fluids Management System Industry Revenue Million Forecast, by Country 2019 & 2032
- Table 90: Global Fluids Management System Industry Volume K Unit Forecast, by Country 2019 & 2032
- Table 91: South Africa Fluids Management System Industry Revenue (Million) Forecast, by Application 2019 & 2032
- Table 92: South Africa Fluids Management System Industry Volume (K Unit) Forecast, by Application 2019 & 2032
- Table 93: Rest of Middle East Fluids Management System Industry Revenue (Million) Forecast, by Application 2019 & 2032
- Table 94: Rest of Middle East Fluids Management System Industry Volume (K Unit) Forecast, by Application 2019 & 2032
- Table 95: Global Fluids Management System Industry Revenue Million Forecast, by Product 2019 & 2032
- Table 96: Global Fluids Management System Industry Volume K Unit Forecast, by Product 2019 & 2032
- Table 97: Global Fluids Management System Industry Revenue Million Forecast, by Disposables and Accessories 2019 & 2032
- Table 98: Global Fluids Management System Industry Volume K Unit Forecast, by Disposables and Accessories 2019 & 2032
- Table 99: Global Fluids Management System Industry Revenue Million Forecast, by Application 2019 & 2032
- Table 100: Global Fluids Management System Industry Volume K Unit Forecast, by Application 2019 & 2032
- Table 101: Global Fluids Management System Industry Revenue Million Forecast, by Country 2019 & 2032
- Table 102: Global Fluids Management System Industry Volume K Unit Forecast, by Country 2019 & 2032
- Table 103: Brazil Fluids Management System Industry Revenue (Million) Forecast, by Application 2019 & 2032
- Table 104: Brazil Fluids Management System Industry Volume (K Unit) Forecast, by Application 2019 & 2032
- Table 105: Argentina Fluids Management System Industry Revenue (Million) Forecast, by Application 2019 & 2032
- Table 106: Argentina Fluids Management System Industry Volume (K Unit) Forecast, by Application 2019 & 2032
- Table 107: Rest of South America Fluids Management System Industry Revenue (Million) Forecast, by Application 2019 & 2032
- Table 108: Rest of South America Fluids Management System Industry Volume (K Unit) Forecast, by Application 2019 & 2032
Frequently Asked Questions
1. What is the projected Compound Annual Growth Rate (CAGR) of the Fluids Management System Industry?
The projected CAGR is approximately 13.58%.
2. Which companies are prominent players in the Fluids Management System Industry?
Key companies in the market include Becton Dickinson and Company, Smith & Nephew PLC, Hologic Inc, Cardinal Health Inc, Medtronic PLC, Stryker Corporation, Johnson & Johnson, B Braun Melsungen AG, Smiths Medical Inc, Baxter International Inc.
3. What are the main segments of the Fluids Management System Industry?
The market segments include Product, Disposables and Accessories, Application.
4. Can you provide details about the market size?
The market size is estimated to be USD 12.41 Million as of 2022.
5. What are some drivers contributing to market growth?
Rise in the Number of Minimally-invasive Surgery Procedures; Rising Burden of Chronic Diseases; Technological Advancements.
6. What are the notable trends driving market growth?
Cardiology Segment is Expected to Witness Growth Over the Forecast Period.
7. Are there any restraints impacting market growth?
Lack of Skilled Labor; Expensive Surgical Procedures.
8. Can you provide examples of recent developments in the market?
In April 2022, Transit Scientific announced the FDA clearance of its XO Cross Support catheter platform for coronary use. The platform is designed to guide and support the guidewire during access to the peripheral or coronary vasculature, allow for wire exchange, and provide guidance for the administration of saline or diagnostic contrast agents.
9. What pricing options are available for accessing the report?
Pricing options include single-user, multi-user, and enterprise licenses priced at USD 4750, USD 5250, and USD 8750 respectively.
10. Is the market size provided in terms of value or volume?
The market size is provided in terms of value, measured in Million and volume, measured in K Unit.
11. Are there any specific market keywords associated with the report?
Yes, the market keyword associated with the report is "Fluids Management System Industry," which aids in identifying and referencing the specific market segment covered.
12. How do I determine which pricing option suits my needs best?
The pricing options vary based on user requirements and access needs. Individual users may opt for single-user licenses, while businesses requiring broader access may choose multi-user or enterprise licenses for cost-effective access to the report.
13. Are there any additional resources or data provided in the Fluids Management System Industry report?
While the report offers comprehensive insights, it's advisable to review the specific contents or supplementary materials provided to ascertain if additional resources or data are available.
14. How can I stay updated on further developments or reports in the Fluids Management System Industry?
To stay informed about further developments, trends, and reports in the Fluids Management System Industry, consider subscribing to industry newsletters, following relevant companies and organizations, or regularly checking reputable industry news sources and publications.
Methodology
Step 1 - Identification of Relevant Samples Size from Population Database


Step 2 - Approaches for Defining Global Market Size (Value, Volume* & Price*)

Note*: In applicable scenarios
Step 3 - Data Sources
Primary Research
- Web Analytics
- Survey Reports
- Research Institute
- Latest Research Reports
- Opinion Leaders
Secondary Research
- Annual Reports
- White Paper
- Latest Press Release
- Industry Association
- Paid Database
- Investor Presentations

Step 4 - Data Triangulation
Involves using different sources of information in order to increase the validity of a study
These sources are likely to be stakeholders in a program - participants, other researchers, program staff, other community members, and so on.
Then we put all data in single framework & apply various statistical tools to find out the dynamic on the market.
During the analysis stage, feedback from the stakeholder groups would be compared to determine areas of agreement as well as areas of divergence
