

Key Insights
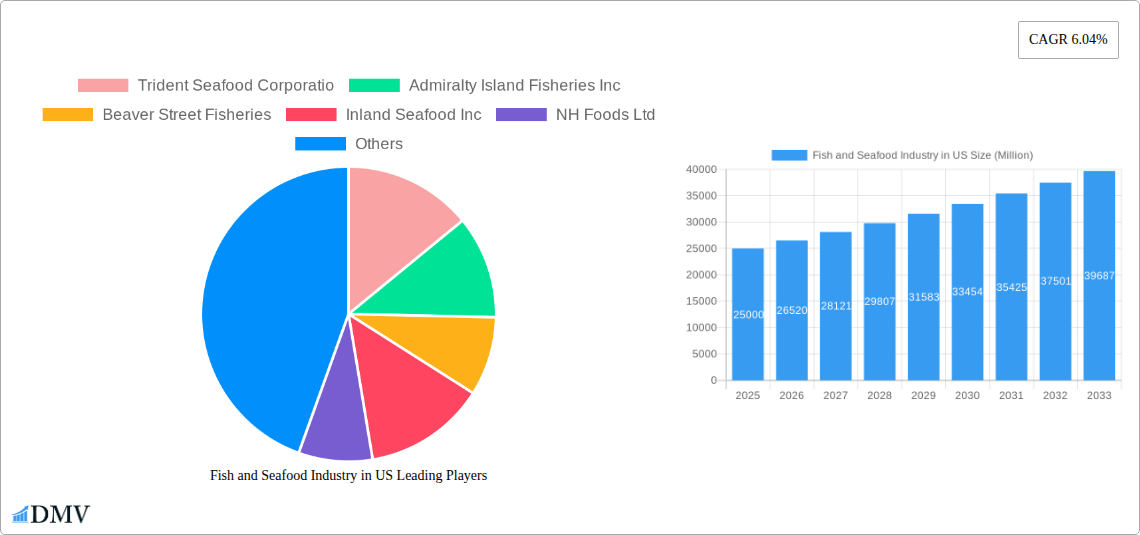
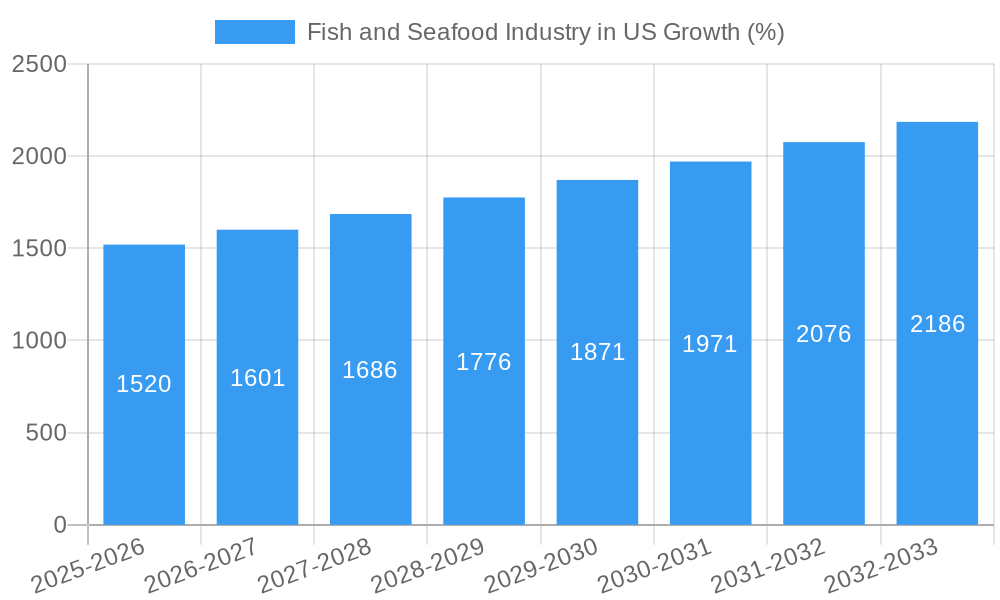
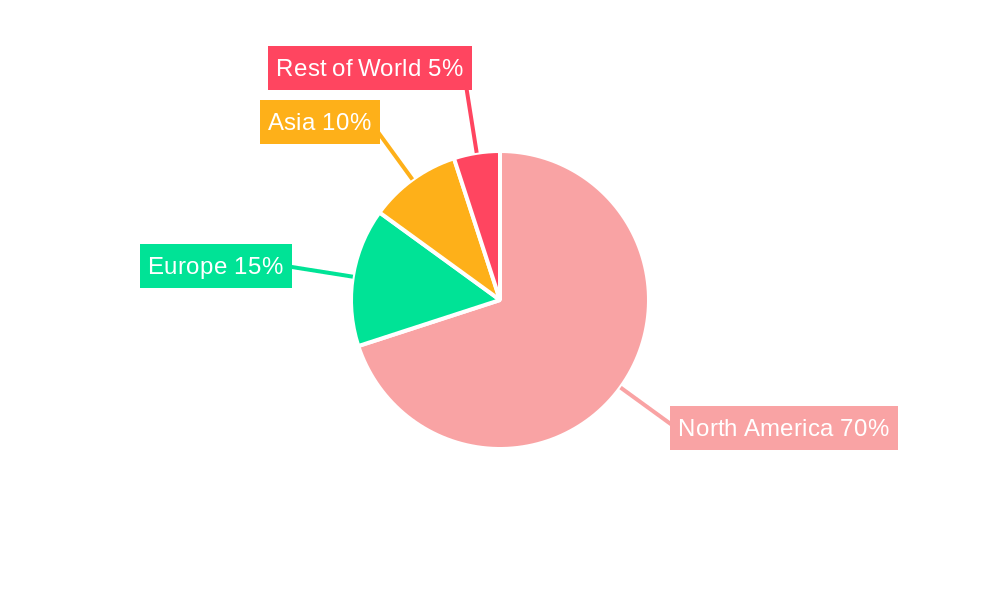
The US fish and seafood market, valued at approximately $25 billion in 2025, demonstrates robust growth potential, projected to expand at a compound annual growth rate (CAGR) of 6.04% from 2025 to 2033. This expansion is fueled by several key drivers. Increasing consumer awareness of the health benefits associated with seafood consumption, particularly its high protein and omega-3 fatty acid content, is a major factor. Furthermore, evolving culinary trends showcasing diverse seafood preparations and the rising popularity of seafood in restaurants and food service establishments are significantly boosting demand. The growing preference for convenient and ready-to-eat options, such as frozen and processed seafood, also contributes to market growth. While the market faces challenges like price fluctuations due to supply chain disruptions and sustainability concerns regarding overfishing, innovative processing techniques, sustainable aquaculture practices, and increased traceability efforts are mitigating these restraints. The market is segmented across various types (fish, shrimp, other seafood), forms (canned, fresh/chilled, frozen, processed), and distribution channels (off-trade, on-trade), offering opportunities for specialized products and targeted marketing strategies. The dominance of major players like Trident Seafood Corporation and High Liner Foods Inc. highlights the market's consolidated nature, although smaller, regional players continue to find success with niche offerings. The North American region, particularly the US, represents a significant market share, driven by high seafood consumption levels and robust economic conditions.
The forecast period (2025-2033) anticipates continued growth, with specific segments experiencing varying rates of expansion. Frozen seafood is expected to maintain strong growth due to its extended shelf life and convenience. The processed seafood segment is also poised for expansion driven by innovation and the development of value-added products. Growth in the on-trade channel will be partially influenced by the recovery of the food service sector post-pandemic. While the overall market expansion is predicted to be positive, factors such as global economic conditions and geopolitical events could influence the pace of growth. Continuous monitoring of these elements is crucial for informed strategic decision-making within the industry.
Fish and Seafood Industry in US: A Comprehensive Market Report (2019-2033)
This insightful report provides a detailed analysis of the US fish and seafood industry, offering a comprehensive overview of market trends, key players, and future growth prospects. The study period covers 2019-2033, with 2025 as the base and estimated year. We delve deep into market segmentation, analyzing various types (Fish, Shrimp, Other Seafood), forms (Canned, Fresh/Chilled, Frozen, Processed), and distribution channels (Off-Trade, On-Trade). The report is essential for stakeholders seeking to understand the dynamics of this dynamic market and capitalize on emerging opportunities. The total market value is estimated at xx Million USD in 2025, projected to reach xx Million USD by 2033.
Fish and Seafood Industry in US Market Composition & Trends
This section evaluates the competitive landscape, identifying key trends and drivers shaping the US fish and seafood market. We analyze market concentration, highlighting the market share distribution amongst major players like Trident Seafood Corporation, Admiralty Island Fisheries Inc, and Inland Seafood Inc. The report explores innovation catalysts, such as sustainable fishing practices and technological advancements in processing and preservation. We also examine the regulatory environment, including fishing quotas and food safety regulations. Substitute products, evolving consumer preferences, and the impact of M&A activities (with deal values estimated at xx Million USD in the historical period) are critically analyzed. End-user profiles are segmented across retail, food service, and industrial applications.
- Market Concentration: High concentration in certain segments, with top 5 players holding approximately xx% market share in 2025.
- Innovation Catalysts: Focus on sustainable sourcing, traceability technologies, and value-added processed products.
- Regulatory Landscape: Stringent regulations impacting sourcing, processing, and labeling.
- Substitute Products: Competition from plant-based seafood alternatives.
- M&A Activities: Significant consolidation activity observed, particularly in the frozen seafood segment.
Fish and Seafood Industry in US Industry Evolution
This section traces the evolution of the US fish and seafood industry over the historical period (2019-2024) and projects future trajectories (2025-2033). We examine market growth trajectories, with a Compound Annual Growth Rate (CAGR) estimated at xx% during the forecast period. Technological advancements, such as improved freezing and preservation techniques and automation in processing, are analyzed for their impact on efficiency and product quality. Shifting consumer preferences, including growing demand for sustainable and healthy seafood options, are also explored. The increasing adoption of traceability systems and eco-labeling is detailed, along with data on growth rates and consumer adoption metrics.
Leading Regions, Countries, or Segments in Fish and Seafood Industry in US
This section identifies the leading segments within the US fish and seafood market, focusing on key drivers and dominance factors. Detailed analysis will explore the leading segments across type, form, and distribution channel.
- Type: Frozen seafood holds the largest market share, driven by extended shelf life and convenience.
- Form: Frozen and canned seafood dominate, reflecting consumer demand and distribution efficiency.
- Distribution Channel: Off-Trade (retail) commands a significant share compared to On-Trade (food service).
Key Drivers:
- Investment Trends: Significant investments in processing facilities and sustainable fishing practices.
- Regulatory Support: Government initiatives promoting sustainable fisheries and aquaculture.
Fish and Seafood Industry in US Product Innovations
This section highlights recent product innovations, focusing on unique selling propositions (USPs) and technological advancements. The emphasis is on new product development, value-added processing techniques, and the introduction of novel seafood products to meet evolving consumer demands. Examples include ready-to-eat meals, pre-portioned seafood for individual consumption, and sustainable seafood options, all with associated performance metrics.
Propelling Factors for Fish and Seafood Industry in US Growth
Key growth drivers are identified, encompassing technological advancements (e.g., improved processing and packaging technologies), economic factors (e.g., rising disposable incomes and changing dietary habits), and regulatory influences (e.g., stricter food safety standards). These factors contribute to the expansion of the overall market and specific segments.
Obstacles in the Fish and Seafood Industry in US Market
This section addresses challenges and restraints impacting market growth, such as regulatory hurdles (e.g., complex import/export regulations, stringent environmental standards), supply chain disruptions (e.g., impacts of climate change and geopolitical events), and intense competitive pressure (e.g., from imported seafood and substitute products). We quantify their impact in terms of lost revenue or market share.
Future Opportunities in Fish and Seafood Industry in US
This section highlights promising future opportunities, focusing on emerging markets (e.g., growing demand for premium seafood products), new technologies (e.g., aquaculture innovation, precision farming), and evolving consumer trends (e.g., preference for sustainable and ethically sourced seafood).
Major Players in the Fish and Seafood Industry in US Ecosystem
- Trident Seafood Corporation
- Admiralty Island Fisheries Inc
- Beaver Street Fisheries
- Inland Seafood Inc
- NH Foods Ltd
- High Liner Foods Inc
- Sysco Corporation
- The Kraft Heinz Company
- Thai Union Group PCL
- Mowi ASA
Key Developments in Fish and Seafood Industry in US Industry
- January 2023: Inland Seafood acquired Lonestar Seafood, expanding its presence in the western US market.
- April 2023: Inland Seafood invested USD 4 Million in a new facility in Jefferson Parish, Louisiana, creating 55 jobs.
- May 2023: Trident Seafood Corporation launched a new Prized Fish product range in collaboration with Copper River Prince William Sound Marketing Association.
Strategic Fish and Seafood Industry in US Market Forecast
The US fish and seafood industry is poised for continued growth, driven by factors such as rising consumer demand for healthy protein sources, increasing focus on sustainable seafood practices, and innovative product development. Emerging technologies and market trends suggest promising avenues for expansion, particularly in value-added products and premium seafood segments. This presents substantial opportunities for industry players to capitalize on future market potential.
Fish and Seafood Industry in US Segmentation
-
1. Type
- 1.1. Fish
- 1.2. Shrimp
- 1.3. Other Seafood
-
2. Form
- 2.1. Canned
- 2.2. Fresh / Chilled
- 2.3. Frozen
- 2.4. Processed
-
3. Distribution Channel
-
3.1. Off-Trade
- 3.1.1. Convenience Stores
- 3.1.2. Online Channel
- 3.1.3. Supermarkets and Hypermarkets
- 3.1.4. Others
- 3.2. On-Trade
-
3.1. Off-Trade
Fish and Seafood Industry in US Segmentation By Geography
-
1. North America
- 1.1. United States
- 1.2. Canada
- 1.3. Mexico
-
2. South America
- 2.1. Brazil
- 2.2. Argentina
- 2.3. Rest of South America
-
3. Europe
- 3.1. United Kingdom
- 3.2. Germany
- 3.3. France
- 3.4. Italy
- 3.5. Spain
- 3.6. Russia
- 3.7. Benelux
- 3.8. Nordics
- 3.9. Rest of Europe
-
4. Middle East & Africa
- 4.1. Turkey
- 4.2. Israel
- 4.3. GCC
- 4.4. North Africa
- 4.5. South Africa
- 4.6. Rest of Middle East & Africa
-
5. Asia Pacific
- 5.1. China
- 5.2. India
- 5.3. Japan
- 5.4. South Korea
- 5.5. ASEAN
- 5.6. Oceania
- 5.7. Rest of Asia Pacific
Fish and Seafood Industry in US REPORT HIGHLIGHTS
| Aspects | Details |
|---|---|
| Study Period | 2019-2033 |
| Base Year | 2024 |
| Estimated Year | 2025 |
| Forecast Period | 2025-2033 |
| Historical Period | 2019-2024 |
| Growth Rate | CAGR of 6.04% from 2019-2033 |
| Segmentation |
|
Table of Contents
- 1. Introduction
- 1.1. Research Scope
- 1.2. Market Segmentation
- 1.3. Research Methodology
- 1.4. Definitions and Assumptions
- 2. Executive Summary
- 2.1. Introduction
- 3. Market Dynamics
- 3.1. Introduction
- 3.2. Market Drivers
- 3.2.1. Increasing Focus on Maintaining Health and Well-Being; Launching Supplements For Specific Purposes and Targeted Population
- 3.3. Market Restrains
- 3.3.1. Supplement Consumption and Their Side-effects; Inclination Towards Substitute Products
- 3.4. Market Trends
- 3.4.1. OTHER KEY INDUSTRY TRENDS COVERED IN THE REPORT
- 4. Market Factor Analysis
- 4.1. Porters Five Forces
- 4.2. Supply/Value Chain
- 4.3. PESTEL analysis
- 4.4. Market Entropy
- 4.5. Patent/Trademark Analysis
- 5. Global Fish and Seafood Industry in US Analysis, Insights and Forecast, 2019-2031
- 5.1. Market Analysis, Insights and Forecast - by Type
- 5.1.1. Fish
- 5.1.2. Shrimp
- 5.1.3. Other Seafood
- 5.2. Market Analysis, Insights and Forecast - by Form
- 5.2.1. Canned
- 5.2.2. Fresh / Chilled
- 5.2.3. Frozen
- 5.2.4. Processed
- 5.3. Market Analysis, Insights and Forecast - by Distribution Channel
- 5.3.1. Off-Trade
- 5.3.1.1. Convenience Stores
- 5.3.1.2. Online Channel
- 5.3.1.3. Supermarkets and Hypermarkets
- 5.3.1.4. Others
- 5.3.2. On-Trade
- 5.3.1. Off-Trade
- 5.4. Market Analysis, Insights and Forecast - by Region
- 5.4.1. North America
- 5.4.2. South America
- 5.4.3. Europe
- 5.4.4. Middle East & Africa
- 5.4.5. Asia Pacific
- 5.1. Market Analysis, Insights and Forecast - by Type
- 6. North America Fish and Seafood Industry in US Analysis, Insights and Forecast, 2019-2031
- 6.1. Market Analysis, Insights and Forecast - by Type
- 6.1.1. Fish
- 6.1.2. Shrimp
- 6.1.3. Other Seafood
- 6.2. Market Analysis, Insights and Forecast - by Form
- 6.2.1. Canned
- 6.2.2. Fresh / Chilled
- 6.2.3. Frozen
- 6.2.4. Processed
- 6.3. Market Analysis, Insights and Forecast - by Distribution Channel
- 6.3.1. Off-Trade
- 6.3.1.1. Convenience Stores
- 6.3.1.2. Online Channel
- 6.3.1.3. Supermarkets and Hypermarkets
- 6.3.1.4. Others
- 6.3.2. On-Trade
- 6.3.1. Off-Trade
- 6.1. Market Analysis, Insights and Forecast - by Type
- 7. South America Fish and Seafood Industry in US Analysis, Insights and Forecast, 2019-2031
- 7.1. Market Analysis, Insights and Forecast - by Type
- 7.1.1. Fish
- 7.1.2. Shrimp
- 7.1.3. Other Seafood
- 7.2. Market Analysis, Insights and Forecast - by Form
- 7.2.1. Canned
- 7.2.2. Fresh / Chilled
- 7.2.3. Frozen
- 7.2.4. Processed
- 7.3. Market Analysis, Insights and Forecast - by Distribution Channel
- 7.3.1. Off-Trade
- 7.3.1.1. Convenience Stores
- 7.3.1.2. Online Channel
- 7.3.1.3. Supermarkets and Hypermarkets
- 7.3.1.4. Others
- 7.3.2. On-Trade
- 7.3.1. Off-Trade
- 7.1. Market Analysis, Insights and Forecast - by Type
- 8. Europe Fish and Seafood Industry in US Analysis, Insights and Forecast, 2019-2031
- 8.1. Market Analysis, Insights and Forecast - by Type
- 8.1.1. Fish
- 8.1.2. Shrimp
- 8.1.3. Other Seafood
- 8.2. Market Analysis, Insights and Forecast - by Form
- 8.2.1. Canned
- 8.2.2. Fresh / Chilled
- 8.2.3. Frozen
- 8.2.4. Processed
- 8.3. Market Analysis, Insights and Forecast - by Distribution Channel
- 8.3.1. Off-Trade
- 8.3.1.1. Convenience Stores
- 8.3.1.2. Online Channel
- 8.3.1.3. Supermarkets and Hypermarkets
- 8.3.1.4. Others
- 8.3.2. On-Trade
- 8.3.1. Off-Trade
- 8.1. Market Analysis, Insights and Forecast - by Type
- 9. Middle East & Africa Fish and Seafood Industry in US Analysis, Insights and Forecast, 2019-2031
- 9.1. Market Analysis, Insights and Forecast - by Type
- 9.1.1. Fish
- 9.1.2. Shrimp
- 9.1.3. Other Seafood
- 9.2. Market Analysis, Insights and Forecast - by Form
- 9.2.1. Canned
- 9.2.2. Fresh / Chilled
- 9.2.3. Frozen
- 9.2.4. Processed
- 9.3. Market Analysis, Insights and Forecast - by Distribution Channel
- 9.3.1. Off-Trade
- 9.3.1.1. Convenience Stores
- 9.3.1.2. Online Channel
- 9.3.1.3. Supermarkets and Hypermarkets
- 9.3.1.4. Others
- 9.3.2. On-Trade
- 9.3.1. Off-Trade
- 9.1. Market Analysis, Insights and Forecast - by Type
- 10. Asia Pacific Fish and Seafood Industry in US Analysis, Insights and Forecast, 2019-2031
- 10.1. Market Analysis, Insights and Forecast - by Type
- 10.1.1. Fish
- 10.1.2. Shrimp
- 10.1.3. Other Seafood
- 10.2. Market Analysis, Insights and Forecast - by Form
- 10.2.1. Canned
- 10.2.2. Fresh / Chilled
- 10.2.3. Frozen
- 10.2.4. Processed
- 10.3. Market Analysis, Insights and Forecast - by Distribution Channel
- 10.3.1. Off-Trade
- 10.3.1.1. Convenience Stores
- 10.3.1.2. Online Channel
- 10.3.1.3. Supermarkets and Hypermarkets
- 10.3.1.4. Others
- 10.3.2. On-Trade
- 10.3.1. Off-Trade
- 10.1. Market Analysis, Insights and Forecast - by Type
- 11. United States Fish and Seafood Industry in US Analysis, Insights and Forecast, 2019-2031
- 12. Canada Fish and Seafood Industry in US Analysis, Insights and Forecast, 2019-2031
- 13. Mexico Fish and Seafood Industry in US Analysis, Insights and Forecast, 2019-2031
- 14. Rest of North America Fish and Seafood Industry in US Analysis, Insights and Forecast, 2019-2031
- 15. Competitive Analysis
- 15.1. Global Market Share Analysis 2024
- 15.2. Company Profiles
- 15.2.1 Trident Seafood Corporatio
- 15.2.1.1. Overview
- 15.2.1.2. Products
- 15.2.1.3. SWOT Analysis
- 15.2.1.4. Recent Developments
- 15.2.1.5. Financials (Based on Availability)
- 15.2.2 Admiralty Island Fisheries Inc
- 15.2.2.1. Overview
- 15.2.2.2. Products
- 15.2.2.3. SWOT Analysis
- 15.2.2.4. Recent Developments
- 15.2.2.5. Financials (Based on Availability)
- 15.2.3 Beaver Street Fisheries
- 15.2.3.1. Overview
- 15.2.3.2. Products
- 15.2.3.3. SWOT Analysis
- 15.2.3.4. Recent Developments
- 15.2.3.5. Financials (Based on Availability)
- 15.2.4 Inland Seafood Inc
- 15.2.4.1. Overview
- 15.2.4.2. Products
- 15.2.4.3. SWOT Analysis
- 15.2.4.4. Recent Developments
- 15.2.4.5. Financials (Based on Availability)
- 15.2.5 NH Foods Ltd
- 15.2.5.1. Overview
- 15.2.5.2. Products
- 15.2.5.3. SWOT Analysis
- 15.2.5.4. Recent Developments
- 15.2.5.5. Financials (Based on Availability)
- 15.2.6 High Liner Foods Inc
- 15.2.6.1. Overview
- 15.2.6.2. Products
- 15.2.6.3. SWOT Analysis
- 15.2.6.4. Recent Developments
- 15.2.6.5. Financials (Based on Availability)
- 15.2.7 Sysco Corporation
- 15.2.7.1. Overview
- 15.2.7.2. Products
- 15.2.7.3. SWOT Analysis
- 15.2.7.4. Recent Developments
- 15.2.7.5. Financials (Based on Availability)
- 15.2.8 The Kraft Heinz Company
- 15.2.8.1. Overview
- 15.2.8.2. Products
- 15.2.8.3. SWOT Analysis
- 15.2.8.4. Recent Developments
- 15.2.8.5. Financials (Based on Availability)
- 15.2.9 Thai Union Group PCL
- 15.2.9.1. Overview
- 15.2.9.2. Products
- 15.2.9.3. SWOT Analysis
- 15.2.9.4. Recent Developments
- 15.2.9.5. Financials (Based on Availability)
- 15.2.10 Mowi ASA
- 15.2.10.1. Overview
- 15.2.10.2. Products
- 15.2.10.3. SWOT Analysis
- 15.2.10.4. Recent Developments
- 15.2.10.5. Financials (Based on Availability)
- 15.2.1 Trident Seafood Corporatio
List of Figures
- Figure 1: Global Fish and Seafood Industry in US Revenue Breakdown (Million, %) by Region 2024 & 2032
- Figure 2: North America Fish and Seafood Industry in US Revenue (Million), by Country 2024 & 2032
- Figure 3: North America Fish and Seafood Industry in US Revenue Share (%), by Country 2024 & 2032
- Figure 4: North America Fish and Seafood Industry in US Revenue (Million), by Type 2024 & 2032
- Figure 5: North America Fish and Seafood Industry in US Revenue Share (%), by Type 2024 & 2032
- Figure 6: North America Fish and Seafood Industry in US Revenue (Million), by Form 2024 & 2032
- Figure 7: North America Fish and Seafood Industry in US Revenue Share (%), by Form 2024 & 2032
- Figure 8: North America Fish and Seafood Industry in US Revenue (Million), by Distribution Channel 2024 & 2032
- Figure 9: North America Fish and Seafood Industry in US Revenue Share (%), by Distribution Channel 2024 & 2032
- Figure 10: North America Fish and Seafood Industry in US Revenue (Million), by Country 2024 & 2032
- Figure 11: North America Fish and Seafood Industry in US Revenue Share (%), by Country 2024 & 2032
- Figure 12: South America Fish and Seafood Industry in US Revenue (Million), by Type 2024 & 2032
- Figure 13: South America Fish and Seafood Industry in US Revenue Share (%), by Type 2024 & 2032
- Figure 14: South America Fish and Seafood Industry in US Revenue (Million), by Form 2024 & 2032
- Figure 15: South America Fish and Seafood Industry in US Revenue Share (%), by Form 2024 & 2032
- Figure 16: South America Fish and Seafood Industry in US Revenue (Million), by Distribution Channel 2024 & 2032
- Figure 17: South America Fish and Seafood Industry in US Revenue Share (%), by Distribution Channel 2024 & 2032
- Figure 18: South America Fish and Seafood Industry in US Revenue (Million), by Country 2024 & 2032
- Figure 19: South America Fish and Seafood Industry in US Revenue Share (%), by Country 2024 & 2032
- Figure 20: Europe Fish and Seafood Industry in US Revenue (Million), by Type 2024 & 2032
- Figure 21: Europe Fish and Seafood Industry in US Revenue Share (%), by Type 2024 & 2032
- Figure 22: Europe Fish and Seafood Industry in US Revenue (Million), by Form 2024 & 2032
- Figure 23: Europe Fish and Seafood Industry in US Revenue Share (%), by Form 2024 & 2032
- Figure 24: Europe Fish and Seafood Industry in US Revenue (Million), by Distribution Channel 2024 & 2032
- Figure 25: Europe Fish and Seafood Industry in US Revenue Share (%), by Distribution Channel 2024 & 2032
- Figure 26: Europe Fish and Seafood Industry in US Revenue (Million), by Country 2024 & 2032
- Figure 27: Europe Fish and Seafood Industry in US Revenue Share (%), by Country 2024 & 2032
- Figure 28: Middle East & Africa Fish and Seafood Industry in US Revenue (Million), by Type 2024 & 2032
- Figure 29: Middle East & Africa Fish and Seafood Industry in US Revenue Share (%), by Type 2024 & 2032
- Figure 30: Middle East & Africa Fish and Seafood Industry in US Revenue (Million), by Form 2024 & 2032
- Figure 31: Middle East & Africa Fish and Seafood Industry in US Revenue Share (%), by Form 2024 & 2032
- Figure 32: Middle East & Africa Fish and Seafood Industry in US Revenue (Million), by Distribution Channel 2024 & 2032
- Figure 33: Middle East & Africa Fish and Seafood Industry in US Revenue Share (%), by Distribution Channel 2024 & 2032
- Figure 34: Middle East & Africa Fish and Seafood Industry in US Revenue (Million), by Country 2024 & 2032
- Figure 35: Middle East & Africa Fish and Seafood Industry in US Revenue Share (%), by Country 2024 & 2032
- Figure 36: Asia Pacific Fish and Seafood Industry in US Revenue (Million), by Type 2024 & 2032
- Figure 37: Asia Pacific Fish and Seafood Industry in US Revenue Share (%), by Type 2024 & 2032
- Figure 38: Asia Pacific Fish and Seafood Industry in US Revenue (Million), by Form 2024 & 2032
- Figure 39: Asia Pacific Fish and Seafood Industry in US Revenue Share (%), by Form 2024 & 2032
- Figure 40: Asia Pacific Fish and Seafood Industry in US Revenue (Million), by Distribution Channel 2024 & 2032
- Figure 41: Asia Pacific Fish and Seafood Industry in US Revenue Share (%), by Distribution Channel 2024 & 2032
- Figure 42: Asia Pacific Fish and Seafood Industry in US Revenue (Million), by Country 2024 & 2032
- Figure 43: Asia Pacific Fish and Seafood Industry in US Revenue Share (%), by Country 2024 & 2032
List of Tables
- Table 1: Global Fish and Seafood Industry in US Revenue Million Forecast, by Region 2019 & 2032
- Table 2: Global Fish and Seafood Industry in US Revenue Million Forecast, by Type 2019 & 2032
- Table 3: Global Fish and Seafood Industry in US Revenue Million Forecast, by Form 2019 & 2032
- Table 4: Global Fish and Seafood Industry in US Revenue Million Forecast, by Distribution Channel 2019 & 2032
- Table 5: Global Fish and Seafood Industry in US Revenue Million Forecast, by Region 2019 & 2032
- Table 6: Global Fish and Seafood Industry in US Revenue Million Forecast, by Country 2019 & 2032
- Table 7: United States Fish and Seafood Industry in US Revenue (Million) Forecast, by Application 2019 & 2032
- Table 8: Canada Fish and Seafood Industry in US Revenue (Million) Forecast, by Application 2019 & 2032
- Table 9: Mexico Fish and Seafood Industry in US Revenue (Million) Forecast, by Application 2019 & 2032
- Table 10: Rest of North America Fish and Seafood Industry in US Revenue (Million) Forecast, by Application 2019 & 2032
- Table 11: Global Fish and Seafood Industry in US Revenue Million Forecast, by Type 2019 & 2032
- Table 12: Global Fish and Seafood Industry in US Revenue Million Forecast, by Form 2019 & 2032
- Table 13: Global Fish and Seafood Industry in US Revenue Million Forecast, by Distribution Channel 2019 & 2032
- Table 14: Global Fish and Seafood Industry in US Revenue Million Forecast, by Country 2019 & 2032
- Table 15: United States Fish and Seafood Industry in US Revenue (Million) Forecast, by Application 2019 & 2032
- Table 16: Canada Fish and Seafood Industry in US Revenue (Million) Forecast, by Application 2019 & 2032
- Table 17: Mexico Fish and Seafood Industry in US Revenue (Million) Forecast, by Application 2019 & 2032
- Table 18: Global Fish and Seafood Industry in US Revenue Million Forecast, by Type 2019 & 2032
- Table 19: Global Fish and Seafood Industry in US Revenue Million Forecast, by Form 2019 & 2032
- Table 20: Global Fish and Seafood Industry in US Revenue Million Forecast, by Distribution Channel 2019 & 2032
- Table 21: Global Fish and Seafood Industry in US Revenue Million Forecast, by Country 2019 & 2032
- Table 22: Brazil Fish and Seafood Industry in US Revenue (Million) Forecast, by Application 2019 & 2032
- Table 23: Argentina Fish and Seafood Industry in US Revenue (Million) Forecast, by Application 2019 & 2032
- Table 24: Rest of South America Fish and Seafood Industry in US Revenue (Million) Forecast, by Application 2019 & 2032
- Table 25: Global Fish and Seafood Industry in US Revenue Million Forecast, by Type 2019 & 2032
- Table 26: Global Fish and Seafood Industry in US Revenue Million Forecast, by Form 2019 & 2032
- Table 27: Global Fish and Seafood Industry in US Revenue Million Forecast, by Distribution Channel 2019 & 2032
- Table 28: Global Fish and Seafood Industry in US Revenue Million Forecast, by Country 2019 & 2032
- Table 29: United Kingdom Fish and Seafood Industry in US Revenue (Million) Forecast, by Application 2019 & 2032
- Table 30: Germany Fish and Seafood Industry in US Revenue (Million) Forecast, by Application 2019 & 2032
- Table 31: France Fish and Seafood Industry in US Revenue (Million) Forecast, by Application 2019 & 2032
- Table 32: Italy Fish and Seafood Industry in US Revenue (Million) Forecast, by Application 2019 & 2032
- Table 33: Spain Fish and Seafood Industry in US Revenue (Million) Forecast, by Application 2019 & 2032
- Table 34: Russia Fish and Seafood Industry in US Revenue (Million) Forecast, by Application 2019 & 2032
- Table 35: Benelux Fish and Seafood Industry in US Revenue (Million) Forecast, by Application 2019 & 2032
- Table 36: Nordics Fish and Seafood Industry in US Revenue (Million) Forecast, by Application 2019 & 2032
- Table 37: Rest of Europe Fish and Seafood Industry in US Revenue (Million) Forecast, by Application 2019 & 2032
- Table 38: Global Fish and Seafood Industry in US Revenue Million Forecast, by Type 2019 & 2032
- Table 39: Global Fish and Seafood Industry in US Revenue Million Forecast, by Form 2019 & 2032
- Table 40: Global Fish and Seafood Industry in US Revenue Million Forecast, by Distribution Channel 2019 & 2032
- Table 41: Global Fish and Seafood Industry in US Revenue Million Forecast, by Country 2019 & 2032
- Table 42: Turkey Fish and Seafood Industry in US Revenue (Million) Forecast, by Application 2019 & 2032
- Table 43: Israel Fish and Seafood Industry in US Revenue (Million) Forecast, by Application 2019 & 2032
- Table 44: GCC Fish and Seafood Industry in US Revenue (Million) Forecast, by Application 2019 & 2032
- Table 45: North Africa Fish and Seafood Industry in US Revenue (Million) Forecast, by Application 2019 & 2032
- Table 46: South Africa Fish and Seafood Industry in US Revenue (Million) Forecast, by Application 2019 & 2032
- Table 47: Rest of Middle East & Africa Fish and Seafood Industry in US Revenue (Million) Forecast, by Application 2019 & 2032
- Table 48: Global Fish and Seafood Industry in US Revenue Million Forecast, by Type 2019 & 2032
- Table 49: Global Fish and Seafood Industry in US Revenue Million Forecast, by Form 2019 & 2032
- Table 50: Global Fish and Seafood Industry in US Revenue Million Forecast, by Distribution Channel 2019 & 2032
- Table 51: Global Fish and Seafood Industry in US Revenue Million Forecast, by Country 2019 & 2032
- Table 52: China Fish and Seafood Industry in US Revenue (Million) Forecast, by Application 2019 & 2032
- Table 53: India Fish and Seafood Industry in US Revenue (Million) Forecast, by Application 2019 & 2032
- Table 54: Japan Fish and Seafood Industry in US Revenue (Million) Forecast, by Application 2019 & 2032
- Table 55: South Korea Fish and Seafood Industry in US Revenue (Million) Forecast, by Application 2019 & 2032
- Table 56: ASEAN Fish and Seafood Industry in US Revenue (Million) Forecast, by Application 2019 & 2032
- Table 57: Oceania Fish and Seafood Industry in US Revenue (Million) Forecast, by Application 2019 & 2032
- Table 58: Rest of Asia Pacific Fish and Seafood Industry in US Revenue (Million) Forecast, by Application 2019 & 2032
Frequently Asked Questions
1. What is the projected Compound Annual Growth Rate (CAGR) of the Fish and Seafood Industry in US?
The projected CAGR is approximately 6.04%.
2. Which companies are prominent players in the Fish and Seafood Industry in US?
Key companies in the market include Trident Seafood Corporatio, Admiralty Island Fisheries Inc, Beaver Street Fisheries, Inland Seafood Inc, NH Foods Ltd, High Liner Foods Inc, Sysco Corporation, The Kraft Heinz Company, Thai Union Group PCL, Mowi ASA.
3. What are the main segments of the Fish and Seafood Industry in US?
The market segments include Type, Form, Distribution Channel.
4. Can you provide details about the market size?
The market size is estimated to be USD XX Million as of 2022.
5. What are some drivers contributing to market growth?
Increasing Focus on Maintaining Health and Well-Being; Launching Supplements For Specific Purposes and Targeted Population.
6. What are the notable trends driving market growth?
OTHER KEY INDUSTRY TRENDS COVERED IN THE REPORT.
7. Are there any restraints impacting market growth?
Supplement Consumption and Their Side-effects; Inclination Towards Substitute Products.
8. Can you provide examples of recent developments in the market?
May 2023: Trident Seafood Corporation has collaborated with Copper River Prince William Sound Marketing Association to introduce new Prized Fish product range in the United Staes Market.April 2023: Inland Seafood opened a new facility of its own in Jefferson Parish. They invested approximately USD 4 million in order to purchase and renovate a 14,000-square-foot facility in Elmwood, bringing 55 jobs to Jefferson Parish.January 2023: In order to expand their operations in the western part of the United States Inland Seafood acquired Texas-based Lonestar Seafood. The Texas-based supplier is famous for the quality of lobsters they supply.
9. What pricing options are available for accessing the report?
Pricing options include single-user, multi-user, and enterprise licenses priced at USD 3800, USD 4500, and USD 5800 respectively.
10. Is the market size provided in terms of value or volume?
The market size is provided in terms of value, measured in Million.
11. Are there any specific market keywords associated with the report?
Yes, the market keyword associated with the report is "Fish and Seafood Industry in US," which aids in identifying and referencing the specific market segment covered.
12. How do I determine which pricing option suits my needs best?
The pricing options vary based on user requirements and access needs. Individual users may opt for single-user licenses, while businesses requiring broader access may choose multi-user or enterprise licenses for cost-effective access to the report.
13. Are there any additional resources or data provided in the Fish and Seafood Industry in US report?
While the report offers comprehensive insights, it's advisable to review the specific contents or supplementary materials provided to ascertain if additional resources or data are available.
14. How can I stay updated on further developments or reports in the Fish and Seafood Industry in US?
To stay informed about further developments, trends, and reports in the Fish and Seafood Industry in US, consider subscribing to industry newsletters, following relevant companies and organizations, or regularly checking reputable industry news sources and publications.
Methodology
Step 1 - Identification of Relevant Samples Size from Population Database


Step 2 - Approaches for Defining Global Market Size (Value, Volume* & Price*)

Note*: In applicable scenarios
Step 3 - Data Sources
Primary Research
- Web Analytics
- Survey Reports
- Research Institute
- Latest Research Reports
- Opinion Leaders
Secondary Research
- Annual Reports
- White Paper
- Latest Press Release
- Industry Association
- Paid Database
- Investor Presentations

Step 4 - Data Triangulation
Involves using different sources of information in order to increase the validity of a study
These sources are likely to be stakeholders in a program - participants, other researchers, program staff, other community members, and so on.
Then we put all data in single framework & apply various statistical tools to find out the dynamic on the market.
During the analysis stage, feedback from the stakeholder groups would be compared to determine areas of agreement as well as areas of divergence
