

Key Insights
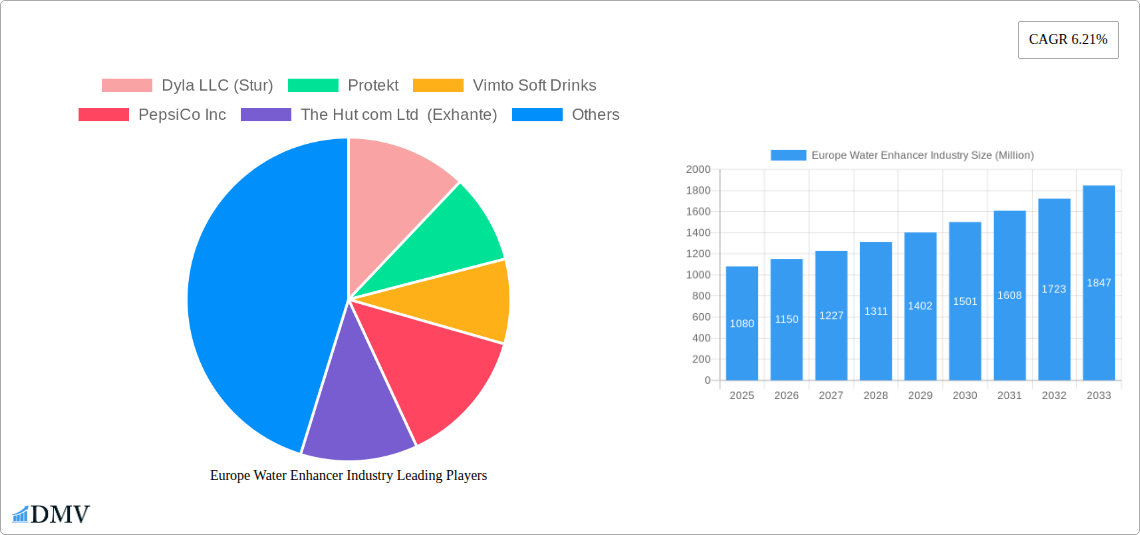
The European water enhancer market, valued at €1.08 billion in 2025, is projected to experience robust growth, driven by increasing health consciousness among consumers and the rising popularity of healthier beverage alternatives. The market's Compound Annual Growth Rate (CAGR) of 6.21% from 2025 to 2033 indicates a significant expansion in the coming years. Key drivers include the growing preference for low-sugar and calorie-free beverages, increasing demand for customizable drinks, and rising disposable incomes across several European countries. Furthermore, the market is experiencing a shift towards convenient online retail channels, supplementing established supermarket and convenience store distribution. The UK, Germany, and France are currently the leading markets in Europe, owing to high consumer awareness and established distribution networks. However, other countries like Spain and Italy show significant potential for growth as consumer preferences evolve. Despite the positive outlook, challenges like intense competition among established brands and the emergence of new entrants could pose some restraints to growth. The market segmentation by distribution channels highlights the importance of online retail, a rapidly growing segment, for brand visibility and market penetration. Premiumization within the water enhancer category, featuring natural ingredients and functional benefits, is also a key trend to watch.
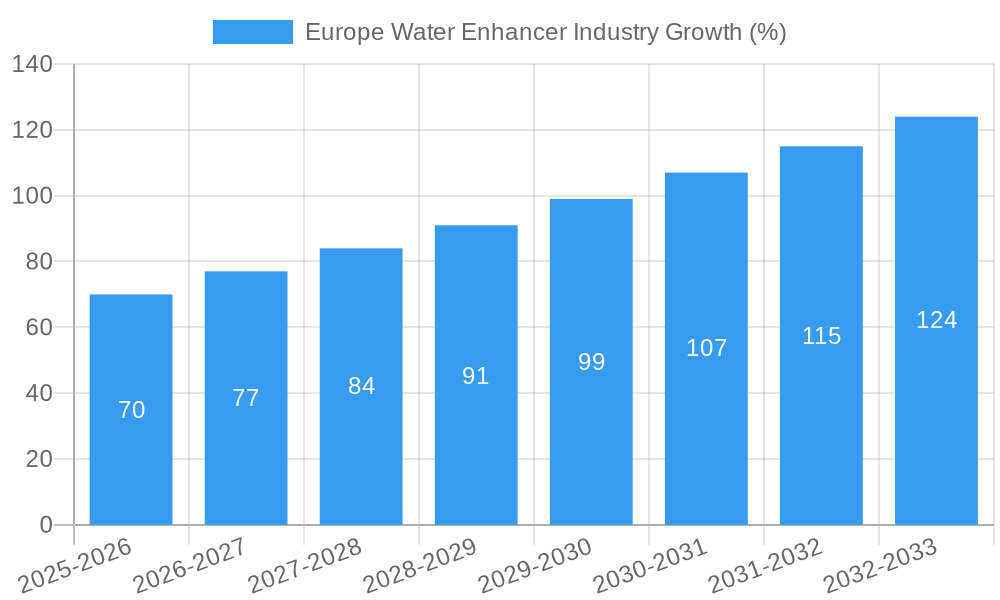
The forecast period of 2025-2033 suggests continued expansion in this market, with growth anticipated across various segments. Specific growth within individual countries will likely be influenced by economic conditions, changing consumer habits, and the success of marketing campaigns targeted towards health-conscious demographics. The increasing awareness of the benefits of hydration and the versatile nature of water enhancers, enabling customization of flavor profiles, further contributes to the positive outlook. This ongoing trend towards healthier lifestyle choices underscores the potential for long-term growth and expansion within this sector. Continuous innovation in product offerings and marketing strategies will be crucial for players to maintain a competitive edge and capitalize on future market opportunities.
Europe Water Enhancer Industry: A Comprehensive Market Report (2019-2033)
This insightful report provides a detailed analysis of the European water enhancer industry, offering a comprehensive overview of market dynamics, key players, and future growth prospects. Covering the period from 2019 to 2033, with a focus on 2025, this report is an invaluable resource for stakeholders seeking to understand and capitalize on this dynamic market. The European water enhancer market is projected to reach xx Million by 2033, presenting significant opportunities for growth and investment.
Europe Water Enhancer Industry Market Composition & Trends
This section delves into the competitive landscape of the European water enhancer market, examining market concentration, innovation drivers, regulatory frameworks, substitute products, end-user profiles, and merger & acquisition (M&A) activity. We analyze the market share distribution amongst key players and quantify the value of significant M&A deals concluded within the study period (2019-2024). The report reveals a moderately consolidated market with key players vying for market dominance through innovation and strategic acquisitions. The increasing consumer preference for healthier beverages and the rising demand for convenient, on-the-go hydration solutions are key drivers for market growth. Regulatory changes related to food and beverage labeling and health claims significantly impact market dynamics. Competition from substitute products, such as ready-to-drink flavored waters and functional beverages, is also explored. The report further identifies key end-user segments and their consumption patterns. Finally, a detailed analysis of M&A activity in the sector, including deal values and rationale behind the mergers, is provided.
- Market Concentration: xx% of the market is controlled by the top 5 players.
- M&A Deal Value (2019-2024): Estimated at xx Million.
- Key Innovation Catalysts: Focus on natural ingredients, functional benefits (e.g., vitamins, antioxidants), and sustainable packaging.
- Regulatory Landscape: Analysis of EU regulations on food additives, labeling, and health claims.
Europe Water Enhancer Industry Industry Evolution
This section provides a detailed analysis of the evolution of the European water enhancer industry, focusing on market growth trajectories, technological advancements, and shifting consumer preferences. We analyze historical growth rates (2019-2024), projecting future growth (2025-2033) based on identified trends. The adoption of innovative technologies in manufacturing, packaging, and distribution is explored, along with their impact on market efficiency and product development. Consumer preferences are analyzed, including the shift towards healthier and more convenient beverage options, influencing product innovation and marketing strategies. The report highlights the increasing demand for functional water enhancers with added vitamins, minerals, and other beneficial ingredients. Detailed data points on growth rates and market penetration are included to provide a thorough understanding of the industry's dynamic evolution.
Leading Regions, Countries, or Segments in Europe Water Enhancer Industry
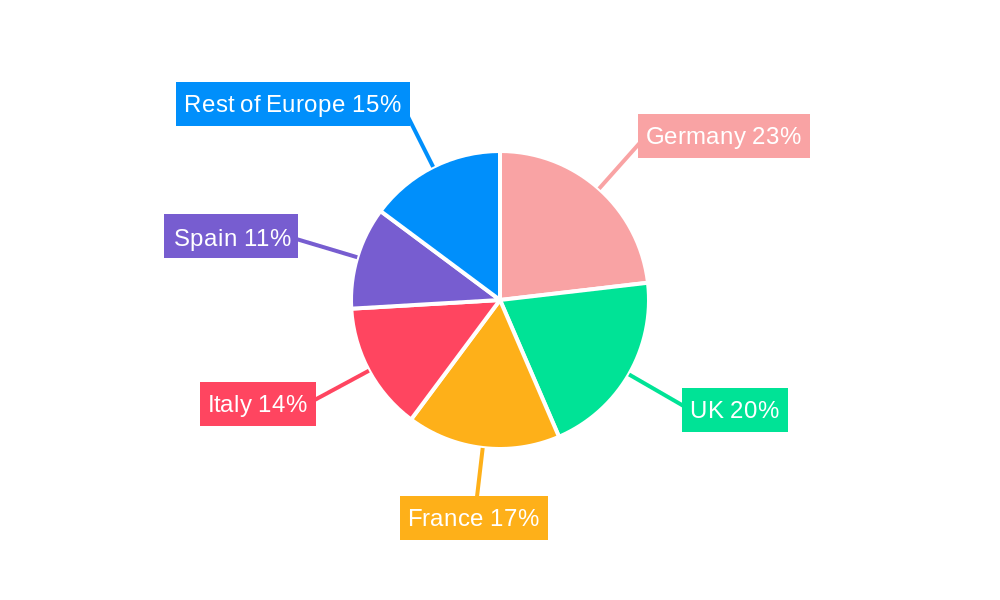
This section identifies the dominant regions, countries, and distribution channels within the European water enhancer market. We examine market performance in key countries, including Spain, the United Kingdom, France, Germany, Italy, and Russia, considering the specific market dynamics and drivers in each region. The analysis covers different distribution channels, focusing on Supermarkets/Hypermarkets, Convenience Stores, Online Retail Stores, Pharmacy & Health Stores, and Other Distribution Channels, to pinpoint the most successful strategies and identify potential opportunities for expansion.
- Key Drivers (By Country):
- United Kingdom: Strong consumer demand for healthier beverages and established retail infrastructure.
- Germany: High consumer awareness of health and wellness, driving demand for functional water enhancers.
- France: Growing interest in natural and organic products.
- Key Drivers (By Distribution Channel):
- Supermarkets/Hypermarkets: High volume sales and established distribution networks.
- Online Retail Stores: Increasing convenience and accessibility to a wider customer base.
- Pharmacy & Health Stores: Growing demand for functional and health-focused beverages.
Europe Water Enhancer Industry Product Innovations
This section highlights significant product innovations in the European water enhancer market, including new product launches, technological advancements in formulation and packaging, and the resulting impact on performance metrics (e.g., sales, market share). We discuss unique selling propositions (USPs) of new products and the competitive advantages they offer. Recent launches focus on enhanced functionality, improved taste profiles, and sustainable packaging solutions. These innovations drive market growth and consumer engagement.
Propelling Factors for Europe Water Enhancer Industry Growth
Several factors drive the growth of the European water enhancer market. Technological advancements in formulation, enhancing taste and functionality, play a vital role. Economic factors like increasing disposable incomes influence consumer spending on healthier beverage options. Moreover, favorable regulatory environments supporting the industry contribute to market expansion. The rising health consciousness among consumers and the increasing demand for convenient hydration solutions further boost market growth.
Obstacles in the Europe Water Enhancer Industry Market
The European water enhancer market faces challenges including stringent regulatory hurdles regarding labeling, health claims, and food additives. Supply chain disruptions due to geopolitical events and economic fluctuations affect production and distribution costs. Intense competition from established beverage companies and emerging players puts pressure on pricing and market share. These factors can significantly impact the overall market growth.
Future Opportunities in Europe Water Enhancer Industry
Future opportunities include expansion into emerging markets within Europe with growing health consciousness. Technological innovation, such as the development of new flavors and functional benefits, offers substantial growth potential. Catering to specific dietary needs and preferences (e.g., vegan, organic) opens new market segments and allows for product differentiation.
Major Players in the Europe Water Enhancer Industry Ecosystem
- Dyla LLC (Stur)
- Protekt
- Vimto Soft Drinks
- PepsiCo Inc
- The Hut com Ltd (Exhante)
- The Kraft Heinz Company
- The Coca-Cola Company
- Pure Flavour GmbH
- DreamPak
- Wisdom Natural Brands
Key Developments in Europe Water Enhancer Industry Industry
- 2022 (Q3): Robinsons launched new Benefit Drops in four flavors, offering added vitamins.
- 2022 (Q4): DreamPak launched Enhanca Hydrate water flavor enhancers in various flavors.
- 2022 (Q2): Protekt launched liquid supplements and beverage enhancers with antioxidants in the UK.
Strategic Europe Water Enhancer Industry Market Forecast
The European water enhancer market is poised for significant growth over the forecast period (2025-2033), driven by increased consumer demand for healthier and more convenient hydration options, coupled with continuous innovation in product formulation and functionality. Emerging trends, such as the growing interest in functional beverages and personalized nutrition, present exciting opportunities for market expansion. This presents significant potential for both established players and new entrants to the market.
Europe Water Enhancer Industry Segmentation
-
1. Distribution Channel
- 1.1. Supermarkets/Hypermarkets
- 1.2. Convenience Stores
- 1.3. Online Retail Stores
- 1.4. Pharmacy & Health Store
- 1.5. Other Distribution Channels
Europe Water Enhancer Industry Segmentation By Geography
-
1. Europe
- 1.1. United Kingdom
- 1.2. Germany
- 1.3. France
- 1.4. Italy
- 1.5. Spain
- 1.6. Netherlands
- 1.7. Belgium
- 1.8. Sweden
- 1.9. Norway
- 1.10. Poland
- 1.11. Denmark
Europe Water Enhancer Industry REPORT HIGHLIGHTS
| Aspects | Details |
|---|---|
| Study Period | 2019-2033 |
| Base Year | 2024 |
| Estimated Year | 2025 |
| Forecast Period | 2025-2033 |
| Historical Period | 2019-2024 |
| Growth Rate | CAGR of 6.21% from 2019-2033 |
| Segmentation |
|
Table of Contents
- 1. Introduction
- 1.1. Research Scope
- 1.2. Market Segmentation
- 1.3. Research Methodology
- 1.4. Definitions and Assumptions
- 2. Executive Summary
- 2.1. Introduction
- 3. Market Dynamics
- 3.1. Introduction
- 3.2. Market Drivers
- 3.2.1. Increasing Sports Participation; Increasing Awareness about Health and Fitness
- 3.3. Market Restrains
- 3.3.1. Adverse Effects of Overconsumption of Products
- 3.4. Market Trends
- 3.4.1. Rising Demand for Non-Carbonated Beverages
- 4. Market Factor Analysis
- 4.1. Porters Five Forces
- 4.2. Supply/Value Chain
- 4.3. PESTEL analysis
- 4.4. Market Entropy
- 4.5. Patent/Trademark Analysis
- 5. Europe Water Enhancer Industry Analysis, Insights and Forecast, 2019-2031
- 5.1. Market Analysis, Insights and Forecast - by Distribution Channel
- 5.1.1. Supermarkets/Hypermarkets
- 5.1.2. Convenience Stores
- 5.1.3. Online Retail Stores
- 5.1.4. Pharmacy & Health Store
- 5.1.5. Other Distribution Channels
- 5.2. Market Analysis, Insights and Forecast - by Region
- 5.2.1. Europe
- 5.1. Market Analysis, Insights and Forecast - by Distribution Channel
- 6. Germany Europe Water Enhancer Industry Analysis, Insights and Forecast, 2019-2031
- 7. France Europe Water Enhancer Industry Analysis, Insights and Forecast, 2019-2031
- 8. Italy Europe Water Enhancer Industry Analysis, Insights and Forecast, 2019-2031
- 9. United Kingdom Europe Water Enhancer Industry Analysis, Insights and Forecast, 2019-2031
- 10. Netherlands Europe Water Enhancer Industry Analysis, Insights and Forecast, 2019-2031
- 11. Sweden Europe Water Enhancer Industry Analysis, Insights and Forecast, 2019-2031
- 12. Rest of Europe Europe Water Enhancer Industry Analysis, Insights and Forecast, 2019-2031
- 13. Competitive Analysis
- 13.1. Market Share Analysis 2024
- 13.2. Company Profiles
- 13.2.1 Dyla LLC (Stur)
- 13.2.1.1. Overview
- 13.2.1.2. Products
- 13.2.1.3. SWOT Analysis
- 13.2.1.4. Recent Developments
- 13.2.1.5. Financials (Based on Availability)
- 13.2.2 Protekt
- 13.2.2.1. Overview
- 13.2.2.2. Products
- 13.2.2.3. SWOT Analysis
- 13.2.2.4. Recent Developments
- 13.2.2.5. Financials (Based on Availability)
- 13.2.3 Vimto Soft Drinks
- 13.2.3.1. Overview
- 13.2.3.2. Products
- 13.2.3.3. SWOT Analysis
- 13.2.3.4. Recent Developments
- 13.2.3.5. Financials (Based on Availability)
- 13.2.4 PepsiCo Inc
- 13.2.4.1. Overview
- 13.2.4.2. Products
- 13.2.4.3. SWOT Analysis
- 13.2.4.4. Recent Developments
- 13.2.4.5. Financials (Based on Availability)
- 13.2.5 The Hut com Ltd (Exhante)
- 13.2.5.1. Overview
- 13.2.5.2. Products
- 13.2.5.3. SWOT Analysis
- 13.2.5.4. Recent Developments
- 13.2.5.5. Financials (Based on Availability)
- 13.2.6 The Kraft Heinz Company
- 13.2.6.1. Overview
- 13.2.6.2. Products
- 13.2.6.3. SWOT Analysis
- 13.2.6.4. Recent Developments
- 13.2.6.5. Financials (Based on Availability)
- 13.2.7 The Coca-Cola Company
- 13.2.7.1. Overview
- 13.2.7.2. Products
- 13.2.7.3. SWOT Analysis
- 13.2.7.4. Recent Developments
- 13.2.7.5. Financials (Based on Availability)
- 13.2.8 Pure Flavour GmbH
- 13.2.8.1. Overview
- 13.2.8.2. Products
- 13.2.8.3. SWOT Analysis
- 13.2.8.4. Recent Developments
- 13.2.8.5. Financials (Based on Availability)
- 13.2.9 DreamPak*List Not Exhaustive
- 13.2.9.1. Overview
- 13.2.9.2. Products
- 13.2.9.3. SWOT Analysis
- 13.2.9.4. Recent Developments
- 13.2.9.5. Financials (Based on Availability)
- 13.2.10 Wisdom Natural Brands
- 13.2.10.1. Overview
- 13.2.10.2. Products
- 13.2.10.3. SWOT Analysis
- 13.2.10.4. Recent Developments
- 13.2.10.5. Financials (Based on Availability)
- 13.2.1 Dyla LLC (Stur)
List of Figures
- Figure 1: Europe Water Enhancer Industry Revenue Breakdown (Million, %) by Product 2024 & 2032
- Figure 2: Europe Water Enhancer Industry Share (%) by Company 2024
List of Tables
- Table 1: Europe Water Enhancer Industry Revenue Million Forecast, by Region 2019 & 2032
- Table 2: Europe Water Enhancer Industry Volume K Litres Forecast, by Region 2019 & 2032
- Table 3: Europe Water Enhancer Industry Revenue Million Forecast, by Distribution Channel 2019 & 2032
- Table 4: Europe Water Enhancer Industry Volume K Litres Forecast, by Distribution Channel 2019 & 2032
- Table 5: Europe Water Enhancer Industry Revenue Million Forecast, by Region 2019 & 2032
- Table 6: Europe Water Enhancer Industry Volume K Litres Forecast, by Region 2019 & 2032
- Table 7: Europe Water Enhancer Industry Revenue Million Forecast, by Country 2019 & 2032
- Table 8: Europe Water Enhancer Industry Volume K Litres Forecast, by Country 2019 & 2032
- Table 9: Germany Europe Water Enhancer Industry Revenue (Million) Forecast, by Application 2019 & 2032
- Table 10: Germany Europe Water Enhancer Industry Volume (K Litres) Forecast, by Application 2019 & 2032
- Table 11: France Europe Water Enhancer Industry Revenue (Million) Forecast, by Application 2019 & 2032
- Table 12: France Europe Water Enhancer Industry Volume (K Litres) Forecast, by Application 2019 & 2032
- Table 13: Italy Europe Water Enhancer Industry Revenue (Million) Forecast, by Application 2019 & 2032
- Table 14: Italy Europe Water Enhancer Industry Volume (K Litres) Forecast, by Application 2019 & 2032
- Table 15: United Kingdom Europe Water Enhancer Industry Revenue (Million) Forecast, by Application 2019 & 2032
- Table 16: United Kingdom Europe Water Enhancer Industry Volume (K Litres) Forecast, by Application 2019 & 2032
- Table 17: Netherlands Europe Water Enhancer Industry Revenue (Million) Forecast, by Application 2019 & 2032
- Table 18: Netherlands Europe Water Enhancer Industry Volume (K Litres) Forecast, by Application 2019 & 2032
- Table 19: Sweden Europe Water Enhancer Industry Revenue (Million) Forecast, by Application 2019 & 2032
- Table 20: Sweden Europe Water Enhancer Industry Volume (K Litres) Forecast, by Application 2019 & 2032
- Table 21: Rest of Europe Europe Water Enhancer Industry Revenue (Million) Forecast, by Application 2019 & 2032
- Table 22: Rest of Europe Europe Water Enhancer Industry Volume (K Litres) Forecast, by Application 2019 & 2032
- Table 23: Europe Water Enhancer Industry Revenue Million Forecast, by Distribution Channel 2019 & 2032
- Table 24: Europe Water Enhancer Industry Volume K Litres Forecast, by Distribution Channel 2019 & 2032
- Table 25: Europe Water Enhancer Industry Revenue Million Forecast, by Country 2019 & 2032
- Table 26: Europe Water Enhancer Industry Volume K Litres Forecast, by Country 2019 & 2032
- Table 27: United Kingdom Europe Water Enhancer Industry Revenue (Million) Forecast, by Application 2019 & 2032
- Table 28: United Kingdom Europe Water Enhancer Industry Volume (K Litres) Forecast, by Application 2019 & 2032
- Table 29: Germany Europe Water Enhancer Industry Revenue (Million) Forecast, by Application 2019 & 2032
- Table 30: Germany Europe Water Enhancer Industry Volume (K Litres) Forecast, by Application 2019 & 2032
- Table 31: France Europe Water Enhancer Industry Revenue (Million) Forecast, by Application 2019 & 2032
- Table 32: France Europe Water Enhancer Industry Volume (K Litres) Forecast, by Application 2019 & 2032
- Table 33: Italy Europe Water Enhancer Industry Revenue (Million) Forecast, by Application 2019 & 2032
- Table 34: Italy Europe Water Enhancer Industry Volume (K Litres) Forecast, by Application 2019 & 2032
- Table 35: Spain Europe Water Enhancer Industry Revenue (Million) Forecast, by Application 2019 & 2032
- Table 36: Spain Europe Water Enhancer Industry Volume (K Litres) Forecast, by Application 2019 & 2032
- Table 37: Netherlands Europe Water Enhancer Industry Revenue (Million) Forecast, by Application 2019 & 2032
- Table 38: Netherlands Europe Water Enhancer Industry Volume (K Litres) Forecast, by Application 2019 & 2032
- Table 39: Belgium Europe Water Enhancer Industry Revenue (Million) Forecast, by Application 2019 & 2032
- Table 40: Belgium Europe Water Enhancer Industry Volume (K Litres) Forecast, by Application 2019 & 2032
- Table 41: Sweden Europe Water Enhancer Industry Revenue (Million) Forecast, by Application 2019 & 2032
- Table 42: Sweden Europe Water Enhancer Industry Volume (K Litres) Forecast, by Application 2019 & 2032
- Table 43: Norway Europe Water Enhancer Industry Revenue (Million) Forecast, by Application 2019 & 2032
- Table 44: Norway Europe Water Enhancer Industry Volume (K Litres) Forecast, by Application 2019 & 2032
- Table 45: Poland Europe Water Enhancer Industry Revenue (Million) Forecast, by Application 2019 & 2032
- Table 46: Poland Europe Water Enhancer Industry Volume (K Litres) Forecast, by Application 2019 & 2032
- Table 47: Denmark Europe Water Enhancer Industry Revenue (Million) Forecast, by Application 2019 & 2032
- Table 48: Denmark Europe Water Enhancer Industry Volume (K Litres) Forecast, by Application 2019 & 2032
Frequently Asked Questions
1. What is the projected Compound Annual Growth Rate (CAGR) of the Europe Water Enhancer Industry?
The projected CAGR is approximately 6.21%.
2. Which companies are prominent players in the Europe Water Enhancer Industry?
Key companies in the market include Dyla LLC (Stur), Protekt, Vimto Soft Drinks, PepsiCo Inc, The Hut com Ltd (Exhante), The Kraft Heinz Company, The Coca-Cola Company, Pure Flavour GmbH, DreamPak*List Not Exhaustive, Wisdom Natural Brands.
3. What are the main segments of the Europe Water Enhancer Industry?
The market segments include Distribution Channel.
4. Can you provide details about the market size?
The market size is estimated to be USD 1.08 Million as of 2022.
5. What are some drivers contributing to market growth?
Increasing Sports Participation; Increasing Awareness about Health and Fitness.
6. What are the notable trends driving market growth?
Rising Demand for Non-Carbonated Beverages.
7. Are there any restraints impacting market growth?
Adverse Effects of Overconsumption of Products.
8. Can you provide examples of recent developments in the market?
In 2022, Robinsons launched new Benefit Drops in four flavors. Each with a different added functional benefit, the Britvic-owned range offers shoppers a convenient and tasty way to gain additional vitamins while on the move. It helps consumers make tastier, healthier choices in line with Britvic’s long-term Healthier People strategy.
9. What pricing options are available for accessing the report?
Pricing options include single-user, multi-user, and enterprise licenses priced at USD 4750, USD 5250, and USD 8750 respectively.
10. Is the market size provided in terms of value or volume?
The market size is provided in terms of value, measured in Million and volume, measured in K Litres.
11. Are there any specific market keywords associated with the report?
Yes, the market keyword associated with the report is "Europe Water Enhancer Industry," which aids in identifying and referencing the specific market segment covered.
12. How do I determine which pricing option suits my needs best?
The pricing options vary based on user requirements and access needs. Individual users may opt for single-user licenses, while businesses requiring broader access may choose multi-user or enterprise licenses for cost-effective access to the report.
13. Are there any additional resources or data provided in the Europe Water Enhancer Industry report?
While the report offers comprehensive insights, it's advisable to review the specific contents or supplementary materials provided to ascertain if additional resources or data are available.
14. How can I stay updated on further developments or reports in the Europe Water Enhancer Industry?
To stay informed about further developments, trends, and reports in the Europe Water Enhancer Industry, consider subscribing to industry newsletters, following relevant companies and organizations, or regularly checking reputable industry news sources and publications.
Methodology
Step 1 - Identification of Relevant Samples Size from Population Database


Step 2 - Approaches for Defining Global Market Size (Value, Volume* & Price*)

Note*: In applicable scenarios
Step 3 - Data Sources
Primary Research
- Web Analytics
- Survey Reports
- Research Institute
- Latest Research Reports
- Opinion Leaders
Secondary Research
- Annual Reports
- White Paper
- Latest Press Release
- Industry Association
- Paid Database
- Investor Presentations

Step 4 - Data Triangulation
Involves using different sources of information in order to increase the validity of a study
These sources are likely to be stakeholders in a program - participants, other researchers, program staff, other community members, and so on.
Then we put all data in single framework & apply various statistical tools to find out the dynamic on the market.
During the analysis stage, feedback from the stakeholder groups would be compared to determine areas of agreement as well as areas of divergence
