

Key Insights
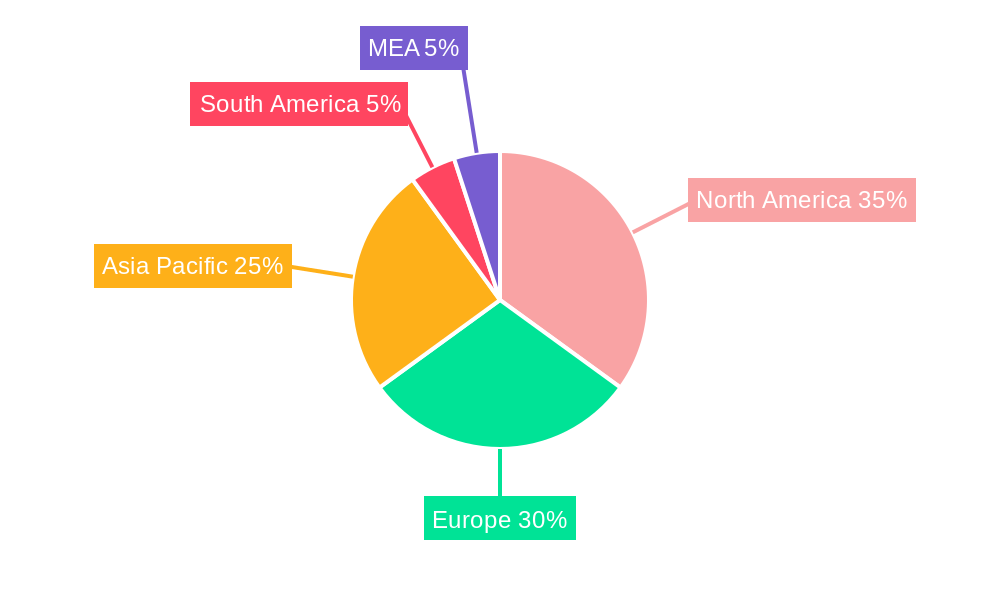
The enterprise mobility market in the retail industry is experiencing robust growth, driven by the increasing need for real-time inventory management, enhanced customer engagement, and improved operational efficiency. The market's 26.25% CAGR from 2019 to 2024 indicates a significant expansion, projected to continue through 2033. Key drivers include the proliferation of mobile devices (smartphones, tablets, laptops) among retail employees, the adoption of cloud-based solutions for seamless data access, and the rising demand for omnichannel strategies. Retailers are leveraging mobility solutions to streamline supply chain operations, improve in-store experiences through personalized offers and targeted promotions, and empower field staff with real-time information for efficient order fulfillment and customer service. While the initial investment in infrastructure and training can be a restraint, the long-term return on investment (ROI) in terms of increased productivity and reduced operational costs makes it a compelling proposition for businesses of all sizes. The market segmentation by device shows smartphones maintaining dominance, reflecting the ubiquity and ease of use, followed by tablets and laptops used for more complex tasks. Leading companies are actively innovating, offering comprehensive solutions that integrate mobility with other enterprise systems such as ERP and CRM, further boosting market growth. Geographic distribution shows North America and Europe as mature markets, while the Asia-Pacific region is poised for significant expansion due to increasing digital adoption and e-commerce penetration.
The competitive landscape is marked by a mix of established players like IBM, Microsoft, and Cisco, and specialized mobility solution providers. These companies are constantly developing new features to cater to the evolving needs of the retail industry, such as improved security measures, advanced analytics capabilities, and integration with emerging technologies like AI and IoT. Future growth will be influenced by factors such as the adoption of 5G technology, the increasing use of augmented reality (AR) and virtual reality (VR) in retail experiences, and the ongoing evolution of cybersecurity protocols to mitigate potential risks associated with mobile devices and data management. The market is expected to witness further consolidation as companies seek to enhance their service offerings and expand their reach across diverse geographical regions. Continued focus on user experience and ease of implementation will be crucial for companies to gain a competitive edge in this rapidly growing market.
Enterprise Mobility in Retail Industry: A Comprehensive Market Report (2019-2033)
This insightful report provides a detailed analysis of the Enterprise Mobility in Retail Industry market, offering a comprehensive overview of its current state, future trajectory, and key players. With a study period spanning 2019-2033, a base year of 2025, and a forecast period of 2025-2033, this report is an invaluable resource for stakeholders seeking to understand and capitalize on this rapidly evolving market. The market is estimated to be worth $XX Million in 2025 and is projected to reach $XX Million by 2033, representing a substantial growth opportunity.
Enterprise Mobility in Retail Industry Market Composition & Trends
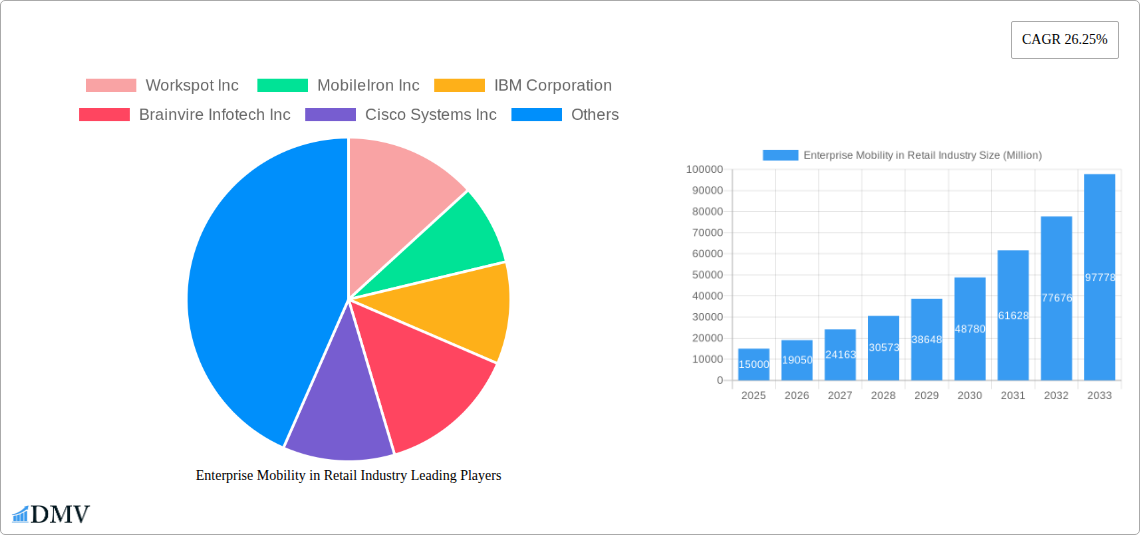
This section delves into the competitive landscape of the Enterprise Mobility in Retail Industry market, examining market concentration, innovation drivers, regulatory influences, substitute products, end-user profiles, and merger & acquisition (M&A) activities. We analyze the market share distribution amongst key players, revealing the dominance of certain companies and highlighting emerging competitors. For example, the top five companies—Microsoft Corporation, IBM Corporation, VMware Inc, SAP SE, and Cisco Systems Inc—currently hold an estimated 60% market share. The report also details significant M&A activities, with deal values exceeding $XX Million in the past five years, showcasing the industry's dynamic nature. Innovation is driven by the need for enhanced supply chain management, improved customer experience, and optimized workforce productivity. Regulatory landscapes, varying by region, impact data privacy and security compliance. Substitute products, such as traditional in-store systems, face increasing competition from the efficiency and scalability of mobile solutions. The end-user profile is broad, encompassing retail employees, managers, and executives, with varying mobility needs and technological proficiency.
- Market Concentration: Highly fragmented, with top 5 players holding 60% market share.
- Innovation Catalysts: Enhanced supply chain, customer experience, and workforce productivity.
- Regulatory Landscape: Varies by region, impacting data privacy and security.
- Substitute Products: Traditional in-store systems, facing increasing competition.
- M&A Activity: Deal values exceeding $XX Million in the last 5 years.
Enterprise Mobility in Retail Industry Industry Evolution
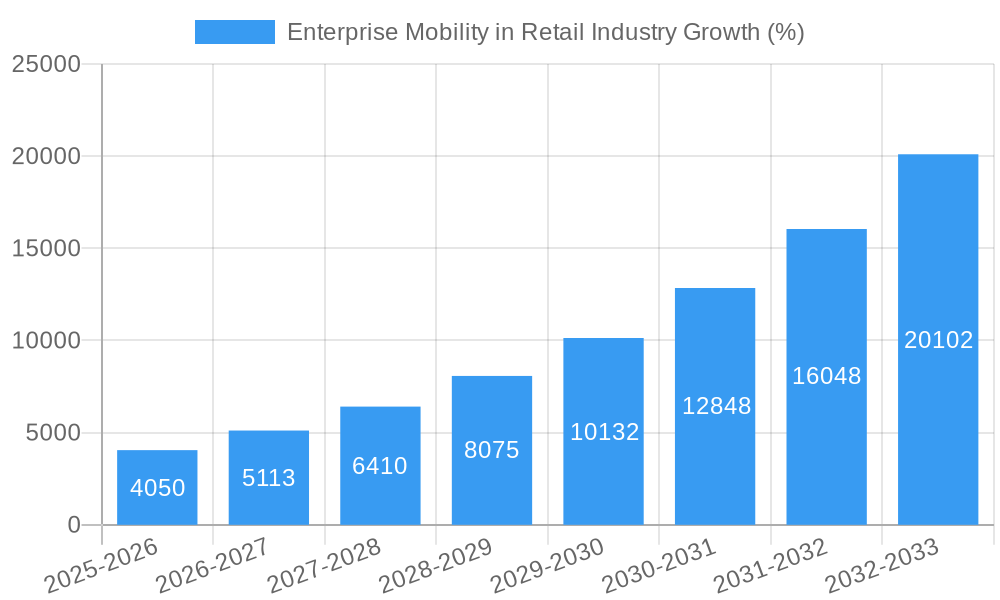
This section provides a detailed analysis of the Enterprise Mobility in Retail Industry's evolution, encompassing market growth trajectories, technological advancements, and shifting consumer demands. We examine the historical period (2019-2024), focusing on growth rates and adoption metrics across different retail segments. The market witnessed a Compound Annual Growth Rate (CAGR) of XX% during the historical period, driven by factors such as the increasing adoption of smartphones and tablets amongst retail employees, the growing demand for real-time inventory management systems, and the increasing focus on enhancing the customer experience through mobile applications. Technological advancements, such as the integration of 5G technology and the rise of cloud-based solutions, have further propelled market growth. The shift towards omnichannel retail strategies and the rising preference for mobile-first experiences have significantly influenced the market's trajectory. The report projects a CAGR of XX% during the forecast period (2025-2033), with substantial growth anticipated in regions such as North America and Asia-Pacific.
Leading Regions, Countries, or Segments in Enterprise Mobility in Retail Industry
North America currently holds the leading position in the Enterprise Mobility in Retail Industry market, driven primarily by high technological adoption rates, substantial investments in digital infrastructure, and the presence of major technology companies. The dominance of smartphones within the 'By Device' segment further contributes to this region's prominence.
Key Drivers in North America:
- High technological adoption rates
- Significant investments in digital infrastructure
- Presence of major technology companies
- Strong regulatory support for digital transformation
Dominance Factors: Early adoption of mobile technologies within the retail sector, coupled with a robust technological infrastructure and regulatory environment supporting digital transformation, have cemented North America's leading position. This is further amplified by the high penetration of smartphones among retail employees and the significant investment in enterprise mobility solutions by large retail chains.
Enterprise Mobility in Retail Industry Product Innovations
The Enterprise Mobility in Retail Industry is witnessing rapid innovation in mobile point-of-sale (mPOS) systems, inventory management apps, and customer relationship management (CRM) solutions. These innovations offer improved efficiency, enhanced customer engagement, and real-time data analytics capabilities. For example, the integration of augmented reality (AR) and artificial intelligence (AI) into mobile applications provides retailers with unique selling propositions, improving customer experiences and streamlining operations. Key performance metrics include transaction speed, inventory accuracy, and customer satisfaction rates.
Propelling Factors for Enterprise Mobility in Retail Industry Growth
Technological advancements, such as the development of 5G networks and the increasing adoption of cloud-based solutions, are pivotal growth drivers. The economic benefits, including reduced operational costs and increased efficiency, further fuel market expansion. Favorable government regulations promoting digital transformation and initiatives supporting e-commerce further propel growth.
Obstacles in the Enterprise Mobility in Retail Industry Market
Data security concerns and the risk of data breaches represent significant obstacles. Supply chain disruptions and the increasing complexity of integrating mobile solutions into existing IT infrastructures also present challenges. Intense competition among vendors can also impact market growth, particularly for smaller players.
Future Opportunities in Enterprise Mobility in Retail Industry
The increasing adoption of Internet of Things (IoT) devices and the growth of artificial intelligence (AI) and machine learning (ML) technologies present significant future opportunities. Expansion into emerging markets and the development of new mobile solutions tailored to specific retail needs represent further growth prospects.
Major Players in the Enterprise Mobility in Retail Industry Ecosystem
- Workspot Inc
- MobileIron Inc
- IBM Corporation
- Brainvire Infotech Inc
- Cisco Systems Inc
- Microsoft Corporation
- Credencys Solutions Inc
- InnoMind Technologies
- Gizmeon Inc
- VMware Inc
- Citrix Systems Inc
- SAP SE
- Sonata Software
Key Developments in Enterprise Mobility in Retail Industry Industry
- January 2023: Microsoft launched a new suite of mobile apps for retail employees.
- June 2022: VMware acquired a smaller mobility solutions provider, enhancing its market share.
- October 2021: SAP released an updated version of its retail mobility platform, incorporating AI capabilities. (Further details to be added based on actual developments)
Strategic Enterprise Mobility in Retail Industry Market Forecast
The Enterprise Mobility in Retail Industry is poised for substantial growth over the forecast period, driven by technological innovations and increasing demand for efficient and customer-centric solutions. The market's expansion will be fueled by the wider adoption of 5G technology, the increasing prevalence of cloud-based solutions, and the growing adoption of mobile commerce. These factors will contribute to sustained market growth, creating significant opportunities for market participants.
Enterprise Mobility in Retail Industry Segmentation
-
1. Device
- 1.1. Smart Phones
- 1.2. Laptops
- 1.3. Tablets
- 1.4. Other Devices
Enterprise Mobility in Retail Industry Segmentation By Geography
- 1. North America
- 2. Europe
- 3. Asia pacific
- 4. Latin America
- 5. Middle East
Enterprise Mobility in Retail Industry REPORT HIGHLIGHTS
| Aspects | Details |
|---|---|
| Study Period | 2019-2033 |
| Base Year | 2024 |
| Estimated Year | 2025 |
| Forecast Period | 2025-2033 |
| Historical Period | 2019-2024 |
| Growth Rate | CAGR of 26.25% from 2019-2033 |
| Segmentation |
|
Table of Contents
- 1. Introduction
- 1.1. Research Scope
- 1.2. Market Segmentation
- 1.3. Research Methodology
- 1.4. Definitions and Assumptions
- 2. Executive Summary
- 2.1. Introduction
- 3. Market Dynamics
- 3.1. Introduction
- 3.2. Market Drivers
- 3.2.1. ; Substantial Growth in E-commerce; Increasing Adoption of Bring-your-own-device (BYOD)
- 3.3. Market Restrains
- 3.3.1. ; Security Concerns
- 3.4. Market Trends
- 3.4.1. Substantial Growth in E-commerce to Spearhead the Growth
- 4. Market Factor Analysis
- 4.1. Porters Five Forces
- 4.2. Supply/Value Chain
- 4.3. PESTEL analysis
- 4.4. Market Entropy
- 4.5. Patent/Trademark Analysis
- 5. Global Enterprise Mobility in Retail Industry Analysis, Insights and Forecast, 2019-2031
- 5.1. Market Analysis, Insights and Forecast - by Device
- 5.1.1. Smart Phones
- 5.1.2. Laptops
- 5.1.3. Tablets
- 5.1.4. Other Devices
- 5.2. Market Analysis, Insights and Forecast - by Region
- 5.2.1. North America
- 5.2.2. Europe
- 5.2.3. Asia pacific
- 5.2.4. Latin America
- 5.2.5. Middle East
- 5.1. Market Analysis, Insights and Forecast - by Device
- 6. North America Enterprise Mobility in Retail Industry Analysis, Insights and Forecast, 2019-2031
- 6.1. Market Analysis, Insights and Forecast - by Device
- 6.1.1. Smart Phones
- 6.1.2. Laptops
- 6.1.3. Tablets
- 6.1.4. Other Devices
- 6.1. Market Analysis, Insights and Forecast - by Device
- 7. Europe Enterprise Mobility in Retail Industry Analysis, Insights and Forecast, 2019-2031
- 7.1. Market Analysis, Insights and Forecast - by Device
- 7.1.1. Smart Phones
- 7.1.2. Laptops
- 7.1.3. Tablets
- 7.1.4. Other Devices
- 7.1. Market Analysis, Insights and Forecast - by Device
- 8. Asia pacific Enterprise Mobility in Retail Industry Analysis, Insights and Forecast, 2019-2031
- 8.1. Market Analysis, Insights and Forecast - by Device
- 8.1.1. Smart Phones
- 8.1.2. Laptops
- 8.1.3. Tablets
- 8.1.4. Other Devices
- 8.1. Market Analysis, Insights and Forecast - by Device
- 9. Latin America Enterprise Mobility in Retail Industry Analysis, Insights and Forecast, 2019-2031
- 9.1. Market Analysis, Insights and Forecast - by Device
- 9.1.1. Smart Phones
- 9.1.2. Laptops
- 9.1.3. Tablets
- 9.1.4. Other Devices
- 9.1. Market Analysis, Insights and Forecast - by Device
- 10. Middle East Enterprise Mobility in Retail Industry Analysis, Insights and Forecast, 2019-2031
- 10.1. Market Analysis, Insights and Forecast - by Device
- 10.1.1. Smart Phones
- 10.1.2. Laptops
- 10.1.3. Tablets
- 10.1.4. Other Devices
- 10.1. Market Analysis, Insights and Forecast - by Device
- 11. North America Enterprise Mobility in Retail Industry Analysis, Insights and Forecast, 2019-2031
- 11.1. Market Analysis, Insights and Forecast - By Country/Sub-region
- 11.1.1 United States
- 11.1.2 Canada
- 11.1.3 Mexico
- 12. Europe Enterprise Mobility in Retail Industry Analysis, Insights and Forecast, 2019-2031
- 12.1. Market Analysis, Insights and Forecast - By Country/Sub-region
- 12.1.1 Germany
- 12.1.2 United Kingdom
- 12.1.3 France
- 12.1.4 Spain
- 12.1.5 Italy
- 12.1.6 Spain
- 12.1.7 Belgium
- 12.1.8 Netherland
- 12.1.9 Nordics
- 12.1.10 Rest of Europe
- 13. Asia Pacific Enterprise Mobility in Retail Industry Analysis, Insights and Forecast, 2019-2031
- 13.1. Market Analysis, Insights and Forecast - By Country/Sub-region
- 13.1.1 China
- 13.1.2 Japan
- 13.1.3 India
- 13.1.4 South Korea
- 13.1.5 Southeast Asia
- 13.1.6 Australia
- 13.1.7 Indonesia
- 13.1.8 Phillipes
- 13.1.9 Singapore
- 13.1.10 Thailandc
- 13.1.11 Rest of Asia Pacific
- 14. South America Enterprise Mobility in Retail Industry Analysis, Insights and Forecast, 2019-2031
- 14.1. Market Analysis, Insights and Forecast - By Country/Sub-region
- 14.1.1 Brazil
- 14.1.2 Argentina
- 14.1.3 Peru
- 14.1.4 Chile
- 14.1.5 Colombia
- 14.1.6 Ecuador
- 14.1.7 Venezuela
- 14.1.8 Rest of South America
- 15. North America Enterprise Mobility in Retail Industry Analysis, Insights and Forecast, 2019-2031
- 15.1. Market Analysis, Insights and Forecast - By Country/Sub-region
- 15.1.1 United States
- 15.1.2 Canada
- 15.1.3 Mexico
- 16. MEA Enterprise Mobility in Retail Industry Analysis, Insights and Forecast, 2019-2031
- 16.1. Market Analysis, Insights and Forecast - By Country/Sub-region
- 16.1.1 United Arab Emirates
- 16.1.2 Saudi Arabia
- 16.1.3 South Africa
- 16.1.4 Rest of Middle East and Africa
- 17. Competitive Analysis
- 17.1. Global Market Share Analysis 2024
- 17.2. Company Profiles
- 17.2.1 Workspot Inc
- 17.2.1.1. Overview
- 17.2.1.2. Products
- 17.2.1.3. SWOT Analysis
- 17.2.1.4. Recent Developments
- 17.2.1.5. Financials (Based on Availability)
- 17.2.2 MobileIron Inc
- 17.2.2.1. Overview
- 17.2.2.2. Products
- 17.2.2.3. SWOT Analysis
- 17.2.2.4. Recent Developments
- 17.2.2.5. Financials (Based on Availability)
- 17.2.3 IBM Corporation
- 17.2.3.1. Overview
- 17.2.3.2. Products
- 17.2.3.3. SWOT Analysis
- 17.2.3.4. Recent Developments
- 17.2.3.5. Financials (Based on Availability)
- 17.2.4 Brainvire Infotech Inc
- 17.2.4.1. Overview
- 17.2.4.2. Products
- 17.2.4.3. SWOT Analysis
- 17.2.4.4. Recent Developments
- 17.2.4.5. Financials (Based on Availability)
- 17.2.5 Cisco Systems Inc
- 17.2.5.1. Overview
- 17.2.5.2. Products
- 17.2.5.3. SWOT Analysis
- 17.2.5.4. Recent Developments
- 17.2.5.5. Financials (Based on Availability)
- 17.2.6 Microsoft Corporation
- 17.2.6.1. Overview
- 17.2.6.2. Products
- 17.2.6.3. SWOT Analysis
- 17.2.6.4. Recent Developments
- 17.2.6.5. Financials (Based on Availability)
- 17.2.7 Credencys Solutions Inc
- 17.2.7.1. Overview
- 17.2.7.2. Products
- 17.2.7.3. SWOT Analysis
- 17.2.7.4. Recent Developments
- 17.2.7.5. Financials (Based on Availability)
- 17.2.8 InnoMind Technologies
- 17.2.8.1. Overview
- 17.2.8.2. Products
- 17.2.8.3. SWOT Analysis
- 17.2.8.4. Recent Developments
- 17.2.8.5. Financials (Based on Availability)
- 17.2.9 Gizmeon Inc
- 17.2.9.1. Overview
- 17.2.9.2. Products
- 17.2.9.3. SWOT Analysis
- 17.2.9.4. Recent Developments
- 17.2.9.5. Financials (Based on Availability)
- 17.2.10 VMware Inc
- 17.2.10.1. Overview
- 17.2.10.2. Products
- 17.2.10.3. SWOT Analysis
- 17.2.10.4. Recent Developments
- 17.2.10.5. Financials (Based on Availability)
- 17.2.11 Citrix Systems Inc
- 17.2.11.1. Overview
- 17.2.11.2. Products
- 17.2.11.3. SWOT Analysis
- 17.2.11.4. Recent Developments
- 17.2.11.5. Financials (Based on Availability)
- 17.2.12 SAP SE
- 17.2.12.1. Overview
- 17.2.12.2. Products
- 17.2.12.3. SWOT Analysis
- 17.2.12.4. Recent Developments
- 17.2.12.5. Financials (Based on Availability)
- 17.2.13 Sonata Software
- 17.2.13.1. Overview
- 17.2.13.2. Products
- 17.2.13.3. SWOT Analysis
- 17.2.13.4. Recent Developments
- 17.2.13.5. Financials (Based on Availability)
- 17.2.1 Workspot Inc
List of Figures
- Figure 1: Global Enterprise Mobility in Retail Industry Revenue Breakdown (Million, %) by Region 2024 & 2032
- Figure 2: North America Enterprise Mobility in Retail Industry Revenue (Million), by Country 2024 & 2032
- Figure 3: North America Enterprise Mobility in Retail Industry Revenue Share (%), by Country 2024 & 2032
- Figure 4: Europe Enterprise Mobility in Retail Industry Revenue (Million), by Country 2024 & 2032
- Figure 5: Europe Enterprise Mobility in Retail Industry Revenue Share (%), by Country 2024 & 2032
- Figure 6: Asia Pacific Enterprise Mobility in Retail Industry Revenue (Million), by Country 2024 & 2032
- Figure 7: Asia Pacific Enterprise Mobility in Retail Industry Revenue Share (%), by Country 2024 & 2032
- Figure 8: South America Enterprise Mobility in Retail Industry Revenue (Million), by Country 2024 & 2032
- Figure 9: South America Enterprise Mobility in Retail Industry Revenue Share (%), by Country 2024 & 2032
- Figure 10: North America Enterprise Mobility in Retail Industry Revenue (Million), by Country 2024 & 2032
- Figure 11: North America Enterprise Mobility in Retail Industry Revenue Share (%), by Country 2024 & 2032
- Figure 12: MEA Enterprise Mobility in Retail Industry Revenue (Million), by Country 2024 & 2032
- Figure 13: MEA Enterprise Mobility in Retail Industry Revenue Share (%), by Country 2024 & 2032
- Figure 14: North America Enterprise Mobility in Retail Industry Revenue (Million), by Device 2024 & 2032
- Figure 15: North America Enterprise Mobility in Retail Industry Revenue Share (%), by Device 2024 & 2032
- Figure 16: North America Enterprise Mobility in Retail Industry Revenue (Million), by Country 2024 & 2032
- Figure 17: North America Enterprise Mobility in Retail Industry Revenue Share (%), by Country 2024 & 2032
- Figure 18: Europe Enterprise Mobility in Retail Industry Revenue (Million), by Device 2024 & 2032
- Figure 19: Europe Enterprise Mobility in Retail Industry Revenue Share (%), by Device 2024 & 2032
- Figure 20: Europe Enterprise Mobility in Retail Industry Revenue (Million), by Country 2024 & 2032
- Figure 21: Europe Enterprise Mobility in Retail Industry Revenue Share (%), by Country 2024 & 2032
- Figure 22: Asia pacific Enterprise Mobility in Retail Industry Revenue (Million), by Device 2024 & 2032
- Figure 23: Asia pacific Enterprise Mobility in Retail Industry Revenue Share (%), by Device 2024 & 2032
- Figure 24: Asia pacific Enterprise Mobility in Retail Industry Revenue (Million), by Country 2024 & 2032
- Figure 25: Asia pacific Enterprise Mobility in Retail Industry Revenue Share (%), by Country 2024 & 2032
- Figure 26: Latin America Enterprise Mobility in Retail Industry Revenue (Million), by Device 2024 & 2032
- Figure 27: Latin America Enterprise Mobility in Retail Industry Revenue Share (%), by Device 2024 & 2032
- Figure 28: Latin America Enterprise Mobility in Retail Industry Revenue (Million), by Country 2024 & 2032
- Figure 29: Latin America Enterprise Mobility in Retail Industry Revenue Share (%), by Country 2024 & 2032
- Figure 30: Middle East Enterprise Mobility in Retail Industry Revenue (Million), by Device 2024 & 2032
- Figure 31: Middle East Enterprise Mobility in Retail Industry Revenue Share (%), by Device 2024 & 2032
- Figure 32: Middle East Enterprise Mobility in Retail Industry Revenue (Million), by Country 2024 & 2032
- Figure 33: Middle East Enterprise Mobility in Retail Industry Revenue Share (%), by Country 2024 & 2032
List of Tables
- Table 1: Global Enterprise Mobility in Retail Industry Revenue Million Forecast, by Region 2019 & 2032
- Table 2: Global Enterprise Mobility in Retail Industry Revenue Million Forecast, by Device 2019 & 2032
- Table 3: Global Enterprise Mobility in Retail Industry Revenue Million Forecast, by Region 2019 & 2032
- Table 4: Global Enterprise Mobility in Retail Industry Revenue Million Forecast, by Country 2019 & 2032
- Table 5: United States Enterprise Mobility in Retail Industry Revenue (Million) Forecast, by Application 2019 & 2032
- Table 6: Canada Enterprise Mobility in Retail Industry Revenue (Million) Forecast, by Application 2019 & 2032
- Table 7: Mexico Enterprise Mobility in Retail Industry Revenue (Million) Forecast, by Application 2019 & 2032
- Table 8: Global Enterprise Mobility in Retail Industry Revenue Million Forecast, by Country 2019 & 2032
- Table 9: Germany Enterprise Mobility in Retail Industry Revenue (Million) Forecast, by Application 2019 & 2032
- Table 10: United Kingdom Enterprise Mobility in Retail Industry Revenue (Million) Forecast, by Application 2019 & 2032
- Table 11: France Enterprise Mobility in Retail Industry Revenue (Million) Forecast, by Application 2019 & 2032
- Table 12: Spain Enterprise Mobility in Retail Industry Revenue (Million) Forecast, by Application 2019 & 2032
- Table 13: Italy Enterprise Mobility in Retail Industry Revenue (Million) Forecast, by Application 2019 & 2032
- Table 14: Spain Enterprise Mobility in Retail Industry Revenue (Million) Forecast, by Application 2019 & 2032
- Table 15: Belgium Enterprise Mobility in Retail Industry Revenue (Million) Forecast, by Application 2019 & 2032
- Table 16: Netherland Enterprise Mobility in Retail Industry Revenue (Million) Forecast, by Application 2019 & 2032
- Table 17: Nordics Enterprise Mobility in Retail Industry Revenue (Million) Forecast, by Application 2019 & 2032
- Table 18: Rest of Europe Enterprise Mobility in Retail Industry Revenue (Million) Forecast, by Application 2019 & 2032
- Table 19: Global Enterprise Mobility in Retail Industry Revenue Million Forecast, by Country 2019 & 2032
- Table 20: China Enterprise Mobility in Retail Industry Revenue (Million) Forecast, by Application 2019 & 2032
- Table 21: Japan Enterprise Mobility in Retail Industry Revenue (Million) Forecast, by Application 2019 & 2032
- Table 22: India Enterprise Mobility in Retail Industry Revenue (Million) Forecast, by Application 2019 & 2032
- Table 23: South Korea Enterprise Mobility in Retail Industry Revenue (Million) Forecast, by Application 2019 & 2032
- Table 24: Southeast Asia Enterprise Mobility in Retail Industry Revenue (Million) Forecast, by Application 2019 & 2032
- Table 25: Australia Enterprise Mobility in Retail Industry Revenue (Million) Forecast, by Application 2019 & 2032
- Table 26: Indonesia Enterprise Mobility in Retail Industry Revenue (Million) Forecast, by Application 2019 & 2032
- Table 27: Phillipes Enterprise Mobility in Retail Industry Revenue (Million) Forecast, by Application 2019 & 2032
- Table 28: Singapore Enterprise Mobility in Retail Industry Revenue (Million) Forecast, by Application 2019 & 2032
- Table 29: Thailandc Enterprise Mobility in Retail Industry Revenue (Million) Forecast, by Application 2019 & 2032
- Table 30: Rest of Asia Pacific Enterprise Mobility in Retail Industry Revenue (Million) Forecast, by Application 2019 & 2032
- Table 31: Global Enterprise Mobility in Retail Industry Revenue Million Forecast, by Country 2019 & 2032
- Table 32: Brazil Enterprise Mobility in Retail Industry Revenue (Million) Forecast, by Application 2019 & 2032
- Table 33: Argentina Enterprise Mobility in Retail Industry Revenue (Million) Forecast, by Application 2019 & 2032
- Table 34: Peru Enterprise Mobility in Retail Industry Revenue (Million) Forecast, by Application 2019 & 2032
- Table 35: Chile Enterprise Mobility in Retail Industry Revenue (Million) Forecast, by Application 2019 & 2032
- Table 36: Colombia Enterprise Mobility in Retail Industry Revenue (Million) Forecast, by Application 2019 & 2032
- Table 37: Ecuador Enterprise Mobility in Retail Industry Revenue (Million) Forecast, by Application 2019 & 2032
- Table 38: Venezuela Enterprise Mobility in Retail Industry Revenue (Million) Forecast, by Application 2019 & 2032
- Table 39: Rest of South America Enterprise Mobility in Retail Industry Revenue (Million) Forecast, by Application 2019 & 2032
- Table 40: Global Enterprise Mobility in Retail Industry Revenue Million Forecast, by Country 2019 & 2032
- Table 41: United States Enterprise Mobility in Retail Industry Revenue (Million) Forecast, by Application 2019 & 2032
- Table 42: Canada Enterprise Mobility in Retail Industry Revenue (Million) Forecast, by Application 2019 & 2032
- Table 43: Mexico Enterprise Mobility in Retail Industry Revenue (Million) Forecast, by Application 2019 & 2032
- Table 44: Global Enterprise Mobility in Retail Industry Revenue Million Forecast, by Country 2019 & 2032
- Table 45: United Arab Emirates Enterprise Mobility in Retail Industry Revenue (Million) Forecast, by Application 2019 & 2032
- Table 46: Saudi Arabia Enterprise Mobility in Retail Industry Revenue (Million) Forecast, by Application 2019 & 2032
- Table 47: South Africa Enterprise Mobility in Retail Industry Revenue (Million) Forecast, by Application 2019 & 2032
- Table 48: Rest of Middle East and Africa Enterprise Mobility in Retail Industry Revenue (Million) Forecast, by Application 2019 & 2032
- Table 49: Global Enterprise Mobility in Retail Industry Revenue Million Forecast, by Device 2019 & 2032
- Table 50: Global Enterprise Mobility in Retail Industry Revenue Million Forecast, by Country 2019 & 2032
- Table 51: Global Enterprise Mobility in Retail Industry Revenue Million Forecast, by Device 2019 & 2032
- Table 52: Global Enterprise Mobility in Retail Industry Revenue Million Forecast, by Country 2019 & 2032
- Table 53: Global Enterprise Mobility in Retail Industry Revenue Million Forecast, by Device 2019 & 2032
- Table 54: Global Enterprise Mobility in Retail Industry Revenue Million Forecast, by Country 2019 & 2032
- Table 55: Global Enterprise Mobility in Retail Industry Revenue Million Forecast, by Device 2019 & 2032
- Table 56: Global Enterprise Mobility in Retail Industry Revenue Million Forecast, by Country 2019 & 2032
- Table 57: Global Enterprise Mobility in Retail Industry Revenue Million Forecast, by Device 2019 & 2032
- Table 58: Global Enterprise Mobility in Retail Industry Revenue Million Forecast, by Country 2019 & 2032
Frequently Asked Questions
1. What is the projected Compound Annual Growth Rate (CAGR) of the Enterprise Mobility in Retail Industry?
The projected CAGR is approximately 26.25%.
2. Which companies are prominent players in the Enterprise Mobility in Retail Industry?
Key companies in the market include Workspot Inc , MobileIron Inc, IBM Corporation, Brainvire Infotech Inc, Cisco Systems Inc, Microsoft Corporation, Credencys Solutions Inc, InnoMind Technologies, Gizmeon Inc, VMware Inc, Citrix Systems Inc, SAP SE, Sonata Software.
3. What are the main segments of the Enterprise Mobility in Retail Industry?
The market segments include Device.
4. Can you provide details about the market size?
The market size is estimated to be USD XX Million as of 2022.
5. What are some drivers contributing to market growth?
; Substantial Growth in E-commerce; Increasing Adoption of Bring-your-own-device (BYOD).
6. What are the notable trends driving market growth?
Substantial Growth in E-commerce to Spearhead the Growth.
7. Are there any restraints impacting market growth?
; Security Concerns.
8. Can you provide examples of recent developments in the market?
N/A
9. What pricing options are available for accessing the report?
Pricing options include single-user, multi-user, and enterprise licenses priced at USD 4750, USD 5250, and USD 8750 respectively.
10. Is the market size provided in terms of value or volume?
The market size is provided in terms of value, measured in Million.
11. Are there any specific market keywords associated with the report?
Yes, the market keyword associated with the report is "Enterprise Mobility in Retail Industry," which aids in identifying and referencing the specific market segment covered.
12. How do I determine which pricing option suits my needs best?
The pricing options vary based on user requirements and access needs. Individual users may opt for single-user licenses, while businesses requiring broader access may choose multi-user or enterprise licenses for cost-effective access to the report.
13. Are there any additional resources or data provided in the Enterprise Mobility in Retail Industry report?
While the report offers comprehensive insights, it's advisable to review the specific contents or supplementary materials provided to ascertain if additional resources or data are available.
14. How can I stay updated on further developments or reports in the Enterprise Mobility in Retail Industry?
To stay informed about further developments, trends, and reports in the Enterprise Mobility in Retail Industry, consider subscribing to industry newsletters, following relevant companies and organizations, or regularly checking reputable industry news sources and publications.
Methodology
Step 1 - Identification of Relevant Samples Size from Population Database


Step 2 - Approaches for Defining Global Market Size (Value, Volume* & Price*)

Note*: In applicable scenarios
Step 3 - Data Sources
Primary Research
- Web Analytics
- Survey Reports
- Research Institute
- Latest Research Reports
- Opinion Leaders
Secondary Research
- Annual Reports
- White Paper
- Latest Press Release
- Industry Association
- Paid Database
- Investor Presentations

Step 4 - Data Triangulation
Involves using different sources of information in order to increase the validity of a study
These sources are likely to be stakeholders in a program - participants, other researchers, program staff, other community members, and so on.
Then we put all data in single framework & apply various statistical tools to find out the dynamic on the market.
During the analysis stage, feedback from the stakeholder groups would be compared to determine areas of agreement as well as areas of divergence
