

Key Insights
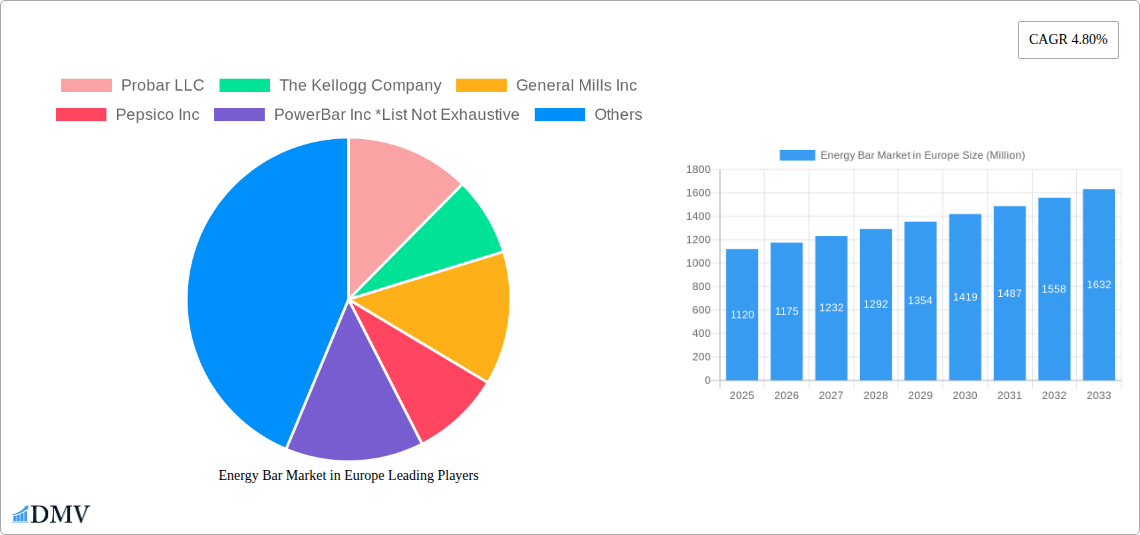
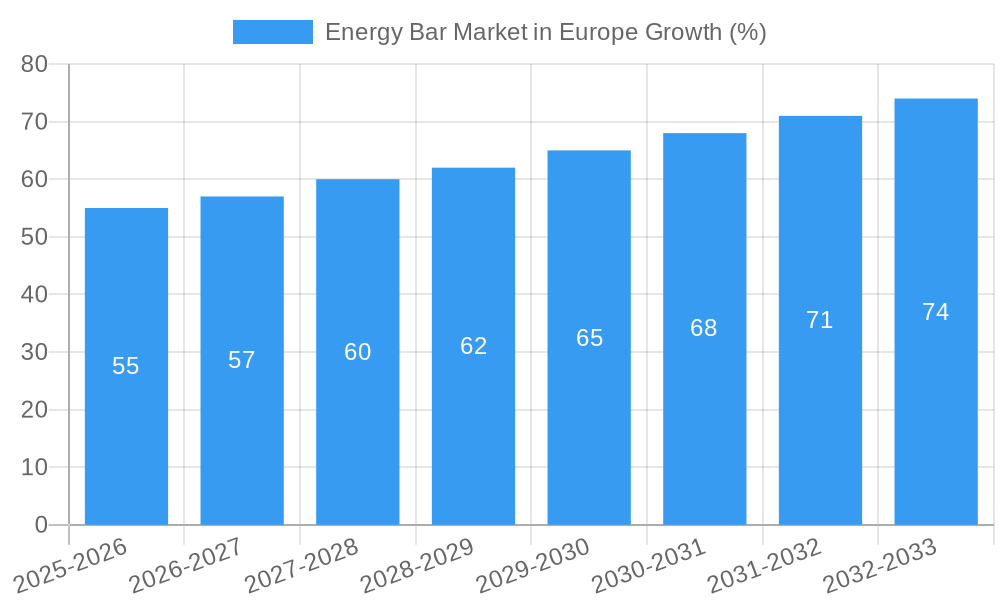
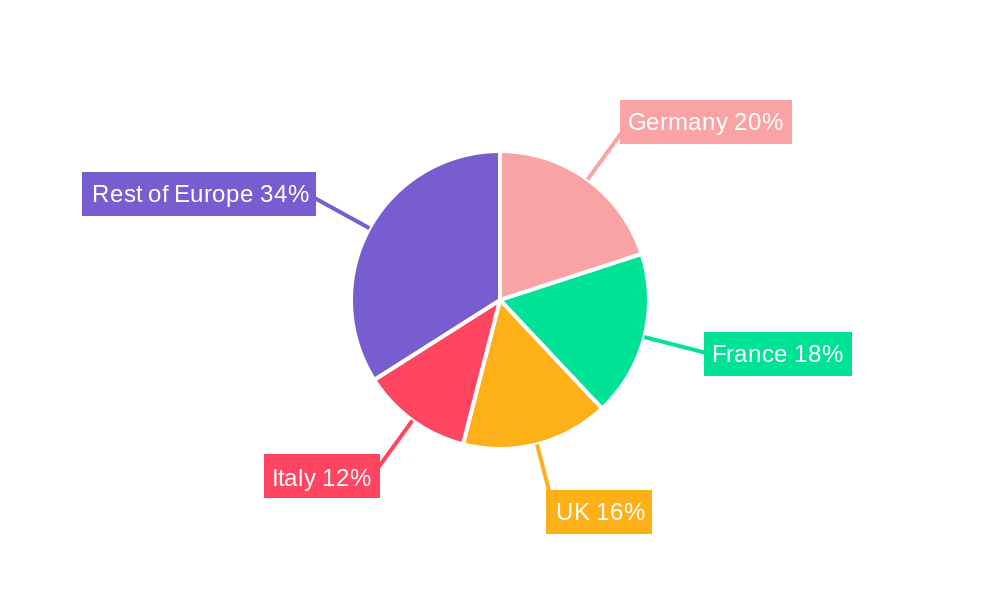
The European energy bar market, valued at €1120 million in 2025, is projected to experience robust growth, driven by increasing health consciousness among consumers and the rising popularity of convenient, on-the-go nutrition solutions. The market's Compound Annual Growth Rate (CAGR) of 4.80% from 2025 to 2033 indicates a steady expansion, fueled by several key factors. The health and wellness trend, particularly among active individuals and fitness enthusiasts, significantly contributes to this growth. The increasing demand for protein-rich, low-sugar, and organic energy bars further propels market expansion. Supermarkets and hypermarkets remain the dominant distribution channel, but online retail stores are witnessing significant growth, reflecting the shift towards e-commerce and convenient online shopping. Established players like Probar LLC, Kellogg's, General Mills, and PepsiCo, alongside emerging brands, are constantly innovating with new flavors, formulations, and packaging to cater to evolving consumer preferences. Competitive pricing strategies and strategic partnerships also play a vital role in shaping market dynamics. While potential economic downturns could restrain growth, the inherent demand for convenient and nutritious snacks suggests sustained long-term market expansion. The regional breakdown reveals strong performance across major European markets like Germany, France, the UK, and Italy, reflecting varying degrees of health consciousness and consumption patterns across these regions.
The projected growth in the European energy bar market hinges on effective product diversification to accommodate specific dietary needs and preferences. An increasing focus on sustainability and ethical sourcing will also influence purchasing decisions. Companies are likely to invest in marketing campaigns that highlight the benefits of their products in terms of energy boost, protein content, and convenience. The market's success will depend on adapting to evolving consumer demands and effectively responding to emerging trends, such as the rise of plant-based and functional energy bars. Maintaining a competitive edge will necessitate innovation in product development, strategic partnerships, and efficient supply chain management. The focus on appealing to environmentally conscious consumers, by utilizing sustainable packaging and ingredients, will be a key differentiator for success in this expanding market segment. This ongoing evolution necessitates a dynamic approach to market positioning and product development.
Energy Bar Market in Europe: A Comprehensive Market Report (2019-2033)
This insightful report provides a detailed analysis of the European energy bar market, covering market trends, competitive landscape, and future growth prospects. The study period spans from 2019 to 2033, with 2025 serving as both the base and estimated year. This comprehensive analysis is crucial for stakeholders, investors, and industry players seeking to understand and capitalize on the opportunities within this dynamic market. The report utilizes rigorous data analysis to project a market size of xx Million by 2033, showcasing significant growth potential.
Energy Bar Market in Europe Market Composition & Trends
This section delves into the intricate composition of the European energy bar market, examining key factors shaping its evolution. We analyze market concentration, revealing the market share distribution amongst key players like Probar LLC, The Kellogg Company, General Mills Inc, Pepsico Inc, and PowerBar Inc, alongside other significant contributors such as QuestNutrition LLC, Oatein, Clif Bar & Company, Nestlé S.A., and Mars, Incorporated. The report further explores innovation catalysts, including the development of new formulations and functional ingredients. Regulatory landscapes and their influence on market dynamics are also examined, including the impact of labeling regulations and health claims. The analysis also encompasses substitute products and their competitive pressures, alongside detailed end-user profiles to understand consumption patterns. Finally, we investigate the significant mergers and acquisitions (M&A) activity within the industry, detailing deal values and their effects on market consolidation. For example, the xx Million acquisition of Bioenergy by Clif Bar & Company demonstrates strategic moves to expand market share. The report also quantifies the market share distribution, showing that the top five players hold approximately xx% of the market.
- Market Concentration: Highly fragmented with a few major players dominating.
- Innovation Catalysts: Focus on organic, plant-based, and high-protein options.
- Regulatory Landscape: EU regulations on labeling and health claims significantly influence product development.
- Substitute Products: Competition from other convenient snacks and nutritional supplements.
- End-User Profiles: Targeting active individuals, athletes, and health-conscious consumers.
- M&A Activity: Consolidation driven by expansion strategies and portfolio diversification.
Energy Bar Market in Europe Industry Evolution
This section provides a comprehensive analysis of the European energy bar market's evolution from 2019 to 2033. We meticulously trace the market's growth trajectory, presenting historical growth rates (2019-2024) and projecting future growth (2025-2033). The analysis encompasses the influence of technological advancements, including innovative manufacturing processes and packaging solutions. We delve into shifting consumer demands, noting increasing preferences for organic, vegan, and gluten-free options. The report highlights the adoption rate of these new product categories and their impact on overall market growth. Specific data points such as compound annual growth rates (CAGR) for different segments are provided, showcasing the dynamism of the market. The increasing preference for healthier snacking options and the rising disposable income contribute significantly to the market's overall growth. The impact of health and wellness trends on consumer choices is also highlighted.
Leading Regions, Countries, or Segments in Energy Bar Market in Europe
This section pinpoints the leading regions, countries, and distribution channels within the European energy bar market. We identify the dominant segment as Supermarkets/Hypermarkets, accounting for approximately xx% of the market share in 2025. This dominance is analyzed through a detailed examination of key contributing factors.
Key Drivers for Supermarkets/Hypermarkets Dominance:
- Extensive Reach and Distribution Networks: Wide accessibility and high consumer foot traffic.
- Economies of Scale: Cost advantages facilitating competitive pricing.
- Established Relationships with Key Players: Strong partnerships with major energy bar manufacturers.
- Promotional Activities and Shelf Space: Strategic marketing and product placement driving sales.
In-depth Analysis: The extensive reach of supermarkets and hypermarkets, coupled with their established distribution networks, provides manufacturers with unrivaled access to a large consumer base. The economies of scale associated with these large retailers enable competitive pricing, further driving market share. The strength of existing relationships between major players and these retailers ensures preferential shelf placement and promotional opportunities, consolidating their dominance.
Energy Bar Market in Europe Product Innovations
The European energy bar market exhibits continuous innovation, driven by consumer demand for healthier and more functional products. Recent product launches feature unique selling propositions such as enhanced protein content, inclusion of superfoods, and organic certifications. Technological advancements, including optimized manufacturing processes that improve texture and shelf life, play a significant role in the market. These innovations cater to the evolving preferences of health-conscious consumers seeking convenient and nutritious energy sources.
Propelling Factors for Energy Bar Market in Europe Growth
Several factors are propelling the growth of the European energy bar market. Technological advancements in manufacturing lead to improved product quality and cost-efficiency. Favorable economic conditions in several European countries contribute to increased consumer spending on convenient and healthy food options. Supportive regulatory frameworks, particularly those encouraging healthy eating habits, further boost market expansion. For example, the increasing emphasis on healthy lifestyles and fitness among consumers is a key driver.
Obstacles in the Energy Bar Market in Europe Market
Despite significant growth potential, the European energy bar market faces challenges. Stringent regulatory requirements related to food labeling and health claims necessitate compliance, leading to increased manufacturing costs. Supply chain disruptions caused by geopolitical instability and logistical bottlenecks can affect product availability and pricing. Intense competition from established and emerging brands creates pressures on profit margins. These factors collectively impact market growth and profitability. For instance, a significant supply chain disruption in 2022 reduced production by xx%, causing a price increase of xx%.
Future Opportunities in Energy Bar Market in Europe
The future of the European energy bar market presents numerous opportunities. Expansion into emerging markets within Europe offers significant growth potential. Technological innovations, particularly in sustainable packaging and novel ingredients, can create new product categories. Consumer trends, such as growing interest in plant-based and functional foods, offer further avenues for innovation. Leveraging these factors will prove crucial in shaping the future trajectory of the market.
Major Players in the Energy Bar Market in Europe Ecosystem
- Probar LLC
- The Kellogg Company
- General Mills Inc
- Pepsico Inc
- PowerBar Inc
- QuestNutrition LLC
- Oatein
- Clif Bar & Company
- Nestlé S.A.
- Mars, Incorporated
Key Developments in Energy Bar Market in Europe Industry
- 2022 (October): Clif Bar & Company acquires a majority stake in Bioenergy, expanding its European presence.
- 2021 (December): Launch of a new range of organic energy bars by [Company Name].
- 2020 (June): [Company Name] implements sustainable packaging for its energy bar products.
- 2019 (March): New regulations on sugar content in energy bars are implemented across the EU. (Note: Further specific dates and details of other key developments need to be added)
Strategic Energy Bar Market in Europe Market Forecast
The European energy bar market is poised for sustained growth, driven by increasing consumer demand for convenient and healthy snacking options. The market will likely witness continued innovation in product formulations and packaging, catering to diverse consumer preferences. Expansion into new market segments and strategic partnerships will play a crucial role in driving future market expansion. The focus on sustainability and ethical sourcing will gain traction, offering significant growth opportunities for businesses committed to environmentally conscious practices.
Energy Bar Market in Europe Segmentation
-
1. Distribution Channel
- 1.1. Supermarkets/Hypermarkets
- 1.2. Convenience Stores
- 1.3. Specialist stores
- 1.4. Online Retail Stores
- 1.5. Other Distribution Channels
Energy Bar Market in Europe Segmentation By Geography
-
1. Europe
- 1.1. Spain
- 1.2. United Kingdom
- 1.3. Germany
- 1.4. France
- 1.5. Italy
- 1.6. Russia
- 1.7. Rest of Europe
Energy Bar Market in Europe REPORT HIGHLIGHTS
| Aspects | Details |
|---|---|
| Study Period | 2019-2033 |
| Base Year | 2024 |
| Estimated Year | 2025 |
| Forecast Period | 2025-2033 |
| Historical Period | 2019-2024 |
| Growth Rate | CAGR of 4.80% from 2019-2033 |
| Segmentation |
|
Table of Contents
- 1. Introduction
- 1.1. Research Scope
- 1.2. Market Segmentation
- 1.3. Research Methodology
- 1.4. Definitions and Assumptions
- 2. Executive Summary
- 2.1. Introduction
- 3. Market Dynamics
- 3.1. Introduction
- 3.2. Market Drivers
- 3.2.1. Increasing Demand for Clean Label Ingredients; Growing Health Consciousness of Consumers
- 3.3. Market Restrains
- 3.3.1. Higher Manufacturing Cost
- 3.4. Market Trends
- 3.4.1. United Kingdom Dominating the Market
- 4. Market Factor Analysis
- 4.1. Porters Five Forces
- 4.2. Supply/Value Chain
- 4.3. PESTEL analysis
- 4.4. Market Entropy
- 4.5. Patent/Trademark Analysis
- 5. Energy Bar Market in Europe Analysis, Insights and Forecast, 2019-2031
- 5.1. Market Analysis, Insights and Forecast - by Distribution Channel
- 5.1.1. Supermarkets/Hypermarkets
- 5.1.2. Convenience Stores
- 5.1.3. Specialist stores
- 5.1.4. Online Retail Stores
- 5.1.5. Other Distribution Channels
- 5.2. Market Analysis, Insights and Forecast - by Region
- 5.2.1. Europe
- 5.1. Market Analysis, Insights and Forecast - by Distribution Channel
- 6. Germany Energy Bar Market in Europe Analysis, Insights and Forecast, 2019-2031
- 7. France Energy Bar Market in Europe Analysis, Insights and Forecast, 2019-2031
- 8. Italy Energy Bar Market in Europe Analysis, Insights and Forecast, 2019-2031
- 9. United Kingdom Energy Bar Market in Europe Analysis, Insights and Forecast, 2019-2031
- 10. Netherlands Energy Bar Market in Europe Analysis, Insights and Forecast, 2019-2031
- 11. Sweden Energy Bar Market in Europe Analysis, Insights and Forecast, 2019-2031
- 12. Rest of Europe Energy Bar Market in Europe Analysis, Insights and Forecast, 2019-2031
- 13. Competitive Analysis
- 13.1. Market Share Analysis 2024
- 13.2. Company Profiles
- 13.2.1 Probar LLC
- 13.2.1.1. Overview
- 13.2.1.2. Products
- 13.2.1.3. SWOT Analysis
- 13.2.1.4. Recent Developments
- 13.2.1.5. Financials (Based on Availability)
- 13.2.2 The Kellogg Company
- 13.2.2.1. Overview
- 13.2.2.2. Products
- 13.2.2.3. SWOT Analysis
- 13.2.2.4. Recent Developments
- 13.2.2.5. Financials (Based on Availability)
- 13.2.3 General Mills Inc
- 13.2.3.1. Overview
- 13.2.3.2. Products
- 13.2.3.3. SWOT Analysis
- 13.2.3.4. Recent Developments
- 13.2.3.5. Financials (Based on Availability)
- 13.2.4 Pepsico Inc
- 13.2.4.1. Overview
- 13.2.4.2. Products
- 13.2.4.3. SWOT Analysis
- 13.2.4.4. Recent Developments
- 13.2.4.5. Financials (Based on Availability)
- 13.2.5 PowerBar Inc *List Not Exhaustive
- 13.2.5.1. Overview
- 13.2.5.2. Products
- 13.2.5.3. SWOT Analysis
- 13.2.5.4. Recent Developments
- 13.2.5.5. Financials (Based on Availability)
- 13.2.6 QuestNutrition LLC
- 13.2.6.1. Overview
- 13.2.6.2. Products
- 13.2.6.3. SWOT Analysis
- 13.2.6.4. Recent Developments
- 13.2.6.5. Financials (Based on Availability)
- 13.2.7 Oatein
- 13.2.7.1. Overview
- 13.2.7.2. Products
- 13.2.7.3. SWOT Analysis
- 13.2.7.4. Recent Developments
- 13.2.7.5. Financials (Based on Availability)
- 13.2.8 Clif Bar & Company
- 13.2.8.1. Overview
- 13.2.8.2. Products
- 13.2.8.3. SWOT Analysis
- 13.2.8.4. Recent Developments
- 13.2.8.5. Financials (Based on Availability)
- 13.2.9 Nestlé S.A.
- 13.2.9.1. Overview
- 13.2.9.2. Products
- 13.2.9.3. SWOT Analysis
- 13.2.9.4. Recent Developments
- 13.2.9.5. Financials (Based on Availability)
- 13.2.10 Mars Incorporated
- 13.2.10.1. Overview
- 13.2.10.2. Products
- 13.2.10.3. SWOT Analysis
- 13.2.10.4. Recent Developments
- 13.2.10.5. Financials (Based on Availability)
- 13.2.1 Probar LLC
List of Figures
- Figure 1: Energy Bar Market in Europe Revenue Breakdown (Million, %) by Product 2024 & 2032
- Figure 2: Energy Bar Market in Europe Share (%) by Company 2024
List of Tables
- Table 1: Energy Bar Market in Europe Revenue Million Forecast, by Region 2019 & 2032
- Table 2: Energy Bar Market in Europe Volume K Tons Forecast, by Region 2019 & 2032
- Table 3: Energy Bar Market in Europe Revenue Million Forecast, by Distribution Channel 2019 & 2032
- Table 4: Energy Bar Market in Europe Volume K Tons Forecast, by Distribution Channel 2019 & 2032
- Table 5: Energy Bar Market in Europe Revenue Million Forecast, by Region 2019 & 2032
- Table 6: Energy Bar Market in Europe Volume K Tons Forecast, by Region 2019 & 2032
- Table 7: Energy Bar Market in Europe Revenue Million Forecast, by Country 2019 & 2032
- Table 8: Energy Bar Market in Europe Volume K Tons Forecast, by Country 2019 & 2032
- Table 9: Germany Energy Bar Market in Europe Revenue (Million) Forecast, by Application 2019 & 2032
- Table 10: Germany Energy Bar Market in Europe Volume (K Tons) Forecast, by Application 2019 & 2032
- Table 11: France Energy Bar Market in Europe Revenue (Million) Forecast, by Application 2019 & 2032
- Table 12: France Energy Bar Market in Europe Volume (K Tons) Forecast, by Application 2019 & 2032
- Table 13: Italy Energy Bar Market in Europe Revenue (Million) Forecast, by Application 2019 & 2032
- Table 14: Italy Energy Bar Market in Europe Volume (K Tons) Forecast, by Application 2019 & 2032
- Table 15: United Kingdom Energy Bar Market in Europe Revenue (Million) Forecast, by Application 2019 & 2032
- Table 16: United Kingdom Energy Bar Market in Europe Volume (K Tons) Forecast, by Application 2019 & 2032
- Table 17: Netherlands Energy Bar Market in Europe Revenue (Million) Forecast, by Application 2019 & 2032
- Table 18: Netherlands Energy Bar Market in Europe Volume (K Tons) Forecast, by Application 2019 & 2032
- Table 19: Sweden Energy Bar Market in Europe Revenue (Million) Forecast, by Application 2019 & 2032
- Table 20: Sweden Energy Bar Market in Europe Volume (K Tons) Forecast, by Application 2019 & 2032
- Table 21: Rest of Europe Energy Bar Market in Europe Revenue (Million) Forecast, by Application 2019 & 2032
- Table 22: Rest of Europe Energy Bar Market in Europe Volume (K Tons) Forecast, by Application 2019 & 2032
- Table 23: Energy Bar Market in Europe Revenue Million Forecast, by Distribution Channel 2019 & 2032
- Table 24: Energy Bar Market in Europe Volume K Tons Forecast, by Distribution Channel 2019 & 2032
- Table 25: Energy Bar Market in Europe Revenue Million Forecast, by Country 2019 & 2032
- Table 26: Energy Bar Market in Europe Volume K Tons Forecast, by Country 2019 & 2032
- Table 27: Spain Energy Bar Market in Europe Revenue (Million) Forecast, by Application 2019 & 2032
- Table 28: Spain Energy Bar Market in Europe Volume (K Tons) Forecast, by Application 2019 & 2032
- Table 29: United Kingdom Energy Bar Market in Europe Revenue (Million) Forecast, by Application 2019 & 2032
- Table 30: United Kingdom Energy Bar Market in Europe Volume (K Tons) Forecast, by Application 2019 & 2032
- Table 31: Germany Energy Bar Market in Europe Revenue (Million) Forecast, by Application 2019 & 2032
- Table 32: Germany Energy Bar Market in Europe Volume (K Tons) Forecast, by Application 2019 & 2032
- Table 33: France Energy Bar Market in Europe Revenue (Million) Forecast, by Application 2019 & 2032
- Table 34: France Energy Bar Market in Europe Volume (K Tons) Forecast, by Application 2019 & 2032
- Table 35: Italy Energy Bar Market in Europe Revenue (Million) Forecast, by Application 2019 & 2032
- Table 36: Italy Energy Bar Market in Europe Volume (K Tons) Forecast, by Application 2019 & 2032
- Table 37: Russia Energy Bar Market in Europe Revenue (Million) Forecast, by Application 2019 & 2032
- Table 38: Russia Energy Bar Market in Europe Volume (K Tons) Forecast, by Application 2019 & 2032
- Table 39: Rest of Europe Energy Bar Market in Europe Revenue (Million) Forecast, by Application 2019 & 2032
- Table 40: Rest of Europe Energy Bar Market in Europe Volume (K Tons) Forecast, by Application 2019 & 2032
Frequently Asked Questions
1. What is the projected Compound Annual Growth Rate (CAGR) of the Energy Bar Market in Europe?
The projected CAGR is approximately 4.80%.
2. Which companies are prominent players in the Energy Bar Market in Europe?
Key companies in the market include Probar LLC, The Kellogg Company, General Mills Inc, Pepsico Inc, PowerBar Inc *List Not Exhaustive, QuestNutrition LLC, Oatein, Clif Bar & Company, Nestlé S.A. , Mars, Incorporated.
3. What are the main segments of the Energy Bar Market in Europe?
The market segments include Distribution Channel.
4. Can you provide details about the market size?
The market size is estimated to be USD 1120 Million as of 2022.
5. What are some drivers contributing to market growth?
Increasing Demand for Clean Label Ingredients; Growing Health Consciousness of Consumers.
6. What are the notable trends driving market growth?
United Kingdom Dominating the Market.
7. Are there any restraints impacting market growth?
Higher Manufacturing Cost.
8. Can you provide examples of recent developments in the market?
Recent developments in the Energy Bar Market in Europe include product launches, mergers and acquisitions, and strategic partnerships. For instance, in 2022, Clif Bar & Company acquired a majority stake in UK-based energy bar manufacturer, Bioenergy. This acquisition expanded Clif Bar's presence in the European market and strengthened its product portfolio.
9. What pricing options are available for accessing the report?
Pricing options include single-user, multi-user, and enterprise licenses priced at USD 4750, USD 5250, and USD 8750 respectively.
10. Is the market size provided in terms of value or volume?
The market size is provided in terms of value, measured in Million and volume, measured in K Tons.
11. Are there any specific market keywords associated with the report?
Yes, the market keyword associated with the report is "Energy Bar Market in Europe," which aids in identifying and referencing the specific market segment covered.
12. How do I determine which pricing option suits my needs best?
The pricing options vary based on user requirements and access needs. Individual users may opt for single-user licenses, while businesses requiring broader access may choose multi-user or enterprise licenses for cost-effective access to the report.
13. Are there any additional resources or data provided in the Energy Bar Market in Europe report?
While the report offers comprehensive insights, it's advisable to review the specific contents or supplementary materials provided to ascertain if additional resources or data are available.
14. How can I stay updated on further developments or reports in the Energy Bar Market in Europe?
To stay informed about further developments, trends, and reports in the Energy Bar Market in Europe, consider subscribing to industry newsletters, following relevant companies and organizations, or regularly checking reputable industry news sources and publications.
Methodology
Step 1 - Identification of Relevant Samples Size from Population Database


Step 2 - Approaches for Defining Global Market Size (Value, Volume* & Price*)

Note*: In applicable scenarios
Step 3 - Data Sources
Primary Research
- Web Analytics
- Survey Reports
- Research Institute
- Latest Research Reports
- Opinion Leaders
Secondary Research
- Annual Reports
- White Paper
- Latest Press Release
- Industry Association
- Paid Database
- Investor Presentations

Step 4 - Data Triangulation
Involves using different sources of information in order to increase the validity of a study
These sources are likely to be stakeholders in a program - participants, other researchers, program staff, other community members, and so on.
Then we put all data in single framework & apply various statistical tools to find out the dynamic on the market.
During the analysis stage, feedback from the stakeholder groups would be compared to determine areas of agreement as well as areas of divergence
