

Key Insights
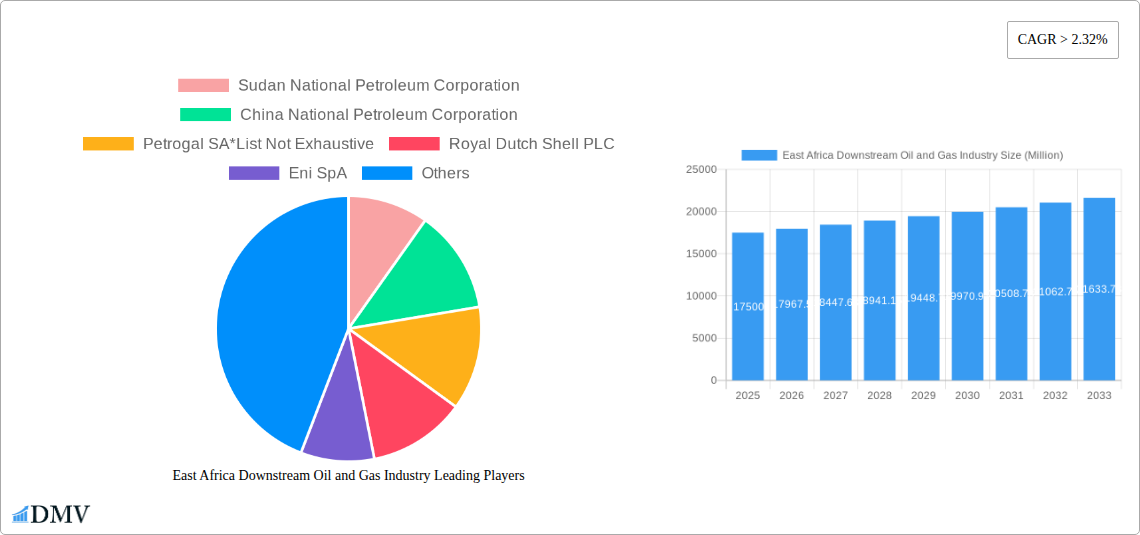
The East African downstream oil and gas industry, valued at $17,500 million in 2025, is projected to experience robust growth, driven by increasing industrialization, urbanization, and a burgeoning transportation sector across the region. Key growth drivers include rising energy demand from expanding populations and economies in Kenya, Tanzania, Uganda, and Sudan. The transportation segment, fueled by the growth of personal vehicles and freight, constitutes a significant portion of the market. Similarly, the industrial sector's increasing reliance on petroleum products for manufacturing and power generation contributes to substantial market demand. While the refined petroleum products segment currently dominates, the petrochemicals sector is poised for significant growth, driven by increasing demand for plastics and other petrochemical-based products. However, challenges remain, including volatile global oil prices, infrastructure limitations hindering efficient distribution, and government regulations impacting profitability. Competition is fierce, with both international giants like Royal Dutch Shell and local players like the National Oil Corporation of Kenya vying for market share. The industry's future hinges on addressing these challenges while capitalizing on the region's economic expansion and growing energy needs.
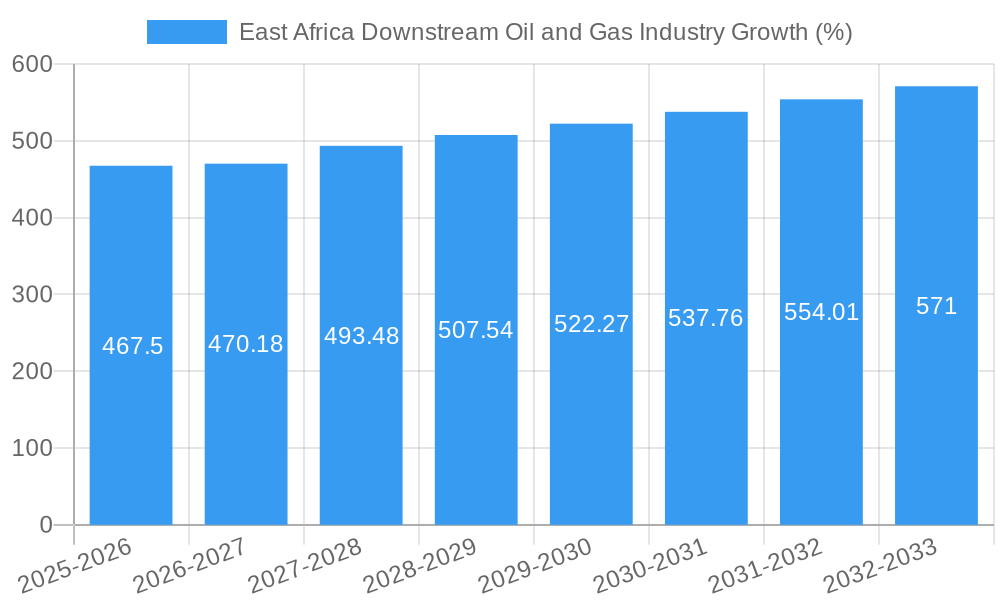
The forecast period (2025-2033) anticipates a CAGR exceeding 2.32%, indicating sustained growth. This positive outlook is further supported by governmental initiatives aimed at improving energy infrastructure and attracting foreign investment. Nevertheless, environmental concerns and the global shift towards renewable energy sources represent potential headwinds. The market segmentation reveals a strong reliance on refined petroleum products, but diversification into petrochemicals and LPG, along with continued investments in infrastructure upgrades, will be crucial for long-term success. The competitive landscape remains dynamic, with both established international players and local companies competing for market dominance. Strategic partnerships and technological advancements will be key factors influencing the industry's trajectory throughout the forecast period.
East Africa Downstream Oil and Gas Industry: A Comprehensive Market Report (2019-2033)
This insightful report provides a detailed analysis of the East Africa downstream oil and gas industry, offering a comprehensive overview of market trends, key players, and future growth prospects. Covering the period 2019-2033, with a base year of 2025 and a forecast period of 2025-2033, this report is an invaluable resource for stakeholders seeking to understand and navigate this dynamic market. The report leverages extensive data analysis to provide actionable insights, focusing on refined petroleum products, lubricants, petrochemicals, and liquefied petroleum gas (LPG) across industrial, transportation, commercial, and household end-user segments. The total market value in 2025 is estimated at XX Million USD and is projected to reach XX Million USD by 2033.
East Africa Downstream Oil and Gas Industry Market Composition & Trends
This section evaluates the competitive landscape, examining market concentration, innovation drivers, regulatory frameworks, substitute products, end-user profiles, and mergers & acquisitions (M&A) activity. The analysis includes market share distribution among key players and quantifies M&A deal values.
- Market Concentration: The East African downstream oil and gas market exhibits a moderately concentrated structure, with a few major international and national players holding significant market share. The report details the market share distribution amongst these key players.
- Innovation Catalysts: Technological advancements, particularly in refining processes and product formulations (e.g., cleaner fuels), are driving innovation. Stringent emission regulations are also pushing the adoption of more environmentally friendly products.
- Regulatory Landscape: Varying regulatory frameworks across East African nations impact market dynamics. The report analyzes the specific regulations in key countries and their implications for industry players.
- Substitute Products: The emergence of biofuels and renewable energy sources presents challenges to traditional fossil fuels. The report assesses the competitive threat posed by these substitutes.
- End-User Profiles: Detailed analysis of end-user consumption patterns across industrial, transportation, commercial, and household sectors, including projected growth in each segment.
- M&A Activities: The report documents significant M&A deals, including the December 2022 acquisition of South Sudanese oil fields by Savannah Energy for USD 1.25 Billion, involving China National Petroleum Corporation and others. The total value of M&A activity during the historical period (2019-2024) is estimated at XX Million USD.
East Africa Downstream Oil and Gas Industry Industry Evolution
This section analyzes the historical and projected growth trajectories of the East African downstream oil and gas market. It examines technological advancements and shifting consumer preferences, providing specific data points on growth rates and adoption metrics for key technologies and product categories. The report meticulously traces the evolution of the industry from 2019 to the projected year 2033, highlighting key trends, including fluctuating oil prices, evolving regulatory landscapes, and the increasing influence of international players. The analysis incorporates data on consumption patterns, infrastructure development, and technological upgrades in refining and distribution networks. The compound annual growth rate (CAGR) for the forecast period (2025-2033) is estimated at xx%.
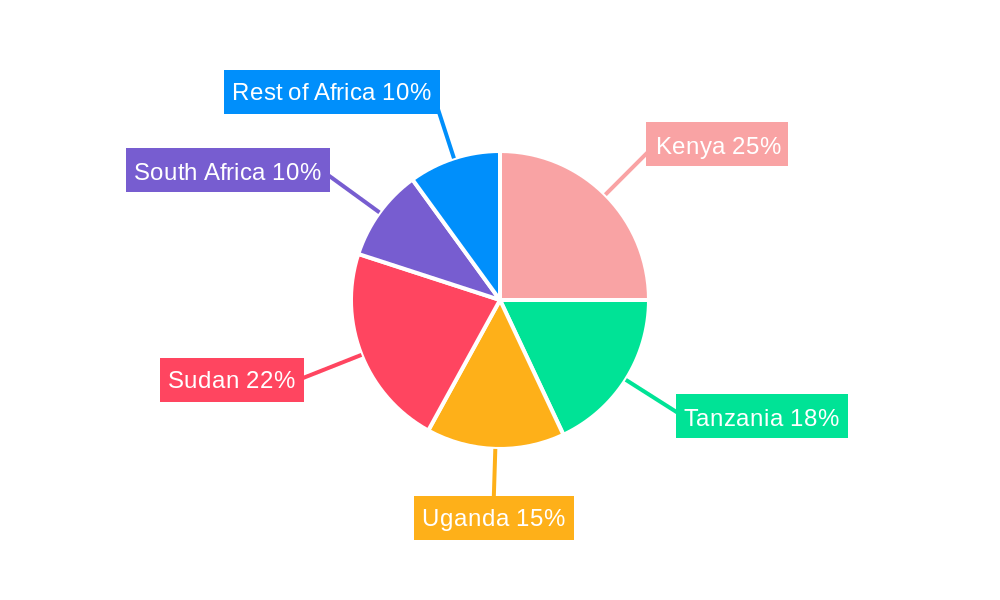
Leading Regions, Countries, or Segments in East Africa Downstream Oil and Gas Industry
This section identifies the leading regions, countries, and segments within the East African downstream oil and gas industry. The analysis is based on market size, growth rate, and key industry drivers.
- Dominant Segments: Refined petroleum products constitute the largest segment, followed by LPG and lubricants. The report provides a detailed breakdown of the market share for each product segment.
- Key Drivers for Dominant Segments:
- Refined Petroleum Products: High demand from the transportation sector and industrial applications.
- LPG: Growing adoption for cooking fuel, particularly in rural areas.
- Lubricants: Demand driven by the growth of the transportation and industrial sectors.
- Dominant Countries: Kenya, Tanzania, and Uganda are identified as key markets, with specific analysis of market dynamics in each country.
- Geographic Factors: The report provides a detailed geographic breakdown of the market, highlighting regional variations in consumption patterns, regulatory landscapes, and infrastructure development.
East Africa Downstream Oil and Gas Industry Product Innovations
Recent innovations in the East African downstream oil and gas industry focus on improving fuel efficiency, reducing emissions, and enhancing product quality. This includes the development of cleaner-burning fuels, advanced lubricants with improved performance characteristics, and the introduction of specialized petrochemical products catering to specific industrial applications. The adoption of these innovations is influenced by government regulations, consumer preferences, and technological advancements in refining and production processes. The shift towards cleaner fuel options is a significant trend, driven by environmental concerns and evolving regulatory frameworks.
Propelling Factors for East Africa Downstream Oil and Gas Industry Growth
Several factors are driving the growth of the East African downstream oil and gas industry. Increased infrastructure investment, particularly in pipeline networks and storage facilities, is enhancing efficiency and capacity. Economic growth across the region is boosting demand for energy, and government initiatives promoting industrialization and urbanization are further fueling market expansion. Furthermore, rising vehicle ownership and industrial activity are contributing to significant growth in fuel consumption.
Obstacles in the East Africa Downstream Oil and Gas Industry Market
The East African downstream oil and gas industry faces challenges such as volatile global oil prices, infrastructure limitations, and competition from renewable energy sources. Regulatory hurdles, including licensing complexities and environmental regulations, also pose significant challenges. Supply chain disruptions, as witnessed in recent years, can negatively affect product availability and market stability, impacting both profitability and consumer access to crucial energy resources. These factors contribute to market uncertainties and require strategic planning by industry stakeholders.
Future Opportunities in East Africa Downstream Oil and Gas Industry
Significant opportunities exist for growth in the East African downstream oil and gas industry. The expanding industrial and transportation sectors offer substantial potential for increased fuel consumption. The development of new infrastructure projects and the increasing adoption of cleaner energy technologies will present new market segments and investment opportunities. Furthermore, focus on improving energy efficiency and reducing reliance on imported refined products will present opportunities for local players to expand their operations.
Major Players in the East Africa Downstream Oil and Gas Industry Ecosystem
- China National Petroleum Corporation
- Eni SpA
- Royal Dutch Shell PLC
- Kenya Petroleum Refineries Ltd (KPRL)
- Total Energies Marketing Kenya
- Shell Kenya
- National Oil Corporation of Kenya (NOCK)
- Oil Libya (Tamoil)
- Sudan National Petroleum Corporation
- Petrogal SA
Key Developments in East Africa Downstream Oil and Gas Industry Industry
- December 2022: Savannah Energy acquires producing oil fields in South Sudan from Petronas for USD 1.25 Billion, partnering with China National Petroleum Corporation, Oil and Natural Gas Corporation (India), and Nilepet (South Sudan). This deal significantly impacts South Sudan's oil production and foreign investment landscape.
Strategic East Africa Downstream Oil and Gas Industry Market Forecast
The East African downstream oil and gas market is poised for continued growth, driven by sustained economic expansion and infrastructure development. While challenges remain, the increasing demand for energy, coupled with strategic investments in refining capacity and distribution networks, promises substantial market expansion in the coming years. Opportunities for growth exist in both traditional and emerging fuel segments, requiring adaptation and innovation to effectively meet evolving consumer preferences and environmental regulations.
East Africa Downstream Oil and Gas Industry Segmentation
- 1. Refineries
- 2. Petrochemicals Plants
-
3. Geography
- 3.1. Mozambique
- 3.2. South Sudan
- 3.3. Kenya
- 3.4. Rest of East Africa
East Africa Downstream Oil and Gas Industry Segmentation By Geography
- 1. Mozambique
- 2. South Sudan
- 3. Kenya
- 4. Rest of East Africa
East Africa Downstream Oil and Gas Industry REPORT HIGHLIGHTS
| Aspects | Details |
|---|---|
| Study Period | 2019-2033 |
| Base Year | 2024 |
| Estimated Year | 2025 |
| Forecast Period | 2025-2033 |
| Historical Period | 2019-2024 |
| Growth Rate | CAGR of > 2.32% from 2019-2033 |
| Segmentation |
|
Table of Contents
- 1. Introduction
- 1.1. Research Scope
- 1.2. Market Segmentation
- 1.3. Research Methodology
- 1.4. Definitions and Assumptions
- 2. Executive Summary
- 2.1. Introduction
- 3. Market Dynamics
- 3.1. Introduction
- 3.2. Market Drivers
- 3.2.1. 4.; Increasing Electricity Demand4.; Rsing Investments in the Coal Industry
- 3.3. Market Restrains
- 3.3.1. 4.; Increasing Installation of Renewable Energy Sources
- 3.4. Market Trends
- 3.4.1. Refinery Capacity to Witness growth
- 4. Market Factor Analysis
- 4.1. Porters Five Forces
- 4.2. Supply/Value Chain
- 4.3. PESTEL analysis
- 4.4. Market Entropy
- 4.5. Patent/Trademark Analysis
- 5. East Africa Downstream Oil and Gas Industry Analysis, Insights and Forecast, 2019-2031
- 5.1. Market Analysis, Insights and Forecast - by Refineries
- 5.2. Market Analysis, Insights and Forecast - by Petrochemicals Plants
- 5.3. Market Analysis, Insights and Forecast - by Geography
- 5.3.1. Mozambique
- 5.3.2. South Sudan
- 5.3.3. Kenya
- 5.3.4. Rest of East Africa
- 5.4. Market Analysis, Insights and Forecast - by Region
- 5.4.1. Mozambique
- 5.4.2. South Sudan
- 5.4.3. Kenya
- 5.4.4. Rest of East Africa
- 5.1. Market Analysis, Insights and Forecast - by Refineries
- 6. Mozambique East Africa Downstream Oil and Gas Industry Analysis, Insights and Forecast, 2019-2031
- 6.1. Market Analysis, Insights and Forecast - by Refineries
- 6.2. Market Analysis, Insights and Forecast - by Petrochemicals Plants
- 6.3. Market Analysis, Insights and Forecast - by Geography
- 6.3.1. Mozambique
- 6.3.2. South Sudan
- 6.3.3. Kenya
- 6.3.4. Rest of East Africa
- 6.1. Market Analysis, Insights and Forecast - by Refineries
- 7. South Sudan East Africa Downstream Oil and Gas Industry Analysis, Insights and Forecast, 2019-2031
- 7.1. Market Analysis, Insights and Forecast - by Refineries
- 7.2. Market Analysis, Insights and Forecast - by Petrochemicals Plants
- 7.3. Market Analysis, Insights and Forecast - by Geography
- 7.3.1. Mozambique
- 7.3.2. South Sudan
- 7.3.3. Kenya
- 7.3.4. Rest of East Africa
- 7.1. Market Analysis, Insights and Forecast - by Refineries
- 8. Kenya East Africa Downstream Oil and Gas Industry Analysis, Insights and Forecast, 2019-2031
- 8.1. Market Analysis, Insights and Forecast - by Refineries
- 8.2. Market Analysis, Insights and Forecast - by Petrochemicals Plants
- 8.3. Market Analysis, Insights and Forecast - by Geography
- 8.3.1. Mozambique
- 8.3.2. South Sudan
- 8.3.3. Kenya
- 8.3.4. Rest of East Africa
- 8.1. Market Analysis, Insights and Forecast - by Refineries
- 9. Rest of East Africa East Africa Downstream Oil and Gas Industry Analysis, Insights and Forecast, 2019-2031
- 9.1. Market Analysis, Insights and Forecast - by Refineries
- 9.2. Market Analysis, Insights and Forecast - by Petrochemicals Plants
- 9.3. Market Analysis, Insights and Forecast - by Geography
- 9.3.1. Mozambique
- 9.3.2. South Sudan
- 9.3.3. Kenya
- 9.3.4. Rest of East Africa
- 9.1. Market Analysis, Insights and Forecast - by Refineries
- 10. South Africa East Africa Downstream Oil and Gas Industry Analysis, Insights and Forecast, 2019-2031
- 11. Sudan East Africa Downstream Oil and Gas Industry Analysis, Insights and Forecast, 2019-2031
- 12. Uganda East Africa Downstream Oil and Gas Industry Analysis, Insights and Forecast, 2019-2031
- 13. Tanzania East Africa Downstream Oil and Gas Industry Analysis, Insights and Forecast, 2019-2031
- 14. Kenya East Africa Downstream Oil and Gas Industry Analysis, Insights and Forecast, 2019-2031
- 15. Rest of Africa East Africa Downstream Oil and Gas Industry Analysis, Insights and Forecast, 2019-2031
- 16. Competitive Analysis
- 16.1. Market Share Analysis 2024
- 16.2. Company Profiles
- 16.2.1 Sudan National Petroleum Corporation
- 16.2.1.1. Overview
- 16.2.1.2. Products
- 16.2.1.3. SWOT Analysis
- 16.2.1.4. Recent Developments
- 16.2.1.5. Financials (Based on Availability)
- 16.2.2 China National Petroleum Corporation
- 16.2.2.1. Overview
- 16.2.2.2. Products
- 16.2.2.3. SWOT Analysis
- 16.2.2.4. Recent Developments
- 16.2.2.5. Financials (Based on Availability)
- 16.2.3 Petrogal SA*List Not Exhaustive
- 16.2.3.1. Overview
- 16.2.3.2. Products
- 16.2.3.3. SWOT Analysis
- 16.2.3.4. Recent Developments
- 16.2.3.5. Financials (Based on Availability)
- 16.2.4 Royal Dutch Shell PLC
- 16.2.4.1. Overview
- 16.2.4.2. Products
- 16.2.4.3. SWOT Analysis
- 16.2.4.4. Recent Developments
- 16.2.4.5. Financials (Based on Availability)
- 16.2.5 Eni SpA
- 16.2.5.1. Overview
- 16.2.5.2. Products
- 16.2.5.3. SWOT Analysis
- 16.2.5.4. Recent Developments
- 16.2.5.5. Financials (Based on Availability)
- 16.2.6 Kenya Petroleum Refineries Ltd (KPRL)
- 16.2.6.1. Overview
- 16.2.6.2. Products
- 16.2.6.3. SWOT Analysis
- 16.2.6.4. Recent Developments
- 16.2.6.5. Financials (Based on Availability)
- 16.2.7 Total Energies Marketing Kenya
- 16.2.7.1. Overview
- 16.2.7.2. Products
- 16.2.7.3. SWOT Analysis
- 16.2.7.4. Recent Developments
- 16.2.7.5. Financials (Based on Availability)
- 16.2.8 Shell Kenya
- 16.2.8.1. Overview
- 16.2.8.2. Products
- 16.2.8.3. SWOT Analysis
- 16.2.8.4. Recent Developments
- 16.2.8.5. Financials (Based on Availability)
- 16.2.9 National Oil Corporation of Kenya (NOCK)
- 16.2.9.1. Overview
- 16.2.9.2. Products
- 16.2.9.3. SWOT Analysis
- 16.2.9.4. Recent Developments
- 16.2.9.5. Financials (Based on Availability)
- 16.2.10 Oil Libya (Tamoil)
- 16.2.10.1. Overview
- 16.2.10.2. Products
- 16.2.10.3. SWOT Analysis
- 16.2.10.4. Recent Developments
- 16.2.10.5. Financials (Based on Availability)
- 16.2.1 Sudan National Petroleum Corporation
List of Figures
- Figure 1: East Africa Downstream Oil and Gas Industry Revenue Breakdown (Million, %) by Product 2024 & 2032
- Figure 2: East Africa Downstream Oil and Gas Industry Share (%) by Company 2024
List of Tables
- Table 1: East Africa Downstream Oil and Gas Industry Revenue Million Forecast, by Region 2019 & 2032
- Table 2: East Africa Downstream Oil and Gas Industry Volume liter Forecast, by Region 2019 & 2032
- Table 3: East Africa Downstream Oil and Gas Industry Revenue Million Forecast, by Refineries 2019 & 2032
- Table 4: East Africa Downstream Oil and Gas Industry Volume liter Forecast, by Refineries 2019 & 2032
- Table 5: East Africa Downstream Oil and Gas Industry Revenue Million Forecast, by Petrochemicals Plants 2019 & 2032
- Table 6: East Africa Downstream Oil and Gas Industry Volume liter Forecast, by Petrochemicals Plants 2019 & 2032
- Table 7: East Africa Downstream Oil and Gas Industry Revenue Million Forecast, by Geography 2019 & 2032
- Table 8: East Africa Downstream Oil and Gas Industry Volume liter Forecast, by Geography 2019 & 2032
- Table 9: East Africa Downstream Oil and Gas Industry Revenue Million Forecast, by Region 2019 & 2032
- Table 10: East Africa Downstream Oil and Gas Industry Volume liter Forecast, by Region 2019 & 2032
- Table 11: East Africa Downstream Oil and Gas Industry Revenue Million Forecast, by Country 2019 & 2032
- Table 12: East Africa Downstream Oil and Gas Industry Volume liter Forecast, by Country 2019 & 2032
- Table 13: South Africa East Africa Downstream Oil and Gas Industry Revenue (Million) Forecast, by Application 2019 & 2032
- Table 14: South Africa East Africa Downstream Oil and Gas Industry Volume (liter ) Forecast, by Application 2019 & 2032
- Table 15: Sudan East Africa Downstream Oil and Gas Industry Revenue (Million) Forecast, by Application 2019 & 2032
- Table 16: Sudan East Africa Downstream Oil and Gas Industry Volume (liter ) Forecast, by Application 2019 & 2032
- Table 17: Uganda East Africa Downstream Oil and Gas Industry Revenue (Million) Forecast, by Application 2019 & 2032
- Table 18: Uganda East Africa Downstream Oil and Gas Industry Volume (liter ) Forecast, by Application 2019 & 2032
- Table 19: Tanzania East Africa Downstream Oil and Gas Industry Revenue (Million) Forecast, by Application 2019 & 2032
- Table 20: Tanzania East Africa Downstream Oil and Gas Industry Volume (liter ) Forecast, by Application 2019 & 2032
- Table 21: Kenya East Africa Downstream Oil and Gas Industry Revenue (Million) Forecast, by Application 2019 & 2032
- Table 22: Kenya East Africa Downstream Oil and Gas Industry Volume (liter ) Forecast, by Application 2019 & 2032
- Table 23: Rest of Africa East Africa Downstream Oil and Gas Industry Revenue (Million) Forecast, by Application 2019 & 2032
- Table 24: Rest of Africa East Africa Downstream Oil and Gas Industry Volume (liter ) Forecast, by Application 2019 & 2032
- Table 25: East Africa Downstream Oil and Gas Industry Revenue Million Forecast, by Refineries 2019 & 2032
- Table 26: East Africa Downstream Oil and Gas Industry Volume liter Forecast, by Refineries 2019 & 2032
- Table 27: East Africa Downstream Oil and Gas Industry Revenue Million Forecast, by Petrochemicals Plants 2019 & 2032
- Table 28: East Africa Downstream Oil and Gas Industry Volume liter Forecast, by Petrochemicals Plants 2019 & 2032
- Table 29: East Africa Downstream Oil and Gas Industry Revenue Million Forecast, by Geography 2019 & 2032
- Table 30: East Africa Downstream Oil and Gas Industry Volume liter Forecast, by Geography 2019 & 2032
- Table 31: East Africa Downstream Oil and Gas Industry Revenue Million Forecast, by Country 2019 & 2032
- Table 32: East Africa Downstream Oil and Gas Industry Volume liter Forecast, by Country 2019 & 2032
- Table 33: East Africa Downstream Oil and Gas Industry Revenue Million Forecast, by Refineries 2019 & 2032
- Table 34: East Africa Downstream Oil and Gas Industry Volume liter Forecast, by Refineries 2019 & 2032
- Table 35: East Africa Downstream Oil and Gas Industry Revenue Million Forecast, by Petrochemicals Plants 2019 & 2032
- Table 36: East Africa Downstream Oil and Gas Industry Volume liter Forecast, by Petrochemicals Plants 2019 & 2032
- Table 37: East Africa Downstream Oil and Gas Industry Revenue Million Forecast, by Geography 2019 & 2032
- Table 38: East Africa Downstream Oil and Gas Industry Volume liter Forecast, by Geography 2019 & 2032
- Table 39: East Africa Downstream Oil and Gas Industry Revenue Million Forecast, by Country 2019 & 2032
- Table 40: East Africa Downstream Oil and Gas Industry Volume liter Forecast, by Country 2019 & 2032
- Table 41: East Africa Downstream Oil and Gas Industry Revenue Million Forecast, by Refineries 2019 & 2032
- Table 42: East Africa Downstream Oil and Gas Industry Volume liter Forecast, by Refineries 2019 & 2032
- Table 43: East Africa Downstream Oil and Gas Industry Revenue Million Forecast, by Petrochemicals Plants 2019 & 2032
- Table 44: East Africa Downstream Oil and Gas Industry Volume liter Forecast, by Petrochemicals Plants 2019 & 2032
- Table 45: East Africa Downstream Oil and Gas Industry Revenue Million Forecast, by Geography 2019 & 2032
- Table 46: East Africa Downstream Oil and Gas Industry Volume liter Forecast, by Geography 2019 & 2032
- Table 47: East Africa Downstream Oil and Gas Industry Revenue Million Forecast, by Country 2019 & 2032
- Table 48: East Africa Downstream Oil and Gas Industry Volume liter Forecast, by Country 2019 & 2032
- Table 49: East Africa Downstream Oil and Gas Industry Revenue Million Forecast, by Refineries 2019 & 2032
- Table 50: East Africa Downstream Oil and Gas Industry Volume liter Forecast, by Refineries 2019 & 2032
- Table 51: East Africa Downstream Oil and Gas Industry Revenue Million Forecast, by Petrochemicals Plants 2019 & 2032
- Table 52: East Africa Downstream Oil and Gas Industry Volume liter Forecast, by Petrochemicals Plants 2019 & 2032
- Table 53: East Africa Downstream Oil and Gas Industry Revenue Million Forecast, by Geography 2019 & 2032
- Table 54: East Africa Downstream Oil and Gas Industry Volume liter Forecast, by Geography 2019 & 2032
- Table 55: East Africa Downstream Oil and Gas Industry Revenue Million Forecast, by Country 2019 & 2032
- Table 56: East Africa Downstream Oil and Gas Industry Volume liter Forecast, by Country 2019 & 2032
Frequently Asked Questions
1. What is the projected Compound Annual Growth Rate (CAGR) of the East Africa Downstream Oil and Gas Industry?
The projected CAGR is approximately > 2.32%.
2. Which companies are prominent players in the East Africa Downstream Oil and Gas Industry?
Key companies in the market include Sudan National Petroleum Corporation, China National Petroleum Corporation, Petrogal SA*List Not Exhaustive, Royal Dutch Shell PLC, Eni SpA, Kenya Petroleum Refineries Ltd (KPRL) , Total Energies Marketing Kenya , Shell Kenya , National Oil Corporation of Kenya (NOCK) , Oil Libya (Tamoil).
3. What are the main segments of the East Africa Downstream Oil and Gas Industry?
The market segments include Refineries, Petrochemicals Plants, Geography.
4. Can you provide details about the market size?
The market size is estimated to be USD 17500 Million as of 2022.
5. What are some drivers contributing to market growth?
4.; Increasing Electricity Demand4.; Rsing Investments in the Coal Industry.
6. What are the notable trends driving market growth?
Refinery Capacity to Witness growth.
7. Are there any restraints impacting market growth?
4.; Increasing Installation of Renewable Energy Sources.
8. Can you provide examples of recent developments in the market?
In December 2022, Savannah Energy declared the acquisition of producing oil fields in South Sudan from Malaysian state oil and gas company Petronas. The investment is valued at USD 1.25 billion. The other partners include the international energy company, the China National Petroleum Corporation, India's flagship energy major, the Oil and Natural Gas Corporation, and South Sudan's national oil and gas company, Nilepet.
9. What pricing options are available for accessing the report?
Pricing options include single-user, multi-user, and enterprise licenses priced at USD 4750, USD 5250, and USD 8750 respectively.
10. Is the market size provided in terms of value or volume?
The market size is provided in terms of value, measured in Million and volume, measured in liter .
11. Are there any specific market keywords associated with the report?
Yes, the market keyword associated with the report is "East Africa Downstream Oil and Gas Industry," which aids in identifying and referencing the specific market segment covered.
12. How do I determine which pricing option suits my needs best?
The pricing options vary based on user requirements and access needs. Individual users may opt for single-user licenses, while businesses requiring broader access may choose multi-user or enterprise licenses for cost-effective access to the report.
13. Are there any additional resources or data provided in the East Africa Downstream Oil and Gas Industry report?
While the report offers comprehensive insights, it's advisable to review the specific contents or supplementary materials provided to ascertain if additional resources or data are available.
14. How can I stay updated on further developments or reports in the East Africa Downstream Oil and Gas Industry?
To stay informed about further developments, trends, and reports in the East Africa Downstream Oil and Gas Industry, consider subscribing to industry newsletters, following relevant companies and organizations, or regularly checking reputable industry news sources and publications.
Methodology
Step 1 - Identification of Relevant Samples Size from Population Database


Step 2 - Approaches for Defining Global Market Size (Value, Volume* & Price*)

Note*: In applicable scenarios
Step 3 - Data Sources
Primary Research
- Web Analytics
- Survey Reports
- Research Institute
- Latest Research Reports
- Opinion Leaders
Secondary Research
- Annual Reports
- White Paper
- Latest Press Release
- Industry Association
- Paid Database
- Investor Presentations

Step 4 - Data Triangulation
Involves using different sources of information in order to increase the validity of a study
These sources are likely to be stakeholders in a program - participants, other researchers, program staff, other community members, and so on.
Then we put all data in single framework & apply various statistical tools to find out the dynamic on the market.
During the analysis stage, feedback from the stakeholder groups would be compared to determine areas of agreement as well as areas of divergence
