

Key Insights
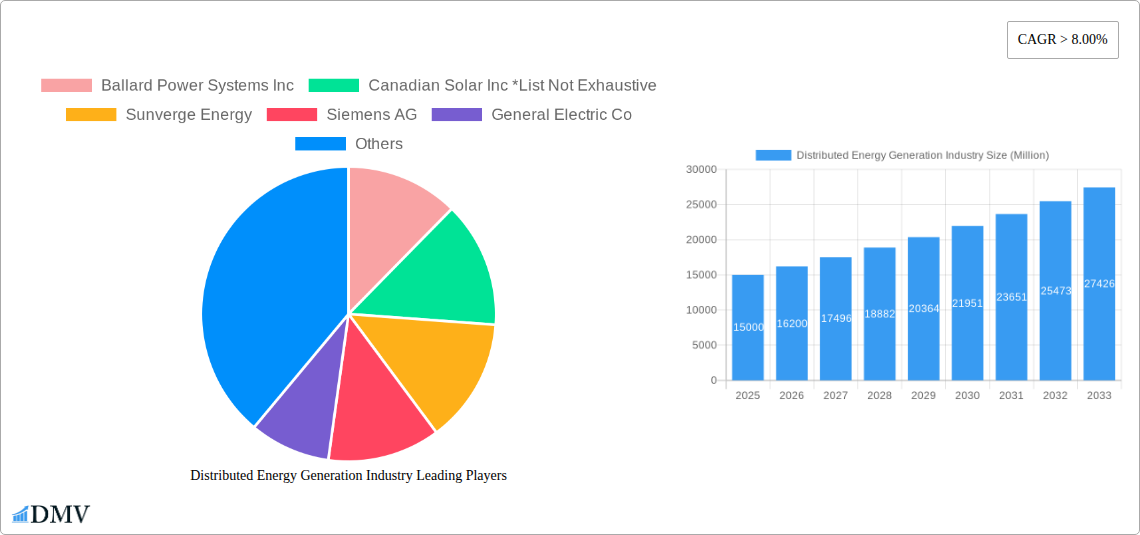
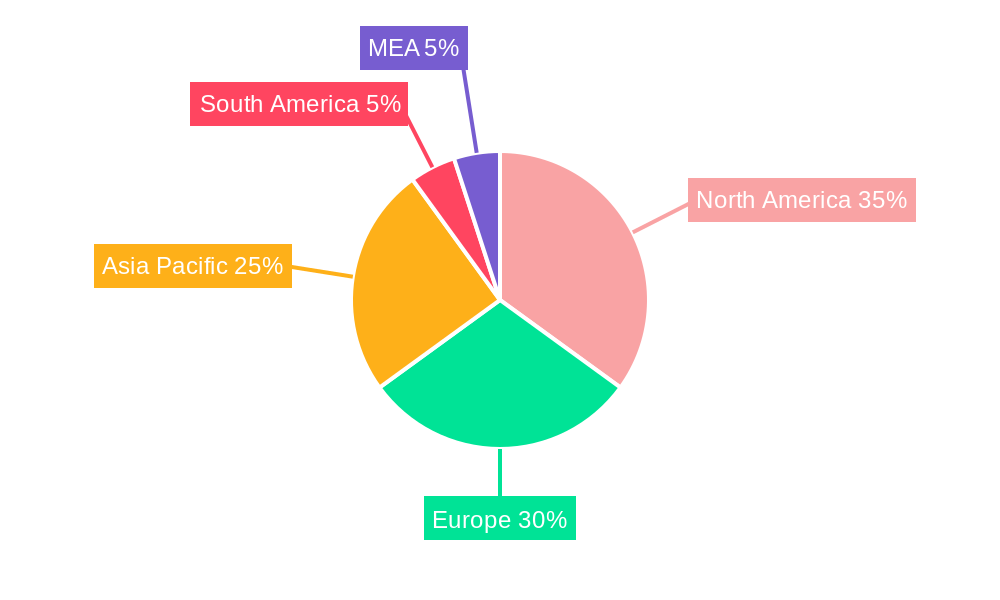
The distributed energy generation (DEG) market is experiencing robust growth, driven by increasing demand for reliable and sustainable energy sources. A compound annual growth rate (CAGR) exceeding 8% from 2019 to 2033 signifies a significant expansion of this sector. Key drivers include the rising adoption of renewable energy technologies like solar PV and natural gas gensets, coupled with growing concerns about energy security and grid stability. Furthermore, the increasing integration of microgrids, offering localized energy resilience, is fueling market expansion. Technological advancements, such as improved battery storage solutions and more efficient generation technologies, are also contributing to this growth. While regulatory hurdles and fluctuating energy prices pose some challenges, the long-term outlook for the DEG market remains optimistic, supported by government incentives and corporate sustainability initiatives. The market is segmented by technology, with solar PV, diesel and natural gas gensets currently holding significant shares. However, the microgrid segment is anticipated to experience substantial growth due to its advantages in enhancing energy independence and minimizing reliance on centralized grids. Geographically, North America and Europe are presently leading the market, followed by the Asia-Pacific region, which is poised for significant expansion in the coming years. The presence of major players like Ballard Power Systems, Canadian Solar, and Siemens underscores the competitive landscape and the industry’s potential for further innovation.
This dynamic market landscape presents numerous opportunities for both established companies and new entrants. Strategic partnerships and technological collaborations are becoming increasingly important in accelerating innovation and market penetration. The focus is shifting towards developing integrated and smart energy solutions that incorporate energy storage, demand-side management, and advanced grid technologies. This integrated approach is crucial for optimizing the performance and reliability of DEG systems and ensuring seamless integration with existing energy infrastructure. Future market growth will depend heavily on overcoming regulatory barriers, further reducing the cost of renewable energy technologies, and expanding the deployment of microgrids in both urban and rural areas. The continued development and adoption of smart grid technologies will play a vital role in managing the increasing complexity of distributed energy resources and ensuring grid stability and resilience.
Distributed Energy Generation Industry Market Report: 2019-2033
This comprehensive report provides an in-depth analysis of the Distributed Energy Generation (DEG) industry, offering valuable insights for stakeholders seeking to navigate this rapidly evolving market. With a study period spanning 2019-2033, a base year of 2025, and a forecast period of 2025-2033, this report leverages historical data (2019-2024) to project future trends and opportunities within the DEG sector. The report's findings are crucial for strategic decision-making, investment strategies, and understanding the competitive landscape. The total market size in 2025 is estimated at $XXX Million.
Distributed Energy Generation Industry Market Composition & Trends
This section delves into the intricate structure of the DEG market, analyzing key aspects that shape its trajectory. We evaluate market concentration, revealing the share held by major players and identifying potential areas for consolidation. Innovation catalysts, such as advancements in battery storage and solar photovoltaic (PV) technology, are meticulously examined, alongside the influence of regulatory landscapes and the presence of substitute products like centralized power generation. End-user profiles, ranging from residential consumers to large industrial facilities, are characterized to understand their distinct needs and preferences. Finally, the report explores the landscape of mergers and acquisitions (M&A) within the DEG sector, analyzing deal values and their implications for market dynamics.
- Market Share Distribution: Solar PV holds approximately 40% of the market share in 2025, followed by Diesel Gensets at 25% and Natural Gas Gensets at 20%. Microgrids and other technologies account for the remaining 15%.
- M&A Activity: Over the historical period, M&A deal values totaled approximately $XX Million, indicating significant consolidation in the market. The average deal size has increased by xx% over the past five years.
- Key Players: Ballard Power Systems Inc, Canadian Solar Inc, Sunverge Energy, Siemens AG, General Electric Co, Schneider Electric SE, Caterpillar Inc, Fuelcell Energy Inc, Cummins Inc, Ansaldo Energia SpA, Capstone Turbine Corporation, Bloom Energy.
Distributed Energy Generation Industry Industry Evolution
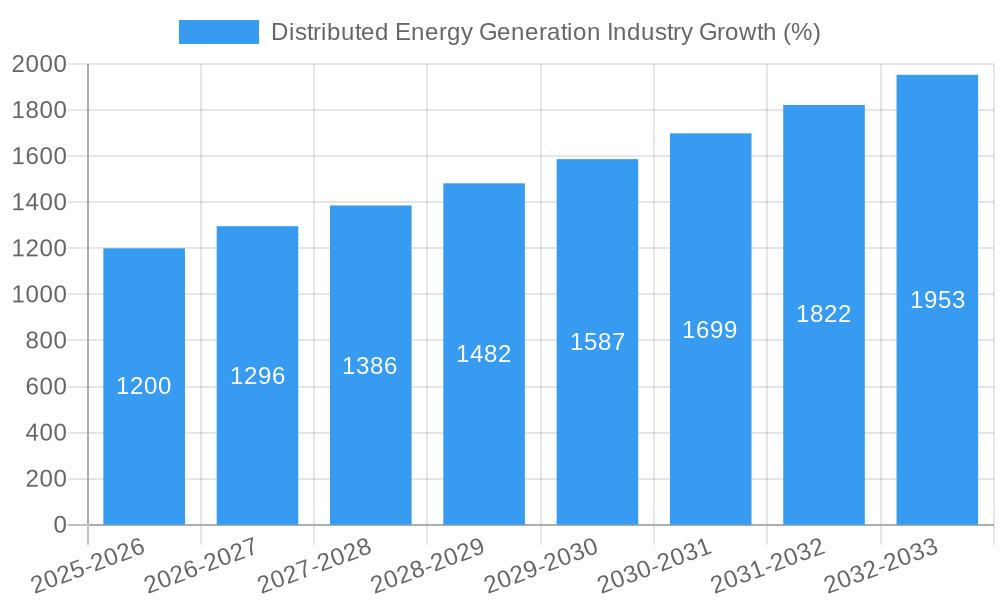
This section traces the evolution of the DEG industry, examining its growth trajectories, technological advancements, and the shifting demands of consumers. Detailed analysis includes specific data points illustrating growth rates and adoption metrics across various DEG technologies. The transition from traditional centralized generation to distributed models is analyzed, including the impact of factors such as rising energy costs, increasing concerns about climate change, and the desire for energy independence. The report explores the increasing adoption of renewable energy sources within DEG systems and the role of smart grid technologies in optimizing energy distribution and management. Growth is projected to reach $XXX Million by 2033, indicating a Compound Annual Growth Rate (CAGR) of xx%. Significant growth is anticipated in the adoption of solar PV and microgrid technologies, fueled by supportive government policies and decreasing technology costs.
Leading Regions, Countries, or Segments in Distributed Energy Generation Industry
This section identifies the dominant regions, countries, and segments within the DEG market, providing a detailed analysis of the factors contributing to their leading positions. The analysis will focus on specific technologies (Solar PV, Diesel Gensets, Natural Gas Gensets, Microgrids, Other Technologies) to determine the leading technology and its regional distribution.
- Solar PV: The leading region for Solar PV is [Region Name], driven by [Key Driver 1, e.g., substantial government subsidies] and [Key Driver 2, e.g., high solar irradiance].
- Diesel Gensets: [Region/Country] leads in Diesel Gensets due to [Key Driver 1, e.g., existing infrastructure] and [Key Driver 2, e.g., remote locations with limited grid access].
- Natural Gas Gensets: [Region/Country] dominates Natural Gas Gensets due to [Key Driver 1, e.g., abundant natural gas resources] and [Key Driver 2, e.g., supportive regulatory framework].
- Microgrids: [Region/Country] shows strong growth in Microgrids driven by [Key Driver 1, e.g., increased grid instability] and [Key Driver 2, e.g., resilience requirements].
- Other Technologies: This category displays significant growth potential in [Region/Country] due to innovation in [Specific Technology].
Distributed Energy Generation Industry Product Innovations
The DEG industry is characterized by continuous innovation, leading to enhanced product performance, increased efficiency, and reduced costs. Recent innovations include advancements in solar PV technology, improved battery storage solutions, and the development of more efficient and reliable microgrid control systems. These advancements have expanded the applications of DEG systems, making them more accessible and cost-effective for a wider range of consumers and businesses. Unique selling propositions (USPs) focus on reduced carbon footprints, enhanced energy independence, and improved grid reliability.
Propelling Factors for Distributed Energy Generation Industry Growth
Several factors are driving the growth of the DEG industry. Technological advancements, such as increased efficiency and reduced costs of renewable energy technologies, are a major catalyst. Government policies promoting renewable energy adoption, including financial incentives and regulatory frameworks, further stimulate growth. Economic factors, such as rising electricity prices and the desire for energy independence, also play a crucial role.
Obstacles in the Distributed Energy Generation Industry Market
Despite the significant growth potential, the DEG industry faces several challenges. Regulatory hurdles, including complex permitting processes and inconsistent policies across different regions, can hinder deployment. Supply chain disruptions can impact the availability of key components, leading to project delays and increased costs. Intense competition among DEG providers can also put downward pressure on pricing and profitability.
Future Opportunities in Distributed Energy Generation Industry
The future of the DEG industry is promising. Emerging markets in developing economies present significant growth opportunities. Technological innovations, such as advancements in energy storage and smart grid technologies, will further enhance the efficiency and reliability of DEG systems. Growing consumer demand for sustainable and reliable energy sources will also fuel market expansion.
Major Players in the Distributed Energy Generation Industry Ecosystem
- Ballard Power Systems Inc
- Canadian Solar Inc
- Sunverge Energy
- Siemens AG
- General Electric Co
- Schneider Electric SE
- Caterpillar Inc
- Fuelcell Energy Inc
- Cummins Inc
- Ansaldo Energia SpA
- Capstone Turbine Corporation
- Bloom Energy
Key Developments in Distributed Energy Generation Industry Industry
- December 2022: Bangalore Electricity Supply Company Limited (BESCOM) commenced Phase 2 of its grid-connected rooftop solar scheme, aiming to install 10 MW of solar capacity, as mandated by the Union Ministry of New and Renewable Energy (MNRE). This initiative significantly boosts distributed solar generation in India.
- November 2022: Michigan's distributed generation program experienced a 37% increase, adding 3,709 customers and 14,446 installations. This highlights the growing adoption of distributed generation, primarily solar, for residential energy needs.
Strategic Distributed Energy Generation Industry Market Forecast
The DEG industry is poised for substantial growth in the coming years. Continued technological advancements, supportive government policies, and increasing consumer demand for sustainable energy solutions will fuel market expansion. The growing integration of renewable energy sources and smart grid technologies will enhance the efficiency and reliability of DEG systems, creating new opportunities for market participants. The market is expected to experience significant growth, driven by a combination of factors including technological advancements, supportive policies, and rising energy costs.
Distributed Energy Generation Industry Segmentation
-
1. Technology
- 1.1. Solar PV
- 1.2. Diesel Gensets
- 1.3. Natural Gas Gensets
- 1.4. Microgrids
- 1.5. Other Technologies
Distributed Energy Generation Industry Segmentation By Geography
- 1. North America
- 2. Europe
- 3. Asia Pacific
- 4. South America
- 5. Middle East and Africa
Distributed Energy Generation Industry REPORT HIGHLIGHTS
| Aspects | Details |
|---|---|
| Study Period | 2019-2033 |
| Base Year | 2024 |
| Estimated Year | 2025 |
| Forecast Period | 2025-2033 |
| Historical Period | 2019-2024 |
| Growth Rate | CAGR of > 8.00% from 2019-2033 |
| Segmentation |
|
Table of Contents
- 1. Introduction
- 1.1. Research Scope
- 1.2. Market Segmentation
- 1.3. Research Methodology
- 1.4. Definitions and Assumptions
- 2. Executive Summary
- 2.1. Introduction
- 3. Market Dynamics
- 3.1. Introduction
- 3.2. Market Drivers
- 3.2.1. 4.; Global Energy Transition Toward Renewables4.; The Rollout of New Technologies in Many Developed Countries
- 3.3. Market Restrains
- 3.3.1. 4.; The Technology's Exorbitant Costs and Environmental Impacts
- 3.4. Market Trends
- 3.4.1. Solar PV to Dominate the Market
- 4. Market Factor Analysis
- 4.1. Porters Five Forces
- 4.2. Supply/Value Chain
- 4.3. PESTEL analysis
- 4.4. Market Entropy
- 4.5. Patent/Trademark Analysis
- 5. Global Distributed Energy Generation Industry Analysis, Insights and Forecast, 2019-2031
- 5.1. Market Analysis, Insights and Forecast - by Technology
- 5.1.1. Solar PV
- 5.1.2. Diesel Gensets
- 5.1.3. Natural Gas Gensets
- 5.1.4. Microgrids
- 5.1.5. Other Technologies
- 5.2. Market Analysis, Insights and Forecast - by Region
- 5.2.1. North America
- 5.2.2. Europe
- 5.2.3. Asia Pacific
- 5.2.4. South America
- 5.2.5. Middle East and Africa
- 5.1. Market Analysis, Insights and Forecast - by Technology
- 6. North America Distributed Energy Generation Industry Analysis, Insights and Forecast, 2019-2031
- 6.1. Market Analysis, Insights and Forecast - by Technology
- 6.1.1. Solar PV
- 6.1.2. Diesel Gensets
- 6.1.3. Natural Gas Gensets
- 6.1.4. Microgrids
- 6.1.5. Other Technologies
- 6.1. Market Analysis, Insights and Forecast - by Technology
- 7. Europe Distributed Energy Generation Industry Analysis, Insights and Forecast, 2019-2031
- 7.1. Market Analysis, Insights and Forecast - by Technology
- 7.1.1. Solar PV
- 7.1.2. Diesel Gensets
- 7.1.3. Natural Gas Gensets
- 7.1.4. Microgrids
- 7.1.5. Other Technologies
- 7.1. Market Analysis, Insights and Forecast - by Technology
- 8. Asia Pacific Distributed Energy Generation Industry Analysis, Insights and Forecast, 2019-2031
- 8.1. Market Analysis, Insights and Forecast - by Technology
- 8.1.1. Solar PV
- 8.1.2. Diesel Gensets
- 8.1.3. Natural Gas Gensets
- 8.1.4. Microgrids
- 8.1.5. Other Technologies
- 8.1. Market Analysis, Insights and Forecast - by Technology
- 9. South America Distributed Energy Generation Industry Analysis, Insights and Forecast, 2019-2031
- 9.1. Market Analysis, Insights and Forecast - by Technology
- 9.1.1. Solar PV
- 9.1.2. Diesel Gensets
- 9.1.3. Natural Gas Gensets
- 9.1.4. Microgrids
- 9.1.5. Other Technologies
- 9.1. Market Analysis, Insights and Forecast - by Technology
- 10. Middle East and Africa Distributed Energy Generation Industry Analysis, Insights and Forecast, 2019-2031
- 10.1. Market Analysis, Insights and Forecast - by Technology
- 10.1.1. Solar PV
- 10.1.2. Diesel Gensets
- 10.1.3. Natural Gas Gensets
- 10.1.4. Microgrids
- 10.1.5. Other Technologies
- 10.1. Market Analysis, Insights and Forecast - by Technology
- 11. North America Distributed Energy Generation Industry Analysis, Insights and Forecast, 2019-2031
- 11.1. Market Analysis, Insights and Forecast - By Country/Sub-region
- 11.1.1 United States
- 11.1.2 Canada
- 11.1.3 Mexico
- 12. Europe Distributed Energy Generation Industry Analysis, Insights and Forecast, 2019-2031
- 12.1. Market Analysis, Insights and Forecast - By Country/Sub-region
- 12.1.1 Germany
- 12.1.2 United Kingdom
- 12.1.3 France
- 12.1.4 Spain
- 12.1.5 Italy
- 12.1.6 Spain
- 12.1.7 Belgium
- 12.1.8 Netherland
- 12.1.9 Nordics
- 12.1.10 Rest of Europe
- 13. Asia Pacific Distributed Energy Generation Industry Analysis, Insights and Forecast, 2019-2031
- 13.1. Market Analysis, Insights and Forecast - By Country/Sub-region
- 13.1.1 China
- 13.1.2 Japan
- 13.1.3 India
- 13.1.4 South Korea
- 13.1.5 Southeast Asia
- 13.1.6 Australia
- 13.1.7 Indonesia
- 13.1.8 Phillipes
- 13.1.9 Singapore
- 13.1.10 Thailandc
- 13.1.11 Rest of Asia Pacific
- 14. South America Distributed Energy Generation Industry Analysis, Insights and Forecast, 2019-2031
- 14.1. Market Analysis, Insights and Forecast - By Country/Sub-region
- 14.1.1 Brazil
- 14.1.2 Argentina
- 14.1.3 Peru
- 14.1.4 Chile
- 14.1.5 Colombia
- 14.1.6 Ecuador
- 14.1.7 Venezuela
- 14.1.8 Rest of South America
- 15. North America Distributed Energy Generation Industry Analysis, Insights and Forecast, 2019-2031
- 15.1. Market Analysis, Insights and Forecast - By Country/Sub-region
- 15.1.1 United States
- 15.1.2 Canada
- 15.1.3 Mexico
- 16. MEA Distributed Energy Generation Industry Analysis, Insights and Forecast, 2019-2031
- 16.1. Market Analysis, Insights and Forecast - By Country/Sub-region
- 16.1.1 United Arab Emirates
- 16.1.2 Saudi Arabia
- 16.1.3 South Africa
- 16.1.4 Rest of Middle East and Africa
- 17. Competitive Analysis
- 17.1. Global Market Share Analysis 2024
- 17.2. Company Profiles
- 17.2.1 Ballard Power Systems Inc
- 17.2.1.1. Overview
- 17.2.1.2. Products
- 17.2.1.3. SWOT Analysis
- 17.2.1.4. Recent Developments
- 17.2.1.5. Financials (Based on Availability)
- 17.2.2 Canadian Solar Inc *List Not Exhaustive
- 17.2.2.1. Overview
- 17.2.2.2. Products
- 17.2.2.3. SWOT Analysis
- 17.2.2.4. Recent Developments
- 17.2.2.5. Financials (Based on Availability)
- 17.2.3 Sunverge Energy
- 17.2.3.1. Overview
- 17.2.3.2. Products
- 17.2.3.3. SWOT Analysis
- 17.2.3.4. Recent Developments
- 17.2.3.5. Financials (Based on Availability)
- 17.2.4 Siemens AG
- 17.2.4.1. Overview
- 17.2.4.2. Products
- 17.2.4.3. SWOT Analysis
- 17.2.4.4. Recent Developments
- 17.2.4.5. Financials (Based on Availability)
- 17.2.5 General Electric Co
- 17.2.5.1. Overview
- 17.2.5.2. Products
- 17.2.5.3. SWOT Analysis
- 17.2.5.4. Recent Developments
- 17.2.5.5. Financials (Based on Availability)
- 17.2.6 Schneider Electric SE
- 17.2.6.1. Overview
- 17.2.6.2. Products
- 17.2.6.3. SWOT Analysis
- 17.2.6.4. Recent Developments
- 17.2.6.5. Financials (Based on Availability)
- 17.2.7 Caterpillar Inc
- 17.2.7.1. Overview
- 17.2.7.2. Products
- 17.2.7.3. SWOT Analysis
- 17.2.7.4. Recent Developments
- 17.2.7.5. Financials (Based on Availability)
- 17.2.8 Fuelcell Energy Inc
- 17.2.8.1. Overview
- 17.2.8.2. Products
- 17.2.8.3. SWOT Analysis
- 17.2.8.4. Recent Developments
- 17.2.8.5. Financials (Based on Availability)
- 17.2.9 Cummins Inc
- 17.2.9.1. Overview
- 17.2.9.2. Products
- 17.2.9.3. SWOT Analysis
- 17.2.9.4. Recent Developments
- 17.2.9.5. Financials (Based on Availability)
- 17.2.10 Ansaldo Energia SpA
- 17.2.10.1. Overview
- 17.2.10.2. Products
- 17.2.10.3. SWOT Analysis
- 17.2.10.4. Recent Developments
- 17.2.10.5. Financials (Based on Availability)
- 17.2.11 Capstone Turbine Corporation
- 17.2.11.1. Overview
- 17.2.11.2. Products
- 17.2.11.3. SWOT Analysis
- 17.2.11.4. Recent Developments
- 17.2.11.5. Financials (Based on Availability)
- 17.2.12 Bloom Energy
- 17.2.12.1. Overview
- 17.2.12.2. Products
- 17.2.12.3. SWOT Analysis
- 17.2.12.4. Recent Developments
- 17.2.12.5. Financials (Based on Availability)
- 17.2.1 Ballard Power Systems Inc
List of Figures
- Figure 1: Global Distributed Energy Generation Industry Revenue Breakdown (Million, %) by Region 2024 & 2032
- Figure 2: North America Distributed Energy Generation Industry Revenue (Million), by Country 2024 & 2032
- Figure 3: North America Distributed Energy Generation Industry Revenue Share (%), by Country 2024 & 2032
- Figure 4: Europe Distributed Energy Generation Industry Revenue (Million), by Country 2024 & 2032
- Figure 5: Europe Distributed Energy Generation Industry Revenue Share (%), by Country 2024 & 2032
- Figure 6: Asia Pacific Distributed Energy Generation Industry Revenue (Million), by Country 2024 & 2032
- Figure 7: Asia Pacific Distributed Energy Generation Industry Revenue Share (%), by Country 2024 & 2032
- Figure 8: South America Distributed Energy Generation Industry Revenue (Million), by Country 2024 & 2032
- Figure 9: South America Distributed Energy Generation Industry Revenue Share (%), by Country 2024 & 2032
- Figure 10: North America Distributed Energy Generation Industry Revenue (Million), by Country 2024 & 2032
- Figure 11: North America Distributed Energy Generation Industry Revenue Share (%), by Country 2024 & 2032
- Figure 12: MEA Distributed Energy Generation Industry Revenue (Million), by Country 2024 & 2032
- Figure 13: MEA Distributed Energy Generation Industry Revenue Share (%), by Country 2024 & 2032
- Figure 14: North America Distributed Energy Generation Industry Revenue (Million), by Technology 2024 & 2032
- Figure 15: North America Distributed Energy Generation Industry Revenue Share (%), by Technology 2024 & 2032
- Figure 16: North America Distributed Energy Generation Industry Revenue (Million), by Country 2024 & 2032
- Figure 17: North America Distributed Energy Generation Industry Revenue Share (%), by Country 2024 & 2032
- Figure 18: Europe Distributed Energy Generation Industry Revenue (Million), by Technology 2024 & 2032
- Figure 19: Europe Distributed Energy Generation Industry Revenue Share (%), by Technology 2024 & 2032
- Figure 20: Europe Distributed Energy Generation Industry Revenue (Million), by Country 2024 & 2032
- Figure 21: Europe Distributed Energy Generation Industry Revenue Share (%), by Country 2024 & 2032
- Figure 22: Asia Pacific Distributed Energy Generation Industry Revenue (Million), by Technology 2024 & 2032
- Figure 23: Asia Pacific Distributed Energy Generation Industry Revenue Share (%), by Technology 2024 & 2032
- Figure 24: Asia Pacific Distributed Energy Generation Industry Revenue (Million), by Country 2024 & 2032
- Figure 25: Asia Pacific Distributed Energy Generation Industry Revenue Share (%), by Country 2024 & 2032
- Figure 26: South America Distributed Energy Generation Industry Revenue (Million), by Technology 2024 & 2032
- Figure 27: South America Distributed Energy Generation Industry Revenue Share (%), by Technology 2024 & 2032
- Figure 28: South America Distributed Energy Generation Industry Revenue (Million), by Country 2024 & 2032
- Figure 29: South America Distributed Energy Generation Industry Revenue Share (%), by Country 2024 & 2032
- Figure 30: Middle East and Africa Distributed Energy Generation Industry Revenue (Million), by Technology 2024 & 2032
- Figure 31: Middle East and Africa Distributed Energy Generation Industry Revenue Share (%), by Technology 2024 & 2032
- Figure 32: Middle East and Africa Distributed Energy Generation Industry Revenue (Million), by Country 2024 & 2032
- Figure 33: Middle East and Africa Distributed Energy Generation Industry Revenue Share (%), by Country 2024 & 2032
List of Tables
- Table 1: Global Distributed Energy Generation Industry Revenue Million Forecast, by Region 2019 & 2032
- Table 2: Global Distributed Energy Generation Industry Revenue Million Forecast, by Technology 2019 & 2032
- Table 3: Global Distributed Energy Generation Industry Revenue Million Forecast, by Region 2019 & 2032
- Table 4: Global Distributed Energy Generation Industry Revenue Million Forecast, by Country 2019 & 2032
- Table 5: United States Distributed Energy Generation Industry Revenue (Million) Forecast, by Application 2019 & 2032
- Table 6: Canada Distributed Energy Generation Industry Revenue (Million) Forecast, by Application 2019 & 2032
- Table 7: Mexico Distributed Energy Generation Industry Revenue (Million) Forecast, by Application 2019 & 2032
- Table 8: Global Distributed Energy Generation Industry Revenue Million Forecast, by Country 2019 & 2032
- Table 9: Germany Distributed Energy Generation Industry Revenue (Million) Forecast, by Application 2019 & 2032
- Table 10: United Kingdom Distributed Energy Generation Industry Revenue (Million) Forecast, by Application 2019 & 2032
- Table 11: France Distributed Energy Generation Industry Revenue (Million) Forecast, by Application 2019 & 2032
- Table 12: Spain Distributed Energy Generation Industry Revenue (Million) Forecast, by Application 2019 & 2032
- Table 13: Italy Distributed Energy Generation Industry Revenue (Million) Forecast, by Application 2019 & 2032
- Table 14: Spain Distributed Energy Generation Industry Revenue (Million) Forecast, by Application 2019 & 2032
- Table 15: Belgium Distributed Energy Generation Industry Revenue (Million) Forecast, by Application 2019 & 2032
- Table 16: Netherland Distributed Energy Generation Industry Revenue (Million) Forecast, by Application 2019 & 2032
- Table 17: Nordics Distributed Energy Generation Industry Revenue (Million) Forecast, by Application 2019 & 2032
- Table 18: Rest of Europe Distributed Energy Generation Industry Revenue (Million) Forecast, by Application 2019 & 2032
- Table 19: Global Distributed Energy Generation Industry Revenue Million Forecast, by Country 2019 & 2032
- Table 20: China Distributed Energy Generation Industry Revenue (Million) Forecast, by Application 2019 & 2032
- Table 21: Japan Distributed Energy Generation Industry Revenue (Million) Forecast, by Application 2019 & 2032
- Table 22: India Distributed Energy Generation Industry Revenue (Million) Forecast, by Application 2019 & 2032
- Table 23: South Korea Distributed Energy Generation Industry Revenue (Million) Forecast, by Application 2019 & 2032
- Table 24: Southeast Asia Distributed Energy Generation Industry Revenue (Million) Forecast, by Application 2019 & 2032
- Table 25: Australia Distributed Energy Generation Industry Revenue (Million) Forecast, by Application 2019 & 2032
- Table 26: Indonesia Distributed Energy Generation Industry Revenue (Million) Forecast, by Application 2019 & 2032
- Table 27: Phillipes Distributed Energy Generation Industry Revenue (Million) Forecast, by Application 2019 & 2032
- Table 28: Singapore Distributed Energy Generation Industry Revenue (Million) Forecast, by Application 2019 & 2032
- Table 29: Thailandc Distributed Energy Generation Industry Revenue (Million) Forecast, by Application 2019 & 2032
- Table 30: Rest of Asia Pacific Distributed Energy Generation Industry Revenue (Million) Forecast, by Application 2019 & 2032
- Table 31: Global Distributed Energy Generation Industry Revenue Million Forecast, by Country 2019 & 2032
- Table 32: Brazil Distributed Energy Generation Industry Revenue (Million) Forecast, by Application 2019 & 2032
- Table 33: Argentina Distributed Energy Generation Industry Revenue (Million) Forecast, by Application 2019 & 2032
- Table 34: Peru Distributed Energy Generation Industry Revenue (Million) Forecast, by Application 2019 & 2032
- Table 35: Chile Distributed Energy Generation Industry Revenue (Million) Forecast, by Application 2019 & 2032
- Table 36: Colombia Distributed Energy Generation Industry Revenue (Million) Forecast, by Application 2019 & 2032
- Table 37: Ecuador Distributed Energy Generation Industry Revenue (Million) Forecast, by Application 2019 & 2032
- Table 38: Venezuela Distributed Energy Generation Industry Revenue (Million) Forecast, by Application 2019 & 2032
- Table 39: Rest of South America Distributed Energy Generation Industry Revenue (Million) Forecast, by Application 2019 & 2032
- Table 40: Global Distributed Energy Generation Industry Revenue Million Forecast, by Country 2019 & 2032
- Table 41: United States Distributed Energy Generation Industry Revenue (Million) Forecast, by Application 2019 & 2032
- Table 42: Canada Distributed Energy Generation Industry Revenue (Million) Forecast, by Application 2019 & 2032
- Table 43: Mexico Distributed Energy Generation Industry Revenue (Million) Forecast, by Application 2019 & 2032
- Table 44: Global Distributed Energy Generation Industry Revenue Million Forecast, by Country 2019 & 2032
- Table 45: United Arab Emirates Distributed Energy Generation Industry Revenue (Million) Forecast, by Application 2019 & 2032
- Table 46: Saudi Arabia Distributed Energy Generation Industry Revenue (Million) Forecast, by Application 2019 & 2032
- Table 47: South Africa Distributed Energy Generation Industry Revenue (Million) Forecast, by Application 2019 & 2032
- Table 48: Rest of Middle East and Africa Distributed Energy Generation Industry Revenue (Million) Forecast, by Application 2019 & 2032
- Table 49: Global Distributed Energy Generation Industry Revenue Million Forecast, by Technology 2019 & 2032
- Table 50: Global Distributed Energy Generation Industry Revenue Million Forecast, by Country 2019 & 2032
- Table 51: Global Distributed Energy Generation Industry Revenue Million Forecast, by Technology 2019 & 2032
- Table 52: Global Distributed Energy Generation Industry Revenue Million Forecast, by Country 2019 & 2032
- Table 53: Global Distributed Energy Generation Industry Revenue Million Forecast, by Technology 2019 & 2032
- Table 54: Global Distributed Energy Generation Industry Revenue Million Forecast, by Country 2019 & 2032
- Table 55: Global Distributed Energy Generation Industry Revenue Million Forecast, by Technology 2019 & 2032
- Table 56: Global Distributed Energy Generation Industry Revenue Million Forecast, by Country 2019 & 2032
- Table 57: Global Distributed Energy Generation Industry Revenue Million Forecast, by Technology 2019 & 2032
- Table 58: Global Distributed Energy Generation Industry Revenue Million Forecast, by Country 2019 & 2032
Frequently Asked Questions
1. What is the projected Compound Annual Growth Rate (CAGR) of the Distributed Energy Generation Industry?
The projected CAGR is approximately > 8.00%.
2. Which companies are prominent players in the Distributed Energy Generation Industry?
Key companies in the market include Ballard Power Systems Inc, Canadian Solar Inc *List Not Exhaustive, Sunverge Energy, Siemens AG, General Electric Co, Schneider Electric SE, Caterpillar Inc, Fuelcell Energy Inc, Cummins Inc, Ansaldo Energia SpA, Capstone Turbine Corporation, Bloom Energy.
3. What are the main segments of the Distributed Energy Generation Industry?
The market segments include Technology.
4. Can you provide details about the market size?
The market size is estimated to be USD XX Million as of 2022.
5. What are some drivers contributing to market growth?
4.; Global Energy Transition Toward Renewables4.; The Rollout of New Technologies in Many Developed Countries.
6. What are the notable trends driving market growth?
Solar PV to Dominate the Market.
7. Are there any restraints impacting market growth?
4.; The Technology's Exorbitant Costs and Environmental Impacts.
8. Can you provide examples of recent developments in the market?
December 2022: Phase 2 of the grid-connected rooftop solar scheme was commenced by Bangalore Electricity Supply Company Limited (BESCOM), which was expected to focus on the installation of solar panels. BESCOM was given a mandate to install 10 MW of capacity by the Union Ministry of New and Renewable Energy (MNRE) to promote distributed energy generation.
9. What pricing options are available for accessing the report?
Pricing options include single-user, multi-user, and enterprise licenses priced at USD 4750, USD 5250, and USD 8750 respectively.
10. Is the market size provided in terms of value or volume?
The market size is provided in terms of value, measured in Million.
11. Are there any specific market keywords associated with the report?
Yes, the market keyword associated with the report is "Distributed Energy Generation Industry," which aids in identifying and referencing the specific market segment covered.
12. How do I determine which pricing option suits my needs best?
The pricing options vary based on user requirements and access needs. Individual users may opt for single-user licenses, while businesses requiring broader access may choose multi-user or enterprise licenses for cost-effective access to the report.
13. Are there any additional resources or data provided in the Distributed Energy Generation Industry report?
While the report offers comprehensive insights, it's advisable to review the specific contents or supplementary materials provided to ascertain if additional resources or data are available.
14. How can I stay updated on further developments or reports in the Distributed Energy Generation Industry?
To stay informed about further developments, trends, and reports in the Distributed Energy Generation Industry, consider subscribing to industry newsletters, following relevant companies and organizations, or regularly checking reputable industry news sources and publications.
Methodology
Step 1 - Identification of Relevant Samples Size from Population Database


Step 2 - Approaches for Defining Global Market Size (Value, Volume* & Price*)

Note*: In applicable scenarios
Step 3 - Data Sources
Primary Research
- Web Analytics
- Survey Reports
- Research Institute
- Latest Research Reports
- Opinion Leaders
Secondary Research
- Annual Reports
- White Paper
- Latest Press Release
- Industry Association
- Paid Database
- Investor Presentations

Step 4 - Data Triangulation
Involves using different sources of information in order to increase the validity of a study
These sources are likely to be stakeholders in a program - participants, other researchers, program staff, other community members, and so on.
Then we put all data in single framework & apply various statistical tools to find out the dynamic on the market.
During the analysis stage, feedback from the stakeholder groups would be compared to determine areas of agreement as well as areas of divergence
