

Key Insights
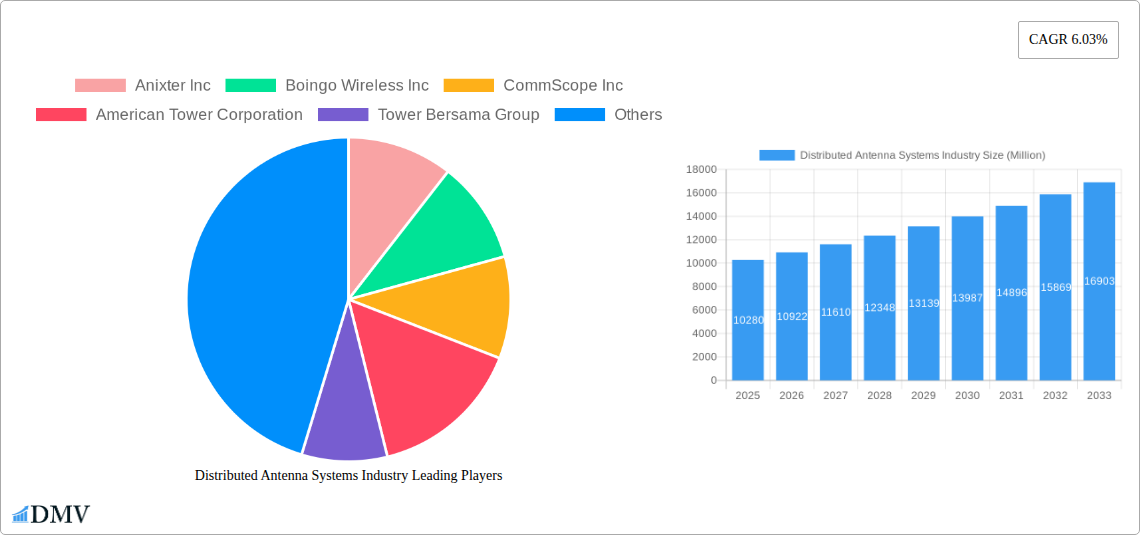
The Distributed Antenna Systems (DAS) market is experiencing robust growth, projected to reach $10.28 billion in 2025 and maintain a Compound Annual Growth Rate (CAGR) of 6.03% from 2025 to 2033. This expansion is fueled by the increasing demand for reliable and high-speed wireless connectivity across diverse sectors. The surge in mobile data consumption, coupled with the proliferation of 5G networks, is a key driver. Businesses across various verticals, including manufacturing, healthcare, and transportation, are increasingly adopting DAS solutions to enhance indoor coverage and capacity, ensuring seamless communication and operational efficiency. Furthermore, the growing adoption of Internet of Things (IoT) devices and the expansion of smart city initiatives are contributing significantly to market growth. The market is segmented by application (enterprise DAS, public safety DAS, others), type (active, passive, digital, hybrid), and end-user, reflecting the diverse deployment scenarios and technological advancements within the industry. The active DAS segment currently dominates due to its superior performance and flexibility, but the digital and hybrid segments are expected to witness significant growth fueled by technological advancements and cost efficiencies. Competition is intense, with major players like Anixter, Boingo Wireless, CommScope, and American Tower Corporation vying for market share through technological innovation, strategic partnerships, and geographical expansion. The North American and Asia-Pacific regions are expected to lead the market, driven by high technological adoption and substantial investments in infrastructure development.
Despite the positive outlook, the DAS market faces some challenges. High initial investment costs associated with DAS infrastructure deployment can act as a restraint, particularly for smaller businesses. Regulatory hurdles and standardization issues across different regions can also impact market growth. However, ongoing technological advancements, such as the development of more cost-effective and energy-efficient DAS solutions, are expected to mitigate these challenges and further fuel market expansion in the coming years. The emergence of innovative deployment models, like cloud-based DAS management platforms, is streamlining operations and enhancing the overall value proposition, making DAS more accessible and attractive to a wider range of customers. The long-term outlook for the DAS market remains overwhelmingly positive, driven by the ever-increasing need for robust and reliable wireless connectivity.
Distributed Antenna Systems (DAS) Industry Report: 2019-2033
This comprehensive report provides an in-depth analysis of the Distributed Antenna Systems (DAS) industry, offering valuable insights for stakeholders seeking to navigate this rapidly evolving market. The report covers the period 2019-2033, with a focus on the forecast period 2025-2033, using 2025 as the base and estimated year. The market is segmented by application (Enterprise DAS, Public Safety DAS, Other Applications), type (Active, Passive, Digital, Hybrid), and end-user (Manufacturing, Healthcare, Government, Transportation, Sports and Entertainment, Telecommunications, Other End-Users). Key players analyzed include Anixter Inc, Boingo Wireless Inc, CommScope Inc, American Tower Corporation, Tower Bersama Group, Corning Inc, TE Connectivity Ltd, Comba Telecom Systems Holdings Ltd, Antenna Products Corporation, Cobham PLC, and SOLiD Inc. The market is projected to reach xx Million by 2033.
Distributed Antenna Systems Industry Market Composition & Trends
This section delves into the competitive landscape of the DAS industry, examining market concentration, innovation drivers, regulatory frameworks, substitute technologies, and end-user behavior. We analyze mergers and acquisitions (M&A) activity, providing insights into deal values and their impact on market share distribution. The market is characterized by a moderately concentrated landscape, with a few major players holding significant market share. However, the emergence of innovative technologies and new entrants is fostering increased competition.
- Market Concentration: The top 5 players account for approximately xx% of the global market share in 2025.
- Innovation Catalysts: The demand for 5G and improved indoor coverage is a major driver of innovation.
- Regulatory Landscape: Government regulations regarding spectrum allocation and network infrastructure significantly influence market growth.
- Substitute Products: While DAS is currently the dominant solution for enhanced coverage, alternative technologies are emerging and pose a potential threat.
- End-User Profiles: The Manufacturing, Healthcare, and Telecommunications sectors are key end-users, driving significant demand.
- M&A Activity: The total value of M&A deals in the DAS industry from 2019 to 2024 was approximately xx Million. Significant deals included [Specific examples of deals and their impact].

Distributed Antenna Systems Industry Industry Evolution
This section traces the evolution of the DAS industry, analyzing market growth trajectories, technological advancements, and shifting consumer demands. The industry experienced significant growth from 2019-2024, with a Compound Annual Growth Rate (CAGR) of xx%. This growth is projected to continue, with a forecasted CAGR of xx% during 2025-2033, driven primarily by the increasing adoption of 5G and the expanding need for seamless connectivity across various sectors. Technological advancements, such as the development of more efficient and cost-effective DAS solutions, further fuel market expansion. Consumer demand for reliable and high-speed connectivity in diverse settings, including stadiums, hospitals, and transportation hubs, underpins this growth trajectory. Specific data points highlighting adoption metrics in key sectors are included within the full report.
Leading Regions, Countries, or Segments in Distributed Antenna Systems Industry
This section identifies the dominant regions, countries, and segments within the DAS market. North America and Europe currently hold the largest market share due to high 5G adoption rates and advanced infrastructure. However, the Asia-Pacific region is experiencing rapid growth fueled by increasing smartphone penetration and infrastructure investments.
- Key Drivers:
- North America: High 5G deployment, robust telecommunications infrastructure, and strong regulatory support.
- Europe: Significant investments in 5G networks, coupled with stringent regulatory frameworks promoting connectivity.
- Asia-Pacific: Rapid urbanization, increasing smartphone penetration, and supportive government policies.
- Dominant Segments: The Enterprise DAS segment is the largest, driven by the need for reliable indoor connectivity in commercial buildings. Public Safety DAS is experiencing significant growth driven by the demand for enhanced communication capabilities for emergency responders. Active DAS systems hold the largest market share due to their superior performance capabilities.
Distributed Antenna Systems Industry Product Innovations
Recent innovations in DAS technology focus on enhancing coverage, capacity, and efficiency. Miniaturization of DAS components, the integration of advanced signal processing techniques, and the development of hybrid solutions combining active and passive technologies are key trends. These innovations address the challenges of deploying DAS in complex environments and ensure seamless connectivity across diverse applications. New products are emphasizing ease of installation, improved energy efficiency, and remote management capabilities, increasing their appeal to a wider range of users.
Propelling Factors for Distributed Antenna Systems Industry Growth
Several factors are driving the growth of the DAS industry. These include:
- Technological Advancements: The development of 5G and the need for improved indoor coverage are key drivers.
- Economic Growth: Increased investment in infrastructure development across various sectors boosts demand for DAS solutions.
- Regulatory Support: Government initiatives to promote connectivity and enhance public safety are fostering market expansion.
Obstacles in the Distributed Antenna Systems Industry Market
The DAS industry faces several challenges including:
- Regulatory Hurdles: Navigating complex regulations related to spectrum allocation and network deployment can be costly and time-consuming.
- Supply Chain Disruptions: Global supply chain issues can impact the availability of components and increase costs.
- Competitive Pressures: Intense competition among DAS vendors necessitates continuous innovation and efficient cost management.
Future Opportunities in Distributed Antenna Systems Industry
Future opportunities lie in:
- New Markets: Expanding into emerging markets with growing telecommunications infrastructure presents substantial growth potential.
- Technological Advancements: Exploring new technologies like private 5G and IoT connectivity will drive innovation and expansion.
- Consumer Trends: Catering to the increasing demand for seamless connectivity in various settings, from smart cities to transportation hubs, is crucial.
Major Players in the Distributed Antenna Systems Industry Ecosystem
- Anixter Inc
- Boingo Wireless Inc
- CommScope Inc
- American Tower Corporation
- Tower Bersama Group
- Corning Inc
- TE Connectivity Ltd
- Comba Telecom Systems Holdings Ltd
- Antenna Products Corporation
- Cobham PLC
- SOLiD Inc
Key Developments in Distributed Antenna Systems Industry Industry
- July 2023: American Tower Corporation and Xcel Energy Center's 5G DAS deployment at the arena signifies a key step towards enhancing fan engagement through advanced connectivity solutions.
- October 2022: PROSE Technologies' launch of a new Active DAS system and its first 5G in-building DAS in Mumbai, India, demonstrates market expansion in emerging economies.
Strategic Distributed Antenna Systems Industry Market Forecast
The DAS market is poised for continued growth, driven by expanding 5G adoption, increasing demand for seamless indoor connectivity across various sectors, and ongoing technological innovations. The market’s future prospects are highly promising, offering significant opportunities for established players and new entrants alike. Continued investment in research and development, coupled with strategic partnerships and acquisitions, will be crucial for success in this dynamic market.
Distributed Antenna Systems Industry Segmentation
-
1. Type
- 1.1. Active
- 1.2. Passive
- 1.3. Digital
- 1.4. Hybrid
-
2. End-User
- 2.1. Manufacturing
- 2.2. Healthcare
- 2.3. Government
- 2.4. Transportation
- 2.5. Sports and Entertainment
- 2.6. Telecommunications
- 2.7. Other End-Users
-
3. Application
- 3.1. Enterprise DAS
- 3.2. Public Safety DAS
- 3.3. Other Applications
Distributed Antenna Systems Industry Segmentation By Geography
- 1. North America
- 2. Europe
- 3. Asia
- 4. Australia and New Zealand
- 5. Latin America
- 6. Middle East and Africa

Distributed Antenna Systems Industry REPORT HIGHLIGHTS
| Aspects | Details |
|---|---|
| Study Period | 2019-2033 |
| Base Year | 2024 |
| Estimated Year | 2025 |
| Forecast Period | 2025-2033 |
| Historical Period | 2019-2024 |
| Growth Rate | CAGR of 6.03% from 2019-2033 |
| Segmentation |
|
Table of Contents
- 1. Introduction
- 1.1. Research Scope
- 1.2. Market Segmentation
- 1.3. Research Methodology
- 1.4. Definitions and Assumptions
- 2. Executive Summary
- 2.1. Introduction
- 3. Market Dynamics
- 3.1. Introduction
- 3.2. Market Drivers
- 3.2.1. DAS Ability to Support Multiple Telecom Carriers and Upcoming Technologies
- 3.3. Market Restrains
- 3.3.1. Lack of Awareness About Intellectual Property Outsourcing
- 3.4. Market Trends
- 3.4.1. Sport and Entertainment Segment to Hold a Significant Market Share
- 4. Market Factor Analysis
- 4.1. Porters Five Forces
- 4.2. Supply/Value Chain
- 4.3. PESTEL analysis
- 4.4. Market Entropy
- 4.5. Patent/Trademark Analysis
- 5. Global Distributed Antenna Systems Industry Analysis, Insights and Forecast, 2019-2031
- 5.1. Market Analysis, Insights and Forecast - by Type
- 5.1.1. Active
- 5.1.2. Passive
- 5.1.3. Digital
- 5.1.4. Hybrid
- 5.2. Market Analysis, Insights and Forecast - by End-User
- 5.2.1. Manufacturing
- 5.2.2. Healthcare
- 5.2.3. Government
- 5.2.4. Transportation
- 5.2.5. Sports and Entertainment
- 5.2.6. Telecommunications
- 5.2.7. Other End-Users
- 5.3. Market Analysis, Insights and Forecast - by Application
- 5.3.1. Enterprise DAS
- 5.3.2. Public Safety DAS
- 5.3.3. Other Applications
- 5.4. Market Analysis, Insights and Forecast - by Region
- 5.4.1. North America
- 5.4.2. Europe
- 5.4.3. Asia
- 5.4.4. Australia and New Zealand
- 5.4.5. Latin America
- 5.4.6. Middle East and Africa
- 5.1. Market Analysis, Insights and Forecast - by Type
- 6. North America Distributed Antenna Systems Industry Analysis, Insights and Forecast, 2019-2031
- 6.1. Market Analysis, Insights and Forecast - by Type
- 6.1.1. Active
- 6.1.2. Passive
- 6.1.3. Digital
- 6.1.4. Hybrid
- 6.2. Market Analysis, Insights and Forecast - by End-User
- 6.2.1. Manufacturing
- 6.2.2. Healthcare
- 6.2.3. Government
- 6.2.4. Transportation
- 6.2.5. Sports and Entertainment
- 6.2.6. Telecommunications
- 6.2.7. Other End-Users
- 6.3. Market Analysis, Insights and Forecast - by Application
- 6.3.1. Enterprise DAS
- 6.3.2. Public Safety DAS
- 6.3.3. Other Applications
- 6.1. Market Analysis, Insights and Forecast - by Type
- 7. Europe Distributed Antenna Systems Industry Analysis, Insights and Forecast, 2019-2031
- 7.1. Market Analysis, Insights and Forecast - by Type
- 7.1.1. Active
- 7.1.2. Passive
- 7.1.3. Digital
- 7.1.4. Hybrid
- 7.2. Market Analysis, Insights and Forecast - by End-User
- 7.2.1. Manufacturing
- 7.2.2. Healthcare
- 7.2.3. Government
- 7.2.4. Transportation
- 7.2.5. Sports and Entertainment
- 7.2.6. Telecommunications
- 7.2.7. Other End-Users
- 7.3. Market Analysis, Insights and Forecast - by Application
- 7.3.1. Enterprise DAS
- 7.3.2. Public Safety DAS
- 7.3.3. Other Applications
- 7.1. Market Analysis, Insights and Forecast - by Type
- 8. Asia Distributed Antenna Systems Industry Analysis, Insights and Forecast, 2019-2031
- 8.1. Market Analysis, Insights and Forecast - by Type
- 8.1.1. Active
- 8.1.2. Passive
- 8.1.3. Digital
- 8.1.4. Hybrid
- 8.2. Market Analysis, Insights and Forecast - by End-User
- 8.2.1. Manufacturing
- 8.2.2. Healthcare
- 8.2.3. Government
- 8.2.4. Transportation
- 8.2.5. Sports and Entertainment
- 8.2.6. Telecommunications
- 8.2.7. Other End-Users
- 8.3. Market Analysis, Insights and Forecast - by Application
- 8.3.1. Enterprise DAS
- 8.3.2. Public Safety DAS
- 8.3.3. Other Applications
- 8.1. Market Analysis, Insights and Forecast - by Type
- 9. Australia and New Zealand Distributed Antenna Systems Industry Analysis, Insights and Forecast, 2019-2031
- 9.1. Market Analysis, Insights and Forecast - by Type
- 9.1.1. Active
- 9.1.2. Passive
- 9.1.3. Digital
- 9.1.4. Hybrid
- 9.2. Market Analysis, Insights and Forecast - by End-User
- 9.2.1. Manufacturing
- 9.2.2. Healthcare
- 9.2.3. Government
- 9.2.4. Transportation
- 9.2.5. Sports and Entertainment
- 9.2.6. Telecommunications
- 9.2.7. Other End-Users
- 9.3. Market Analysis, Insights and Forecast - by Application
- 9.3.1. Enterprise DAS
- 9.3.2. Public Safety DAS
- 9.3.3. Other Applications
- 9.1. Market Analysis, Insights and Forecast - by Type
- 10. Latin America Distributed Antenna Systems Industry Analysis, Insights and Forecast, 2019-2031
- 10.1. Market Analysis, Insights and Forecast - by Type
- 10.1.1. Active
- 10.1.2. Passive
- 10.1.3. Digital
- 10.1.4. Hybrid
- 10.2. Market Analysis, Insights and Forecast - by End-User
- 10.2.1. Manufacturing
- 10.2.2. Healthcare
- 10.2.3. Government
- 10.2.4. Transportation
- 10.2.5. Sports and Entertainment
- 10.2.6. Telecommunications
- 10.2.7. Other End-Users
- 10.3. Market Analysis, Insights and Forecast - by Application
- 10.3.1. Enterprise DAS
- 10.3.2. Public Safety DAS
- 10.3.3. Other Applications
- 10.1. Market Analysis, Insights and Forecast - by Type
- 11. Middle East and Africa Distributed Antenna Systems Industry Analysis, Insights and Forecast, 2019-2031
- 11.1. Market Analysis, Insights and Forecast - by Type
- 11.1.1. Active
- 11.1.2. Passive
- 11.1.3. Digital
- 11.1.4. Hybrid
- 11.2. Market Analysis, Insights and Forecast - by End-User
- 11.2.1. Manufacturing
- 11.2.2. Healthcare
- 11.2.3. Government
- 11.2.4. Transportation
- 11.2.5. Sports and Entertainment
- 11.2.6. Telecommunications
- 11.2.7. Other End-Users
- 11.3. Market Analysis, Insights and Forecast - by Application
- 11.3.1. Enterprise DAS
- 11.3.2. Public Safety DAS
- 11.3.3. Other Applications
- 11.1. Market Analysis, Insights and Forecast - by Type
- 12. North America Distributed Antenna Systems Industry Analysis, Insights and Forecast, 2019-2031
- 12.1. Market Analysis, Insights and Forecast - By Country/Sub-region
- 12.1.1 United States
- 12.1.2 Canada
- 12.1.3 Mexico
- 13. Europe Distributed Antenna Systems Industry Analysis, Insights and Forecast, 2019-2031
- 13.1. Market Analysis, Insights and Forecast - By Country/Sub-region
- 13.1.1 Germany
- 13.1.2 United Kingdom
- 13.1.3 France
- 13.1.4 Spain
- 13.1.5 Italy
- 13.1.6 Spain
- 13.1.7 Belgium
- 13.1.8 Netherland
- 13.1.9 Nordics
- 13.1.10 Rest of Europe
- 14. Asia Pacific Distributed Antenna Systems Industry Analysis, Insights and Forecast, 2019-2031
- 14.1. Market Analysis, Insights and Forecast - By Country/Sub-region
- 14.1.1 China
- 14.1.2 Japan
- 14.1.3 India
- 14.1.4 South Korea
- 14.1.5 Southeast Asia
- 14.1.6 Australia
- 14.1.7 Indonesia
- 14.1.8 Phillipes
- 14.1.9 Singapore
- 14.1.10 Thailandc
- 14.1.11 Rest of Asia Pacific
- 15. South America Distributed Antenna Systems Industry Analysis, Insights and Forecast, 2019-2031
- 15.1. Market Analysis, Insights and Forecast - By Country/Sub-region
- 15.1.1 Brazil
- 15.1.2 Argentina
- 15.1.3 Peru
- 15.1.4 Chile
- 15.1.5 Colombia
- 15.1.6 Ecuador
- 15.1.7 Venezuela
- 15.1.8 Rest of South America
- 16. MEA Distributed Antenna Systems Industry Analysis, Insights and Forecast, 2019-2031
- 16.1. Market Analysis, Insights and Forecast - By Country/Sub-region
- 16.1.1 United Arab Emirates
- 16.1.2 Saudi Arabia
- 16.1.3 South Africa
- 16.1.4 Rest of Middle East and Africa
- 17. Competitive Analysis
- 17.1. Global Market Share Analysis 2024
- 17.2. Company Profiles
- 17.2.1 Anixter Inc
- 17.2.1.1. Overview
- 17.2.1.2. Products
- 17.2.1.3. SWOT Analysis
- 17.2.1.4. Recent Developments
- 17.2.1.5. Financials (Based on Availability)
- 17.2.2 Boingo Wireless Inc
- 17.2.2.1. Overview
- 17.2.2.2. Products
- 17.2.2.3. SWOT Analysis
- 17.2.2.4. Recent Developments
- 17.2.2.5. Financials (Based on Availability)
- 17.2.3 CommScope Inc
- 17.2.3.1. Overview
- 17.2.3.2. Products
- 17.2.3.3. SWOT Analysis
- 17.2.3.4. Recent Developments
- 17.2.3.5. Financials (Based on Availability)
- 17.2.4 American Tower Corporation
- 17.2.4.1. Overview
- 17.2.4.2. Products
- 17.2.4.3. SWOT Analysis
- 17.2.4.4. Recent Developments
- 17.2.4.5. Financials (Based on Availability)
- 17.2.5 Tower Bersama Group
- 17.2.5.1. Overview
- 17.2.5.2. Products
- 17.2.5.3. SWOT Analysis
- 17.2.5.4. Recent Developments
- 17.2.5.5. Financials (Based on Availability)
- 17.2.6 Corning Inc
- 17.2.6.1. Overview
- 17.2.6.2. Products
- 17.2.6.3. SWOT Analysis
- 17.2.6.4. Recent Developments
- 17.2.6.5. Financials (Based on Availability)
- 17.2.7 TE Connectivity Ltd
- 17.2.7.1. Overview
- 17.2.7.2. Products
- 17.2.7.3. SWOT Analysis
- 17.2.7.4. Recent Developments
- 17.2.7.5. Financials (Based on Availability)
- 17.2.8 Comba Telecom Systems Holdings Ltd
- 17.2.8.1. Overview
- 17.2.8.2. Products
- 17.2.8.3. SWOT Analysis
- 17.2.8.4. Recent Developments
- 17.2.8.5. Financials (Based on Availability)
- 17.2.9 Antenna Products Corporation
- 17.2.9.1. Overview
- 17.2.9.2. Products
- 17.2.9.3. SWOT Analysis
- 17.2.9.4. Recent Developments
- 17.2.9.5. Financials (Based on Availability)
- 17.2.10 Cobham PLC
- 17.2.10.1. Overview
- 17.2.10.2. Products
- 17.2.10.3. SWOT Analysis
- 17.2.10.4. Recent Developments
- 17.2.10.5. Financials (Based on Availability)
- 17.2.11 SOLiD Inc
- 17.2.11.1. Overview
- 17.2.11.2. Products
- 17.2.11.3. SWOT Analysis
- 17.2.11.4. Recent Developments
- 17.2.11.5. Financials (Based on Availability)
- 17.2.1 Anixter Inc
List of Figures
- Figure 1: Global Distributed Antenna Systems Industry Revenue Breakdown (Million, %) by Region 2024 & 2032
- Figure 2: North America Distributed Antenna Systems Industry Revenue (Million), by Country 2024 & 2032
- Figure 3: North America Distributed Antenna Systems Industry Revenue Share (%), by Country 2024 & 2032
- Figure 4: Europe Distributed Antenna Systems Industry Revenue (Million), by Country 2024 & 2032
- Figure 5: Europe Distributed Antenna Systems Industry Revenue Share (%), by Country 2024 & 2032
- Figure 6: Asia Pacific Distributed Antenna Systems Industry Revenue (Million), by Country 2024 & 2032
- Figure 7: Asia Pacific Distributed Antenna Systems Industry Revenue Share (%), by Country 2024 & 2032
- Figure 8: South America Distributed Antenna Systems Industry Revenue (Million), by Country 2024 & 2032
- Figure 9: South America Distributed Antenna Systems Industry Revenue Share (%), by Country 2024 & 2032
- Figure 10: MEA Distributed Antenna Systems Industry Revenue (Million), by Country 2024 & 2032
- Figure 11: MEA Distributed Antenna Systems Industry Revenue Share (%), by Country 2024 & 2032
- Figure 12: North America Distributed Antenna Systems Industry Revenue (Million), by Type 2024 & 2032
- Figure 13: North America Distributed Antenna Systems Industry Revenue Share (%), by Type 2024 & 2032
- Figure 14: North America Distributed Antenna Systems Industry Revenue (Million), by End-User 2024 & 2032
- Figure 15: North America Distributed Antenna Systems Industry Revenue Share (%), by End-User 2024 & 2032
- Figure 16: North America Distributed Antenna Systems Industry Revenue (Million), by Application 2024 & 2032
- Figure 17: North America Distributed Antenna Systems Industry Revenue Share (%), by Application 2024 & 2032
- Figure 18: North America Distributed Antenna Systems Industry Revenue (Million), by Country 2024 & 2032
- Figure 19: North America Distributed Antenna Systems Industry Revenue Share (%), by Country 2024 & 2032
- Figure 20: Europe Distributed Antenna Systems Industry Revenue (Million), by Type 2024 & 2032
- Figure 21: Europe Distributed Antenna Systems Industry Revenue Share (%), by Type 2024 & 2032
- Figure 22: Europe Distributed Antenna Systems Industry Revenue (Million), by End-User 2024 & 2032
- Figure 23: Europe Distributed Antenna Systems Industry Revenue Share (%), by End-User 2024 & 2032
- Figure 24: Europe Distributed Antenna Systems Industry Revenue (Million), by Application 2024 & 2032
- Figure 25: Europe Distributed Antenna Systems Industry Revenue Share (%), by Application 2024 & 2032
- Figure 26: Europe Distributed Antenna Systems Industry Revenue (Million), by Country 2024 & 2032
- Figure 27: Europe Distributed Antenna Systems Industry Revenue Share (%), by Country 2024 & 2032
- Figure 28: Asia Distributed Antenna Systems Industry Revenue (Million), by Type 2024 & 2032
- Figure 29: Asia Distributed Antenna Systems Industry Revenue Share (%), by Type 2024 & 2032
- Figure 30: Asia Distributed Antenna Systems Industry Revenue (Million), by End-User 2024 & 2032
- Figure 31: Asia Distributed Antenna Systems Industry Revenue Share (%), by End-User 2024 & 2032
- Figure 32: Asia Distributed Antenna Systems Industry Revenue (Million), by Application 2024 & 2032
- Figure 33: Asia Distributed Antenna Systems Industry Revenue Share (%), by Application 2024 & 2032
- Figure 34: Asia Distributed Antenna Systems Industry Revenue (Million), by Country 2024 & 2032
- Figure 35: Asia Distributed Antenna Systems Industry Revenue Share (%), by Country 2024 & 2032
- Figure 36: Australia and New Zealand Distributed Antenna Systems Industry Revenue (Million), by Type 2024 & 2032
- Figure 37: Australia and New Zealand Distributed Antenna Systems Industry Revenue Share (%), by Type 2024 & 2032
- Figure 38: Australia and New Zealand Distributed Antenna Systems Industry Revenue (Million), by End-User 2024 & 2032
- Figure 39: Australia and New Zealand Distributed Antenna Systems Industry Revenue Share (%), by End-User 2024 & 2032
- Figure 40: Australia and New Zealand Distributed Antenna Systems Industry Revenue (Million), by Application 2024 & 2032
- Figure 41: Australia and New Zealand Distributed Antenna Systems Industry Revenue Share (%), by Application 2024 & 2032
- Figure 42: Australia and New Zealand Distributed Antenna Systems Industry Revenue (Million), by Country 2024 & 2032
- Figure 43: Australia and New Zealand Distributed Antenna Systems Industry Revenue Share (%), by Country 2024 & 2032
- Figure 44: Latin America Distributed Antenna Systems Industry Revenue (Million), by Type 2024 & 2032
- Figure 45: Latin America Distributed Antenna Systems Industry Revenue Share (%), by Type 2024 & 2032
- Figure 46: Latin America Distributed Antenna Systems Industry Revenue (Million), by End-User 2024 & 2032
- Figure 47: Latin America Distributed Antenna Systems Industry Revenue Share (%), by End-User 2024 & 2032
- Figure 48: Latin America Distributed Antenna Systems Industry Revenue (Million), by Application 2024 & 2032
- Figure 49: Latin America Distributed Antenna Systems Industry Revenue Share (%), by Application 2024 & 2032
- Figure 50: Latin America Distributed Antenna Systems Industry Revenue (Million), by Country 2024 & 2032
- Figure 51: Latin America Distributed Antenna Systems Industry Revenue Share (%), by Country 2024 & 2032
- Figure 52: Middle East and Africa Distributed Antenna Systems Industry Revenue (Million), by Type 2024 & 2032
- Figure 53: Middle East and Africa Distributed Antenna Systems Industry Revenue Share (%), by Type 2024 & 2032
- Figure 54: Middle East and Africa Distributed Antenna Systems Industry Revenue (Million), by End-User 2024 & 2032
- Figure 55: Middle East and Africa Distributed Antenna Systems Industry Revenue Share (%), by End-User 2024 & 2032
- Figure 56: Middle East and Africa Distributed Antenna Systems Industry Revenue (Million), by Application 2024 & 2032
- Figure 57: Middle East and Africa Distributed Antenna Systems Industry Revenue Share (%), by Application 2024 & 2032
- Figure 58: Middle East and Africa Distributed Antenna Systems Industry Revenue (Million), by Country 2024 & 2032
- Figure 59: Middle East and Africa Distributed Antenna Systems Industry Revenue Share (%), by Country 2024 & 2032
List of Tables
- Table 1: Global Distributed Antenna Systems Industry Revenue Million Forecast, by Region 2019 & 2032
- Table 2: Global Distributed Antenna Systems Industry Revenue Million Forecast, by Type 2019 & 2032
- Table 3: Global Distributed Antenna Systems Industry Revenue Million Forecast, by End-User 2019 & 2032
- Table 4: Global Distributed Antenna Systems Industry Revenue Million Forecast, by Application 2019 & 2032
- Table 5: Global Distributed Antenna Systems Industry Revenue Million Forecast, by Region 2019 & 2032
- Table 6: Global Distributed Antenna Systems Industry Revenue Million Forecast, by Country 2019 & 2032
- Table 7: United States Distributed Antenna Systems Industry Revenue (Million) Forecast, by Application 2019 & 2032
- Table 8: Canada Distributed Antenna Systems Industry Revenue (Million) Forecast, by Application 2019 & 2032
- Table 9: Mexico Distributed Antenna Systems Industry Revenue (Million) Forecast, by Application 2019 & 2032
- Table 10: Global Distributed Antenna Systems Industry Revenue Million Forecast, by Country 2019 & 2032
- Table 11: Germany Distributed Antenna Systems Industry Revenue (Million) Forecast, by Application 2019 & 2032
- Table 12: United Kingdom Distributed Antenna Systems Industry Revenue (Million) Forecast, by Application 2019 & 2032
- Table 13: France Distributed Antenna Systems Industry Revenue (Million) Forecast, by Application 2019 & 2032
- Table 14: Spain Distributed Antenna Systems Industry Revenue (Million) Forecast, by Application 2019 & 2032
- Table 15: Italy Distributed Antenna Systems Industry Revenue (Million) Forecast, by Application 2019 & 2032
- Table 16: Spain Distributed Antenna Systems Industry Revenue (Million) Forecast, by Application 2019 & 2032
- Table 17: Belgium Distributed Antenna Systems Industry Revenue (Million) Forecast, by Application 2019 & 2032
- Table 18: Netherland Distributed Antenna Systems Industry Revenue (Million) Forecast, by Application 2019 & 2032
- Table 19: Nordics Distributed Antenna Systems Industry Revenue (Million) Forecast, by Application 2019 & 2032
- Table 20: Rest of Europe Distributed Antenna Systems Industry Revenue (Million) Forecast, by Application 2019 & 2032
- Table 21: Global Distributed Antenna Systems Industry Revenue Million Forecast, by Country 2019 & 2032
- Table 22: China Distributed Antenna Systems Industry Revenue (Million) Forecast, by Application 2019 & 2032
- Table 23: Japan Distributed Antenna Systems Industry Revenue (Million) Forecast, by Application 2019 & 2032
- Table 24: India Distributed Antenna Systems Industry Revenue (Million) Forecast, by Application 2019 & 2032
- Table 25: South Korea Distributed Antenna Systems Industry Revenue (Million) Forecast, by Application 2019 & 2032
- Table 26: Southeast Asia Distributed Antenna Systems Industry Revenue (Million) Forecast, by Application 2019 & 2032
- Table 27: Australia Distributed Antenna Systems Industry Revenue (Million) Forecast, by Application 2019 & 2032
- Table 28: Indonesia Distributed Antenna Systems Industry Revenue (Million) Forecast, by Application 2019 & 2032
- Table 29: Phillipes Distributed Antenna Systems Industry Revenue (Million) Forecast, by Application 2019 & 2032
- Table 30: Singapore Distributed Antenna Systems Industry Revenue (Million) Forecast, by Application 2019 & 2032
- Table 31: Thailandc Distributed Antenna Systems Industry Revenue (Million) Forecast, by Application 2019 & 2032
- Table 32: Rest of Asia Pacific Distributed Antenna Systems Industry Revenue (Million) Forecast, by Application 2019 & 2032
- Table 33: Global Distributed Antenna Systems Industry Revenue Million Forecast, by Country 2019 & 2032
- Table 34: Brazil Distributed Antenna Systems Industry Revenue (Million) Forecast, by Application 2019 & 2032
- Table 35: Argentina Distributed Antenna Systems Industry Revenue (Million) Forecast, by Application 2019 & 2032
- Table 36: Peru Distributed Antenna Systems Industry Revenue (Million) Forecast, by Application 2019 & 2032
- Table 37: Chile Distributed Antenna Systems Industry Revenue (Million) Forecast, by Application 2019 & 2032
- Table 38: Colombia Distributed Antenna Systems Industry Revenue (Million) Forecast, by Application 2019 & 2032
- Table 39: Ecuador Distributed Antenna Systems Industry Revenue (Million) Forecast, by Application 2019 & 2032
- Table 40: Venezuela Distributed Antenna Systems Industry Revenue (Million) Forecast, by Application 2019 & 2032
- Table 41: Rest of South America Distributed Antenna Systems Industry Revenue (Million) Forecast, by Application 2019 & 2032
- Table 42: Global Distributed Antenna Systems Industry Revenue Million Forecast, by Country 2019 & 2032
- Table 43: United Arab Emirates Distributed Antenna Systems Industry Revenue (Million) Forecast, by Application 2019 & 2032
- Table 44: Saudi Arabia Distributed Antenna Systems Industry Revenue (Million) Forecast, by Application 2019 & 2032
- Table 45: South Africa Distributed Antenna Systems Industry Revenue (Million) Forecast, by Application 2019 & 2032
- Table 46: Rest of Middle East and Africa Distributed Antenna Systems Industry Revenue (Million) Forecast, by Application 2019 & 2032
- Table 47: Global Distributed Antenna Systems Industry Revenue Million Forecast, by Type 2019 & 2032
- Table 48: Global Distributed Antenna Systems Industry Revenue Million Forecast, by End-User 2019 & 2032
- Table 49: Global Distributed Antenna Systems Industry Revenue Million Forecast, by Application 2019 & 2032
- Table 50: Global Distributed Antenna Systems Industry Revenue Million Forecast, by Country 2019 & 2032
- Table 51: Global Distributed Antenna Systems Industry Revenue Million Forecast, by Type 2019 & 2032
- Table 52: Global Distributed Antenna Systems Industry Revenue Million Forecast, by End-User 2019 & 2032
- Table 53: Global Distributed Antenna Systems Industry Revenue Million Forecast, by Application 2019 & 2032
- Table 54: Global Distributed Antenna Systems Industry Revenue Million Forecast, by Country 2019 & 2032
- Table 55: Global Distributed Antenna Systems Industry Revenue Million Forecast, by Type 2019 & 2032
- Table 56: Global Distributed Antenna Systems Industry Revenue Million Forecast, by End-User 2019 & 2032
- Table 57: Global Distributed Antenna Systems Industry Revenue Million Forecast, by Application 2019 & 2032
- Table 58: Global Distributed Antenna Systems Industry Revenue Million Forecast, by Country 2019 & 2032
- Table 59: Global Distributed Antenna Systems Industry Revenue Million Forecast, by Type 2019 & 2032
- Table 60: Global Distributed Antenna Systems Industry Revenue Million Forecast, by End-User 2019 & 2032
- Table 61: Global Distributed Antenna Systems Industry Revenue Million Forecast, by Application 2019 & 2032
- Table 62: Global Distributed Antenna Systems Industry Revenue Million Forecast, by Country 2019 & 2032
- Table 63: Global Distributed Antenna Systems Industry Revenue Million Forecast, by Type 2019 & 2032
- Table 64: Global Distributed Antenna Systems Industry Revenue Million Forecast, by End-User 2019 & 2032
- Table 65: Global Distributed Antenna Systems Industry Revenue Million Forecast, by Application 2019 & 2032
- Table 66: Global Distributed Antenna Systems Industry Revenue Million Forecast, by Country 2019 & 2032
- Table 67: Global Distributed Antenna Systems Industry Revenue Million Forecast, by Type 2019 & 2032
- Table 68: Global Distributed Antenna Systems Industry Revenue Million Forecast, by End-User 2019 & 2032
- Table 69: Global Distributed Antenna Systems Industry Revenue Million Forecast, by Application 2019 & 2032
- Table 70: Global Distributed Antenna Systems Industry Revenue Million Forecast, by Country 2019 & 2032
Frequently Asked Questions
1. What is the projected Compound Annual Growth Rate (CAGR) of the Distributed Antenna Systems Industry?
The projected CAGR is approximately 6.03%.
2. Which companies are prominent players in the Distributed Antenna Systems Industry?
Key companies in the market include Anixter Inc, Boingo Wireless Inc, CommScope Inc, American Tower Corporation, Tower Bersama Group, Corning Inc, TE Connectivity Ltd, Comba Telecom Systems Holdings Ltd, Antenna Products Corporation, Cobham PLC, SOLiD Inc.
3. What are the main segments of the Distributed Antenna Systems Industry?
The market segments include Type, End-User, Application.
4. Can you provide details about the market size?
The market size is estimated to be USD 10.28 Million as of 2022.
5. What are some drivers contributing to market growth?
DAS Ability to Support Multiple Telecom Carriers and Upcoming Technologies.
6. What are the notable trends driving market growth?
Sport and Entertainment Segment to Hold a Significant Market Share.
7. Are there any restraints impacting market growth?
Lack of Awareness About Intellectual Property Outsourcing.
8. Can you provide examples of recent developments in the market?
July 2023: American Tower Corporation and Xcel Energy Center announced the deployment of a Distributed Antenna System (DAS) solution that will bring 5G technology to the arena. The company enters a new era of fan engagement and provides cutting-edge applications for the Minnesota Wild fans, with an updated, neutral-host 5G DAS.
9. What pricing options are available for accessing the report?
Pricing options include single-user, multi-user, and enterprise licenses priced at USD 4750, USD 5250, and USD 8750 respectively.
10. Is the market size provided in terms of value or volume?
The market size is provided in terms of value, measured in Million.
11. Are there any specific market keywords associated with the report?
Yes, the market keyword associated with the report is "Distributed Antenna Systems Industry," which aids in identifying and referencing the specific market segment covered.
12. How do I determine which pricing option suits my needs best?
The pricing options vary based on user requirements and access needs. Individual users may opt for single-user licenses, while businesses requiring broader access may choose multi-user or enterprise licenses for cost-effective access to the report.
13. Are there any additional resources or data provided in the Distributed Antenna Systems Industry report?
While the report offers comprehensive insights, it's advisable to review the specific contents or supplementary materials provided to ascertain if additional resources or data are available.
14. How can I stay updated on further developments or reports in the Distributed Antenna Systems Industry?
To stay informed about further developments, trends, and reports in the Distributed Antenna Systems Industry, consider subscribing to industry newsletters, following relevant companies and organizations, or regularly checking reputable industry news sources and publications.
Methodology
Step 1 - Identification of Relevant Samples Size from Population Database


Step 2 - Approaches for Defining Global Market Size (Value, Volume* & Price*)

Note*: In applicable scenarios
Step 3 - Data Sources
Primary Research
- Web Analytics
- Survey Reports
- Research Institute
- Latest Research Reports
- Opinion Leaders
Secondary Research
- Annual Reports
- White Paper
- Latest Press Release
- Industry Association
- Paid Database
- Investor Presentations

Step 4 - Data Triangulation
Involves using different sources of information in order to increase the validity of a study
These sources are likely to be stakeholders in a program - participants, other researchers, program staff, other community members, and so on.
Then we put all data in single framework & apply various statistical tools to find out the dynamic on the market.
During the analysis stage, feedback from the stakeholder groups would be compared to determine areas of agreement as well as areas of divergence
