

Key Insights
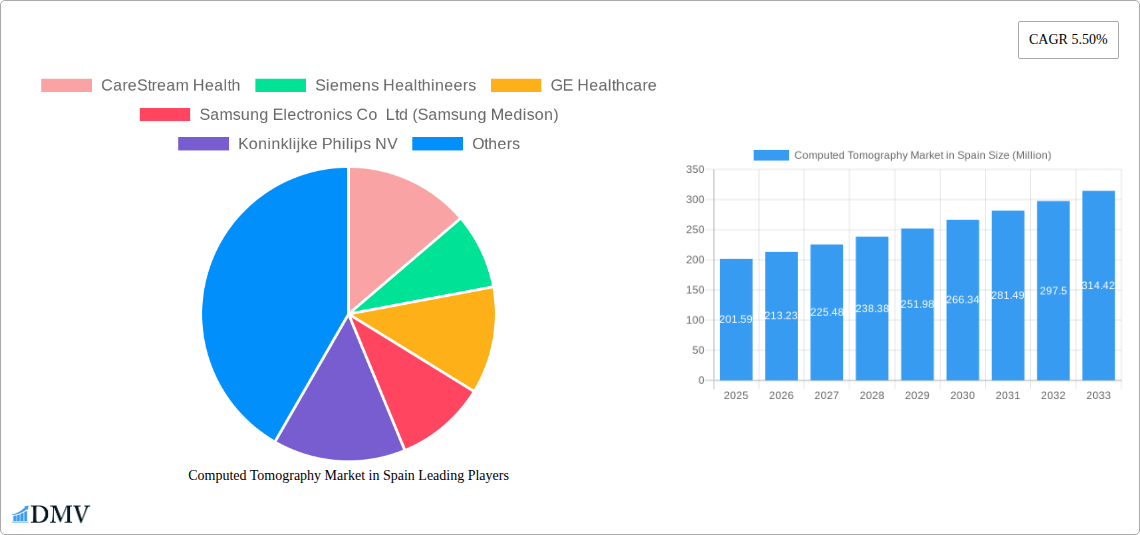
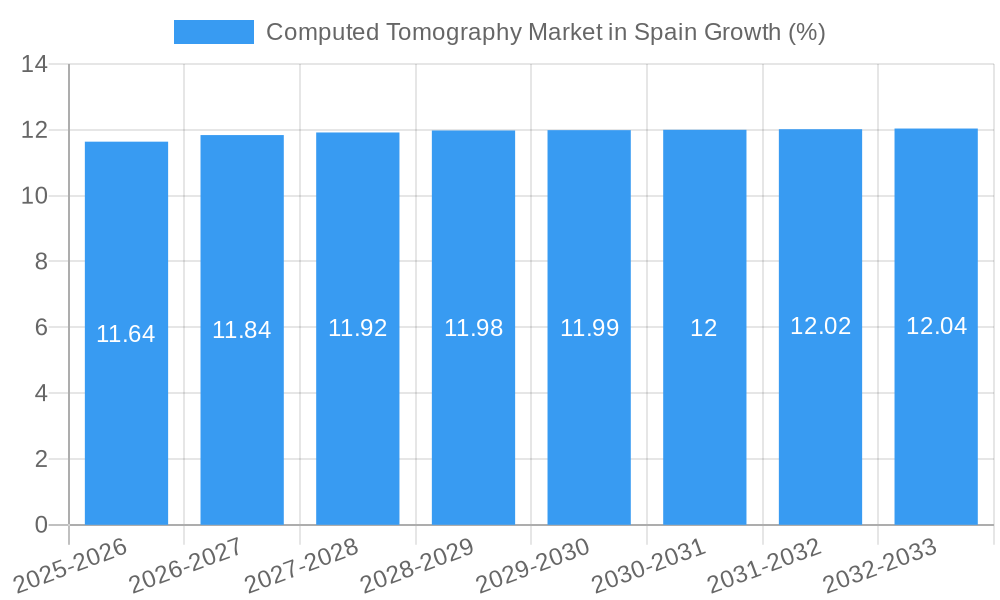
The Spanish Computed Tomography (CT) market, valued at €201.59 million in 2025, exhibits robust growth potential, projected to expand at a Compound Annual Growth Rate (CAGR) of 5.50% from 2025 to 2033. This growth is fueled by several key factors. Increasing prevalence of chronic diseases like cancer and cardiovascular ailments necessitates advanced diagnostic imaging, driving demand for CT scans. Technological advancements, such as multi-slice CT scanners offering faster scan times and improved image quality, are further enhancing market appeal. The rising geriatric population in Spain, who are more susceptible to age-related diseases requiring CT scans, contributes significantly to market expansion. Furthermore, government initiatives focused on improving healthcare infrastructure and increasing healthcare accessibility are creating a favorable environment for the adoption of advanced medical technologies like CT scanners. However, high initial investment costs associated with purchasing and maintaining CT scanners, coupled with stringent regulatory approvals, might pose some challenges to market growth.
Market segmentation reveals a diverse landscape. While the exact breakdown of market share across low, medium, and high-slice CT scanners isn't provided, it's reasonable to assume a significant share for high-slice systems due to their superior capabilities. Similarly, oncology, neurology, and cardiovascular applications likely dominate the application segment, driven by the high prevalence of related diseases. Hospitals and diagnostic centers are major end-users, with their market share likely exceeding that of other end-users. Key players like CareStream Health, Siemens Healthineers, GE Healthcare, and others are driving competition and innovation within the market, contributing to improvements in technology and affordability. The forecast period (2025-2033) suggests continued growth, making the Spanish CT market an attractive space for investment and expansion for both established players and new entrants.
Computed Tomography Market in Spain: A Comprehensive Report (2019-2033)
This insightful report delivers a detailed analysis of the Computed Tomography (CT) market in Spain, providing a comprehensive overview of its current state, future trajectory, and key players. Spanning the period from 2019 to 2033, with 2025 as the base and estimated year, this report offers invaluable insights for stakeholders seeking to navigate this dynamic market. The market size is projected to reach xx Million by 2033.
Computed Tomography Market in Spain Market Composition & Trends
This section meticulously examines the competitive landscape of the Spanish CT market, delving into market concentration, innovation drivers, regulatory frameworks, substitute technologies, and end-user profiles. We analyze mergers and acquisitions (M&A) activity, quantifying deal values and their impact on market share distribution. The Spanish CT market is characterized by a moderately concentrated landscape, with key players holding significant market share.
- Market Concentration: The top five players account for approximately xx% of the market share in 2025.
- Innovation Catalysts: Government funding for healthcare technology and a growing emphasis on minimally invasive procedures drive innovation.
- Regulatory Landscape: Stringent regulatory approvals and adherence to EU directives significantly influence market dynamics.
- Substitute Products: Magnetic Resonance Imaging (MRI) and Ultrasound are key substitute technologies, although CT retains a significant advantage in certain applications.
- End-User Profiles: Hospitals dominate the end-user segment, followed by diagnostic centers and other specialized facilities.
- M&A Activity: Between 2019 and 2024, xx M&A deals were recorded, with a total estimated value of xx Million.
Computed Tomography Market in Spain Industry Evolution
This section provides a deep dive into the historical and projected growth trajectory of the Spanish CT market. We analyze the evolution of technological advancements, shifting consumer preferences, and their impact on market dynamics.
The Spanish CT market witnessed a Compound Annual Growth Rate (CAGR) of xx% during the historical period (2019-2024). This growth is largely attributed to factors such as increasing prevalence of chronic diseases requiring CT scans, technological advancements leading to improved image quality and reduced radiation exposure, and rising healthcare expenditure in Spain. We project a CAGR of xx% during the forecast period (2025-2033), driven by further technological enhancements, growing adoption of advanced imaging techniques, and government initiatives promoting early disease detection. The adoption rate of multi-slice CT scanners is expected to increase significantly by xx% during this period. Furthermore, the integration of AI in image analysis will revolutionize diagnostic capabilities, boosting market growth.
Leading Regions, Countries, or Segments in Computed Tomography Market in Spain
This section identifies the leading segments and regions within the Spanish CT market.
Dominant Segments:
- By Type: High-slice CT scanners are projected to be the most dominant segment, accounting for xx% market share by 2033, driven by superior image quality and faster scan times.
- By Application: Oncology and Cardiovascular applications account for the largest market share due to the high prevalence of related diseases and the crucial role CT plays in diagnosis and treatment planning.
- By End User: Hospitals represent the largest end-user segment.
Key Drivers:
- High Investments: Significant investments in public and private healthcare infrastructure continue to propel growth.
- Government Initiatives: Government support for advanced healthcare technologies and disease prevention programs positively impacts market expansion.
- Technological Advancements: Continuous innovation in CT technology leading to improved image quality, reduced radiation, and increased speed significantly boosts demand.
The dominance of these segments is attributable to a combination of factors, including high prevalence of related diseases, government initiatives promoting early diagnosis, increasing investment in healthcare infrastructure, and the superior capabilities of these technologies compared to alternatives.
Computed Tomography Market in Spain Product Innovations
Recent advancements in CT technology have led to the development of photon-counting detectors, which offer improved image quality, reduced radiation dose, and enhanced diagnostic capabilities. These advancements, coupled with the integration of AI-powered image analysis tools, are transforming the CT market, enabling faster and more accurate diagnoses. The unique selling propositions of these new systems include faster scan times, improved image clarity, and reduced radiation exposure, all of which translate to better patient outcomes and increased efficiency for healthcare providers.
Propelling Factors for Computed Tomography Market in Spain Growth
The Spanish CT market's growth is fueled by several factors, including increased government spending on healthcare infrastructure and technological advancements. Technological innovations like photon-counting CT scanners reduce radiation dose while improving image quality, thus increasing adoption rates. Furthermore, the rising prevalence of chronic diseases necessitates advanced diagnostic tools, further driving market growth.
Obstacles in the Computed Tomography Market in Spain Market
Challenges facing the market include the high cost of CT scanners and associated maintenance, potential supply chain disruptions impacting equipment availability, and intense competition among established players. These factors can limit market penetration, particularly in smaller clinics and private practices. Regulatory hurdles and reimbursement policies also influence the adoption rate and overall market growth.
Future Opportunities in Computed Tomography Market in Spain
Emerging opportunities lie in the increasing adoption of AI-powered image analysis, the expansion of mobile CT units for remote areas, and the development of specialized CT applications tailored to specific disease areas. The integration of CT with other imaging modalities also presents significant potential for improved diagnostics and treatment planning.
Major Players in the Computed Tomography Market in Spain Ecosystem
- CareStream Health
- Siemens Healthineers
- GE Healthcare
- Samsung Electronics Co Ltd (Samsung Medison)
- Koninklijke Philips NV
- Canon Medical Systems Corporation
- Planmed Oy
- Fujifilm Holdings Corporation
Key Developments in Computed Tomography Market in Spain Industry
- November 2021: Siemens Healthineers launched the NAEOTOM Alpha, the world's first photon-counting CT scanner, enhancing diagnostic capabilities.
- May 2021: Philips secured a contract with Viamed, a leading Spanish hospital group, to install advanced diagnostic imaging solutions, significantly expanding market penetration.
Strategic Computed Tomography Market in Spain Market Forecast
The Spanish CT market is poised for continued growth driven by technological innovations, increased healthcare spending, and the rising prevalence of chronic diseases. The adoption of advanced imaging techniques and AI-powered analytics will further propel market expansion, presenting significant opportunities for existing and new market entrants. The market is expected to witness a healthy growth trajectory in the coming years, fueled by a favorable regulatory environment and supportive government initiatives.
Computed Tomography Market in Spain Segmentation
-
1. Type
- 1.1. Low Slice
- 1.2. Medium Slice
- 1.3. High Slice
-
2. Application
- 2.1. Oncology
- 2.2. Neurology
- 2.3. Cardiovascular
- 2.4. Musculoskeletal
- 2.5. Other Applications
-
3. End User
- 3.1. Hospitals
- 3.2. Diagnostic Centers
- 3.3. Other End Users
Computed Tomography Market in Spain Segmentation By Geography
-
1. North America
- 1.1. United States
- 1.2. Canada
- 1.3. Mexico
-
2. South America
- 2.1. Brazil
- 2.2. Argentina
- 2.3. Rest of South America
-
3. Europe
- 3.1. United Kingdom
- 3.2. Germany
- 3.3. France
- 3.4. Italy
- 3.5. Spain
- 3.6. Russia
- 3.7. Benelux
- 3.8. Nordics
- 3.9. Rest of Europe
-
4. Middle East & Africa
- 4.1. Turkey
- 4.2. Israel
- 4.3. GCC
- 4.4. North Africa
- 4.5. South Africa
- 4.6. Rest of Middle East & Africa
-
5. Asia Pacific
- 5.1. China
- 5.2. India
- 5.3. Japan
- 5.4. South Korea
- 5.5. ASEAN
- 5.6. Oceania
- 5.7. Rest of Asia Pacific
Computed Tomography Market in Spain REPORT HIGHLIGHTS
| Aspects | Details |
|---|---|
| Study Period | 2019-2033 |
| Base Year | 2024 |
| Estimated Year | 2025 |
| Forecast Period | 2025-2033 |
| Historical Period | 2019-2024 |
| Growth Rate | CAGR of 5.50% from 2019-2033 |
| Segmentation |
|
Table of Contents
- 1. Introduction
- 1.1. Research Scope
- 1.2. Market Segmentation
- 1.3. Research Methodology
- 1.4. Definitions and Assumptions
- 2. Executive Summary
- 2.1. Introduction
- 3. Market Dynamics
- 3.1. Introduction
- 3.2. Market Drivers
- 3.2.1. Increasing Geriatric Population and Chronic Disease Burden; Technological Advancements in Computed Tomography
- 3.3. Market Restrains
- 3.3.1. High Cost Associated With CT Scan Procedure and Equipment
- 3.4. Market Trends
- 3.4.1. Oncology is Expected to Dominate the Application Segment
- 4. Market Factor Analysis
- 4.1. Porters Five Forces
- 4.2. Supply/Value Chain
- 4.3. PESTEL analysis
- 4.4. Market Entropy
- 4.5. Patent/Trademark Analysis
- 5. Global Computed Tomography Market in Spain Analysis, Insights and Forecast, 2019-2031
- 5.1. Market Analysis, Insights and Forecast - by Type
- 5.1.1. Low Slice
- 5.1.2. Medium Slice
- 5.1.3. High Slice
- 5.2. Market Analysis, Insights and Forecast - by Application
- 5.2.1. Oncology
- 5.2.2. Neurology
- 5.2.3. Cardiovascular
- 5.2.4. Musculoskeletal
- 5.2.5. Other Applications
- 5.3. Market Analysis, Insights and Forecast - by End User
- 5.3.1. Hospitals
- 5.3.2. Diagnostic Centers
- 5.3.3. Other End Users
- 5.4. Market Analysis, Insights and Forecast - by Region
- 5.4.1. North America
- 5.4.2. South America
- 5.4.3. Europe
- 5.4.4. Middle East & Africa
- 5.4.5. Asia Pacific
- 5.1. Market Analysis, Insights and Forecast - by Type
- 6. North America Computed Tomography Market in Spain Analysis, Insights and Forecast, 2019-2031
- 6.1. Market Analysis, Insights and Forecast - by Type
- 6.1.1. Low Slice
- 6.1.2. Medium Slice
- 6.1.3. High Slice
- 6.2. Market Analysis, Insights and Forecast - by Application
- 6.2.1. Oncology
- 6.2.2. Neurology
- 6.2.3. Cardiovascular
- 6.2.4. Musculoskeletal
- 6.2.5. Other Applications
- 6.3. Market Analysis, Insights and Forecast - by End User
- 6.3.1. Hospitals
- 6.3.2. Diagnostic Centers
- 6.3.3. Other End Users
- 6.1. Market Analysis, Insights and Forecast - by Type
- 7. South America Computed Tomography Market in Spain Analysis, Insights and Forecast, 2019-2031
- 7.1. Market Analysis, Insights and Forecast - by Type
- 7.1.1. Low Slice
- 7.1.2. Medium Slice
- 7.1.3. High Slice
- 7.2. Market Analysis, Insights and Forecast - by Application
- 7.2.1. Oncology
- 7.2.2. Neurology
- 7.2.3. Cardiovascular
- 7.2.4. Musculoskeletal
- 7.2.5. Other Applications
- 7.3. Market Analysis, Insights and Forecast - by End User
- 7.3.1. Hospitals
- 7.3.2. Diagnostic Centers
- 7.3.3. Other End Users
- 7.1. Market Analysis, Insights and Forecast - by Type
- 8. Europe Computed Tomography Market in Spain Analysis, Insights and Forecast, 2019-2031
- 8.1. Market Analysis, Insights and Forecast - by Type
- 8.1.1. Low Slice
- 8.1.2. Medium Slice
- 8.1.3. High Slice
- 8.2. Market Analysis, Insights and Forecast - by Application
- 8.2.1. Oncology
- 8.2.2. Neurology
- 8.2.3. Cardiovascular
- 8.2.4. Musculoskeletal
- 8.2.5. Other Applications
- 8.3. Market Analysis, Insights and Forecast - by End User
- 8.3.1. Hospitals
- 8.3.2. Diagnostic Centers
- 8.3.3. Other End Users
- 8.1. Market Analysis, Insights and Forecast - by Type
- 9. Middle East & Africa Computed Tomography Market in Spain Analysis, Insights and Forecast, 2019-2031
- 9.1. Market Analysis, Insights and Forecast - by Type
- 9.1.1. Low Slice
- 9.1.2. Medium Slice
- 9.1.3. High Slice
- 9.2. Market Analysis, Insights and Forecast - by Application
- 9.2.1. Oncology
- 9.2.2. Neurology
- 9.2.3. Cardiovascular
- 9.2.4. Musculoskeletal
- 9.2.5. Other Applications
- 9.3. Market Analysis, Insights and Forecast - by End User
- 9.3.1. Hospitals
- 9.3.2. Diagnostic Centers
- 9.3.3. Other End Users
- 9.1. Market Analysis, Insights and Forecast - by Type
- 10. Asia Pacific Computed Tomography Market in Spain Analysis, Insights and Forecast, 2019-2031
- 10.1. Market Analysis, Insights and Forecast - by Type
- 10.1.1. Low Slice
- 10.1.2. Medium Slice
- 10.1.3. High Slice
- 10.2. Market Analysis, Insights and Forecast - by Application
- 10.2.1. Oncology
- 10.2.2. Neurology
- 10.2.3. Cardiovascular
- 10.2.4. Musculoskeletal
- 10.2.5. Other Applications
- 10.3. Market Analysis, Insights and Forecast - by End User
- 10.3.1. Hospitals
- 10.3.2. Diagnostic Centers
- 10.3.3. Other End Users
- 10.1. Market Analysis, Insights and Forecast - by Type
- 11. Competitive Analysis
- 11.1. Global Market Share Analysis 2024
- 11.2. Company Profiles
- 11.2.1 CareStream Health
- 11.2.1.1. Overview
- 11.2.1.2. Products
- 11.2.1.3. SWOT Analysis
- 11.2.1.4. Recent Developments
- 11.2.1.5. Financials (Based on Availability)
- 11.2.2 Siemens Healthineers
- 11.2.2.1. Overview
- 11.2.2.2. Products
- 11.2.2.3. SWOT Analysis
- 11.2.2.4. Recent Developments
- 11.2.2.5. Financials (Based on Availability)
- 11.2.3 GE Healthcare
- 11.2.3.1. Overview
- 11.2.3.2. Products
- 11.2.3.3. SWOT Analysis
- 11.2.3.4. Recent Developments
- 11.2.3.5. Financials (Based on Availability)
- 11.2.4 Samsung Electronics Co Ltd (Samsung Medison)
- 11.2.4.1. Overview
- 11.2.4.2. Products
- 11.2.4.3. SWOT Analysis
- 11.2.4.4. Recent Developments
- 11.2.4.5. Financials (Based on Availability)
- 11.2.5 Koninklijke Philips NV
- 11.2.5.1. Overview
- 11.2.5.2. Products
- 11.2.5.3. SWOT Analysis
- 11.2.5.4. Recent Developments
- 11.2.5.5. Financials (Based on Availability)
- 11.2.6 Canon Medical Systems Corporation
- 11.2.6.1. Overview
- 11.2.6.2. Products
- 11.2.6.3. SWOT Analysis
- 11.2.6.4. Recent Developments
- 11.2.6.5. Financials (Based on Availability)
- 11.2.7 Planmed Oy
- 11.2.7.1. Overview
- 11.2.7.2. Products
- 11.2.7.3. SWOT Analysis
- 11.2.7.4. Recent Developments
- 11.2.7.5. Financials (Based on Availability)
- 11.2.8 Fujifilm Holdings Corporation
- 11.2.8.1. Overview
- 11.2.8.2. Products
- 11.2.8.3. SWOT Analysis
- 11.2.8.4. Recent Developments
- 11.2.8.5. Financials (Based on Availability)
- 11.2.1 CareStream Health
List of Figures
- Figure 1: Global Computed Tomography Market in Spain Revenue Breakdown (Million, %) by Region 2024 & 2032
- Figure 2: Spain Computed Tomography Market in Spain Revenue (Million), by Country 2024 & 2032
- Figure 3: Spain Computed Tomography Market in Spain Revenue Share (%), by Country 2024 & 2032
- Figure 4: North America Computed Tomography Market in Spain Revenue (Million), by Type 2024 & 2032
- Figure 5: North America Computed Tomography Market in Spain Revenue Share (%), by Type 2024 & 2032
- Figure 6: North America Computed Tomography Market in Spain Revenue (Million), by Application 2024 & 2032
- Figure 7: North America Computed Tomography Market in Spain Revenue Share (%), by Application 2024 & 2032
- Figure 8: North America Computed Tomography Market in Spain Revenue (Million), by End User 2024 & 2032
- Figure 9: North America Computed Tomography Market in Spain Revenue Share (%), by End User 2024 & 2032
- Figure 10: North America Computed Tomography Market in Spain Revenue (Million), by Country 2024 & 2032
- Figure 11: North America Computed Tomography Market in Spain Revenue Share (%), by Country 2024 & 2032
- Figure 12: South America Computed Tomography Market in Spain Revenue (Million), by Type 2024 & 2032
- Figure 13: South America Computed Tomography Market in Spain Revenue Share (%), by Type 2024 & 2032
- Figure 14: South America Computed Tomography Market in Spain Revenue (Million), by Application 2024 & 2032
- Figure 15: South America Computed Tomography Market in Spain Revenue Share (%), by Application 2024 & 2032
- Figure 16: South America Computed Tomography Market in Spain Revenue (Million), by End User 2024 & 2032
- Figure 17: South America Computed Tomography Market in Spain Revenue Share (%), by End User 2024 & 2032
- Figure 18: South America Computed Tomography Market in Spain Revenue (Million), by Country 2024 & 2032
- Figure 19: South America Computed Tomography Market in Spain Revenue Share (%), by Country 2024 & 2032
- Figure 20: Europe Computed Tomography Market in Spain Revenue (Million), by Type 2024 & 2032
- Figure 21: Europe Computed Tomography Market in Spain Revenue Share (%), by Type 2024 & 2032
- Figure 22: Europe Computed Tomography Market in Spain Revenue (Million), by Application 2024 & 2032
- Figure 23: Europe Computed Tomography Market in Spain Revenue Share (%), by Application 2024 & 2032
- Figure 24: Europe Computed Tomography Market in Spain Revenue (Million), by End User 2024 & 2032
- Figure 25: Europe Computed Tomography Market in Spain Revenue Share (%), by End User 2024 & 2032
- Figure 26: Europe Computed Tomography Market in Spain Revenue (Million), by Country 2024 & 2032
- Figure 27: Europe Computed Tomography Market in Spain Revenue Share (%), by Country 2024 & 2032
- Figure 28: Middle East & Africa Computed Tomography Market in Spain Revenue (Million), by Type 2024 & 2032
- Figure 29: Middle East & Africa Computed Tomography Market in Spain Revenue Share (%), by Type 2024 & 2032
- Figure 30: Middle East & Africa Computed Tomography Market in Spain Revenue (Million), by Application 2024 & 2032
- Figure 31: Middle East & Africa Computed Tomography Market in Spain Revenue Share (%), by Application 2024 & 2032
- Figure 32: Middle East & Africa Computed Tomography Market in Spain Revenue (Million), by End User 2024 & 2032
- Figure 33: Middle East & Africa Computed Tomography Market in Spain Revenue Share (%), by End User 2024 & 2032
- Figure 34: Middle East & Africa Computed Tomography Market in Spain Revenue (Million), by Country 2024 & 2032
- Figure 35: Middle East & Africa Computed Tomography Market in Spain Revenue Share (%), by Country 2024 & 2032
- Figure 36: Asia Pacific Computed Tomography Market in Spain Revenue (Million), by Type 2024 & 2032
- Figure 37: Asia Pacific Computed Tomography Market in Spain Revenue Share (%), by Type 2024 & 2032
- Figure 38: Asia Pacific Computed Tomography Market in Spain Revenue (Million), by Application 2024 & 2032
- Figure 39: Asia Pacific Computed Tomography Market in Spain Revenue Share (%), by Application 2024 & 2032
- Figure 40: Asia Pacific Computed Tomography Market in Spain Revenue (Million), by End User 2024 & 2032
- Figure 41: Asia Pacific Computed Tomography Market in Spain Revenue Share (%), by End User 2024 & 2032
- Figure 42: Asia Pacific Computed Tomography Market in Spain Revenue (Million), by Country 2024 & 2032
- Figure 43: Asia Pacific Computed Tomography Market in Spain Revenue Share (%), by Country 2024 & 2032
List of Tables
- Table 1: Global Computed Tomography Market in Spain Revenue Million Forecast, by Region 2019 & 2032
- Table 2: Global Computed Tomography Market in Spain Revenue Million Forecast, by Type 2019 & 2032
- Table 3: Global Computed Tomography Market in Spain Revenue Million Forecast, by Application 2019 & 2032
- Table 4: Global Computed Tomography Market in Spain Revenue Million Forecast, by End User 2019 & 2032
- Table 5: Global Computed Tomography Market in Spain Revenue Million Forecast, by Region 2019 & 2032
- Table 6: Global Computed Tomography Market in Spain Revenue Million Forecast, by Country 2019 & 2032
- Table 7: Global Computed Tomography Market in Spain Revenue Million Forecast, by Type 2019 & 2032
- Table 8: Global Computed Tomography Market in Spain Revenue Million Forecast, by Application 2019 & 2032
- Table 9: Global Computed Tomography Market in Spain Revenue Million Forecast, by End User 2019 & 2032
- Table 10: Global Computed Tomography Market in Spain Revenue Million Forecast, by Country 2019 & 2032
- Table 11: United States Computed Tomography Market in Spain Revenue (Million) Forecast, by Application 2019 & 2032
- Table 12: Canada Computed Tomography Market in Spain Revenue (Million) Forecast, by Application 2019 & 2032
- Table 13: Mexico Computed Tomography Market in Spain Revenue (Million) Forecast, by Application 2019 & 2032
- Table 14: Global Computed Tomography Market in Spain Revenue Million Forecast, by Type 2019 & 2032
- Table 15: Global Computed Tomography Market in Spain Revenue Million Forecast, by Application 2019 & 2032
- Table 16: Global Computed Tomography Market in Spain Revenue Million Forecast, by End User 2019 & 2032
- Table 17: Global Computed Tomography Market in Spain Revenue Million Forecast, by Country 2019 & 2032
- Table 18: Brazil Computed Tomography Market in Spain Revenue (Million) Forecast, by Application 2019 & 2032
- Table 19: Argentina Computed Tomography Market in Spain Revenue (Million) Forecast, by Application 2019 & 2032
- Table 20: Rest of South America Computed Tomography Market in Spain Revenue (Million) Forecast, by Application 2019 & 2032
- Table 21: Global Computed Tomography Market in Spain Revenue Million Forecast, by Type 2019 & 2032
- Table 22: Global Computed Tomography Market in Spain Revenue Million Forecast, by Application 2019 & 2032
- Table 23: Global Computed Tomography Market in Spain Revenue Million Forecast, by End User 2019 & 2032
- Table 24: Global Computed Tomography Market in Spain Revenue Million Forecast, by Country 2019 & 2032
- Table 25: United Kingdom Computed Tomography Market in Spain Revenue (Million) Forecast, by Application 2019 & 2032
- Table 26: Germany Computed Tomography Market in Spain Revenue (Million) Forecast, by Application 2019 & 2032
- Table 27: France Computed Tomography Market in Spain Revenue (Million) Forecast, by Application 2019 & 2032
- Table 28: Italy Computed Tomography Market in Spain Revenue (Million) Forecast, by Application 2019 & 2032
- Table 29: Spain Computed Tomography Market in Spain Revenue (Million) Forecast, by Application 2019 & 2032
- Table 30: Russia Computed Tomography Market in Spain Revenue (Million) Forecast, by Application 2019 & 2032
- Table 31: Benelux Computed Tomography Market in Spain Revenue (Million) Forecast, by Application 2019 & 2032
- Table 32: Nordics Computed Tomography Market in Spain Revenue (Million) Forecast, by Application 2019 & 2032
- Table 33: Rest of Europe Computed Tomography Market in Spain Revenue (Million) Forecast, by Application 2019 & 2032
- Table 34: Global Computed Tomography Market in Spain Revenue Million Forecast, by Type 2019 & 2032
- Table 35: Global Computed Tomography Market in Spain Revenue Million Forecast, by Application 2019 & 2032
- Table 36: Global Computed Tomography Market in Spain Revenue Million Forecast, by End User 2019 & 2032
- Table 37: Global Computed Tomography Market in Spain Revenue Million Forecast, by Country 2019 & 2032
- Table 38: Turkey Computed Tomography Market in Spain Revenue (Million) Forecast, by Application 2019 & 2032
- Table 39: Israel Computed Tomography Market in Spain Revenue (Million) Forecast, by Application 2019 & 2032
- Table 40: GCC Computed Tomography Market in Spain Revenue (Million) Forecast, by Application 2019 & 2032
- Table 41: North Africa Computed Tomography Market in Spain Revenue (Million) Forecast, by Application 2019 & 2032
- Table 42: South Africa Computed Tomography Market in Spain Revenue (Million) Forecast, by Application 2019 & 2032
- Table 43: Rest of Middle East & Africa Computed Tomography Market in Spain Revenue (Million) Forecast, by Application 2019 & 2032
- Table 44: Global Computed Tomography Market in Spain Revenue Million Forecast, by Type 2019 & 2032
- Table 45: Global Computed Tomography Market in Spain Revenue Million Forecast, by Application 2019 & 2032
- Table 46: Global Computed Tomography Market in Spain Revenue Million Forecast, by End User 2019 & 2032
- Table 47: Global Computed Tomography Market in Spain Revenue Million Forecast, by Country 2019 & 2032
- Table 48: China Computed Tomography Market in Spain Revenue (Million) Forecast, by Application 2019 & 2032
- Table 49: India Computed Tomography Market in Spain Revenue (Million) Forecast, by Application 2019 & 2032
- Table 50: Japan Computed Tomography Market in Spain Revenue (Million) Forecast, by Application 2019 & 2032
- Table 51: South Korea Computed Tomography Market in Spain Revenue (Million) Forecast, by Application 2019 & 2032
- Table 52: ASEAN Computed Tomography Market in Spain Revenue (Million) Forecast, by Application 2019 & 2032
- Table 53: Oceania Computed Tomography Market in Spain Revenue (Million) Forecast, by Application 2019 & 2032
- Table 54: Rest of Asia Pacific Computed Tomography Market in Spain Revenue (Million) Forecast, by Application 2019 & 2032
Frequently Asked Questions
1. What is the projected Compound Annual Growth Rate (CAGR) of the Computed Tomography Market in Spain?
The projected CAGR is approximately 5.50%.
2. Which companies are prominent players in the Computed Tomography Market in Spain?
Key companies in the market include CareStream Health, Siemens Healthineers, GE Healthcare, Samsung Electronics Co Ltd (Samsung Medison), Koninklijke Philips NV, Canon Medical Systems Corporation, Planmed Oy, Fujifilm Holdings Corporation.
3. What are the main segments of the Computed Tomography Market in Spain?
The market segments include Type, Application, End User.
4. Can you provide details about the market size?
The market size is estimated to be USD 201.59 Million as of 2022.
5. What are some drivers contributing to market growth?
Increasing Geriatric Population and Chronic Disease Burden; Technological Advancements in Computed Tomography.
6. What are the notable trends driving market growth?
Oncology is Expected to Dominate the Application Segment.
7. Are there any restraints impacting market growth?
High Cost Associated With CT Scan Procedure and Equipment.
8. Can you provide examples of recent developments in the market?
In November 2021, Siemens Healthineers launched the NAEOTOM Alpha, the world's first photon-counting CT scanner. The system is cleared for clinical use in the United States and Europe.
9. What pricing options are available for accessing the report?
Pricing options include single-user, multi-user, and enterprise licenses priced at USD 3800, USD 4500, and USD 5800 respectively.
10. Is the market size provided in terms of value or volume?
The market size is provided in terms of value, measured in Million.
11. Are there any specific market keywords associated with the report?
Yes, the market keyword associated with the report is "Computed Tomography Market in Spain," which aids in identifying and referencing the specific market segment covered.
12. How do I determine which pricing option suits my needs best?
The pricing options vary based on user requirements and access needs. Individual users may opt for single-user licenses, while businesses requiring broader access may choose multi-user or enterprise licenses for cost-effective access to the report.
13. Are there any additional resources or data provided in the Computed Tomography Market in Spain report?
While the report offers comprehensive insights, it's advisable to review the specific contents or supplementary materials provided to ascertain if additional resources or data are available.
14. How can I stay updated on further developments or reports in the Computed Tomography Market in Spain?
To stay informed about further developments, trends, and reports in the Computed Tomography Market in Spain, consider subscribing to industry newsletters, following relevant companies and organizations, or regularly checking reputable industry news sources and publications.
Methodology
Step 1 - Identification of Relevant Samples Size from Population Database


Step 2 - Approaches for Defining Global Market Size (Value, Volume* & Price*)

Note*: In applicable scenarios
Step 3 - Data Sources
Primary Research
- Web Analytics
- Survey Reports
- Research Institute
- Latest Research Reports
- Opinion Leaders
Secondary Research
- Annual Reports
- White Paper
- Latest Press Release
- Industry Association
- Paid Database
- Investor Presentations

Step 4 - Data Triangulation
Involves using different sources of information in order to increase the validity of a study
These sources are likely to be stakeholders in a program - participants, other researchers, program staff, other community members, and so on.
Then we put all data in single framework & apply various statistical tools to find out the dynamic on the market.
During the analysis stage, feedback from the stakeholder groups would be compared to determine areas of agreement as well as areas of divergence
