

Key Insights
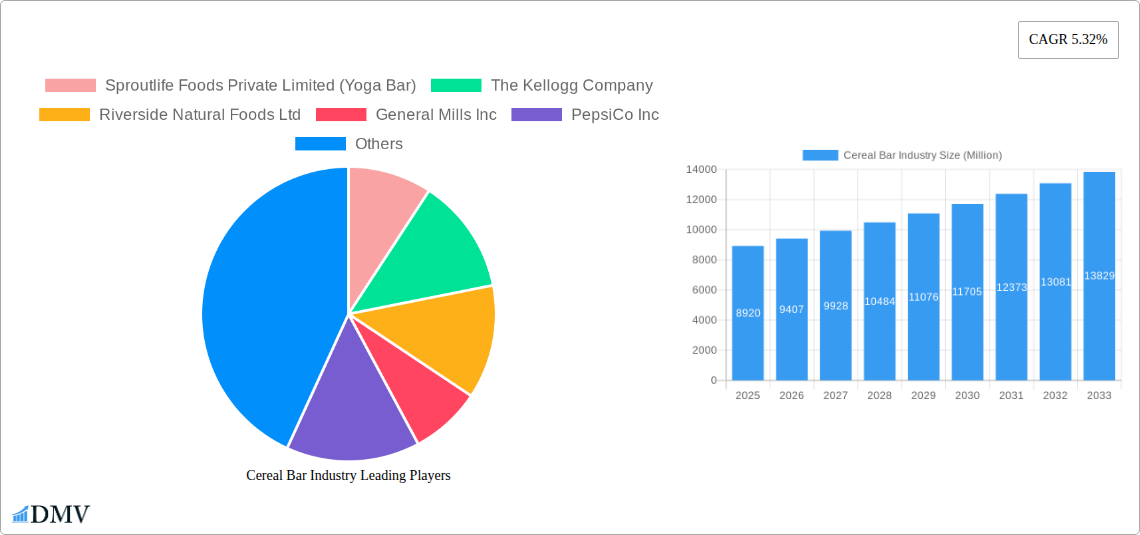
The global cereal bar market, valued at $8.92 billion in 2025, is projected to experience robust growth, driven by increasing consumer demand for convenient, nutritious, and on-the-go breakfast and snack options. The market's Compound Annual Growth Rate (CAGR) of 5.32% from 2025 to 2033 signifies a substantial expansion, fueled by several key factors. Health-conscious consumers are increasingly seeking fortified and whole-grain options, contributing to the popularity of granola and muesli bars. The rising prevalence of busy lifestyles further boosts demand for convenient snacking alternatives. Furthermore, the expansion of online retail channels provides broader market access and increased sales opportunities for manufacturers. Growth within specific segments, like granola/muesli bars and convenience store distribution, will likely outpace the overall market average. However, challenges remain, including increasing raw material costs and intense competition from established players like Kellogg's, General Mills, and PepsiCo. Successful companies will need to focus on innovation, such as developing unique flavors and functional ingredients to cater to evolving consumer preferences and stand out in a crowded market. Geographical expansion, particularly in rapidly developing economies of Asia Pacific, offers significant growth potential.
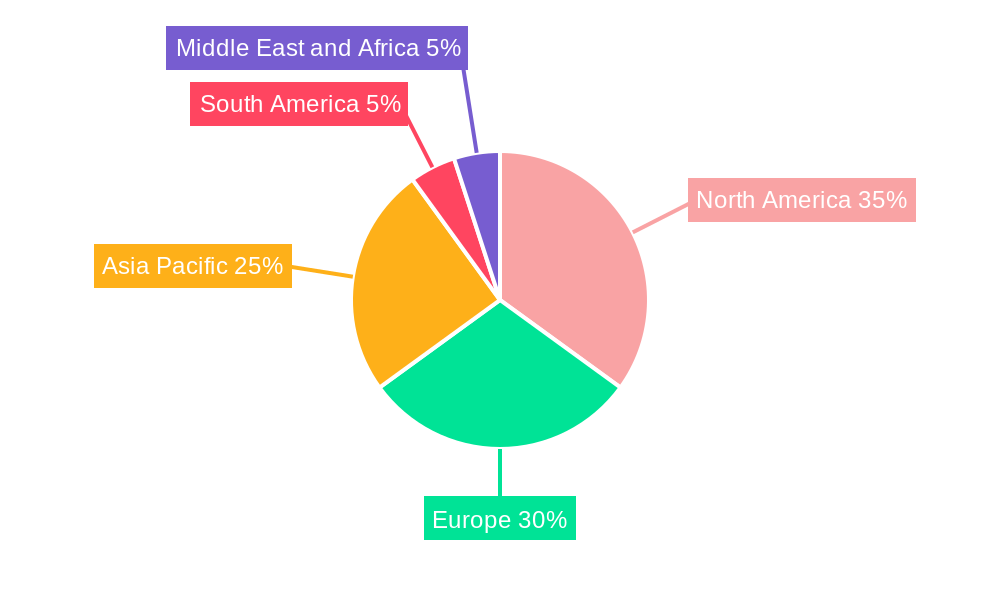
The market segmentation reveals a strong preference for granola/muesli bars, reflecting the growing health consciousness. Convenience stores dominate the distribution channels, highlighting the importance of accessibility for on-the-go consumption. While North America and Europe currently hold significant market shares, Asia-Pacific is projected to demonstrate substantial growth due to increasing disposable incomes and changing dietary habits. This necessitates a geographically diversified marketing strategy tailored to specific consumer preferences in each region. Competitive differentiation will be crucial, focusing on factors beyond price, such as brand reputation, product quality, and unique value propositions that resonate with the target demographics. Maintaining sustainable sourcing practices and adopting eco-friendly packaging will become increasingly critical as consumer awareness regarding environmental concerns grows.
Cereal Bar Industry Market Report: 2019-2033
This comprehensive report provides a detailed analysis of the global cereal bar industry, projecting a market value exceeding $XX Million by 2033. The study period covers 2019-2033, with 2025 serving as the base and estimated year. The report offers invaluable insights for stakeholders, including manufacturers, investors, and market entrants, aiming to navigate the evolving landscape of this dynamic sector. This in-depth analysis covers market segmentation, competitive dynamics, and future growth projections.
Cereal Bar Industry Market Composition & Trends
The global cereal bar market, valued at $XX Million in 2025, exhibits a moderately concentrated landscape with key players such as Kellogg's, General Mills, PepsiCo, and Mars Incorporated holding significant market share. The market is characterized by continuous innovation, driven by consumer demand for healthier, more convenient, and ethically sourced products. Regulatory changes concerning labeling, ingredients, and sustainability significantly impact market dynamics. Substitute products, including energy bars and other snack options, pose competitive challenges. The end-user profile is diverse, encompassing consumers across various age groups and lifestyles, with health-conscious individuals representing a significant segment.
- Market Share Distribution (2025): Kellogg's (XX%), General Mills (XX%), PepsiCo (XX%), Mars (XX%), Others (XX%). (Note: Specific percentages are estimated due to lack of publicly available data.)
- M&A Activity (2019-2024): A total of XX M&A deals were recorded, with a cumulative value of approximately $XX Million. These deals reflect the consolidation trends within the industry.
- Innovation Catalysts: Growing consumer preference for functional foods, organic ingredients, and sustainable packaging drives innovation.
- Regulatory Landscape: Stringent food safety and labeling regulations influence product formulation and marketing strategies.
Cereal Bar Industry Evolution
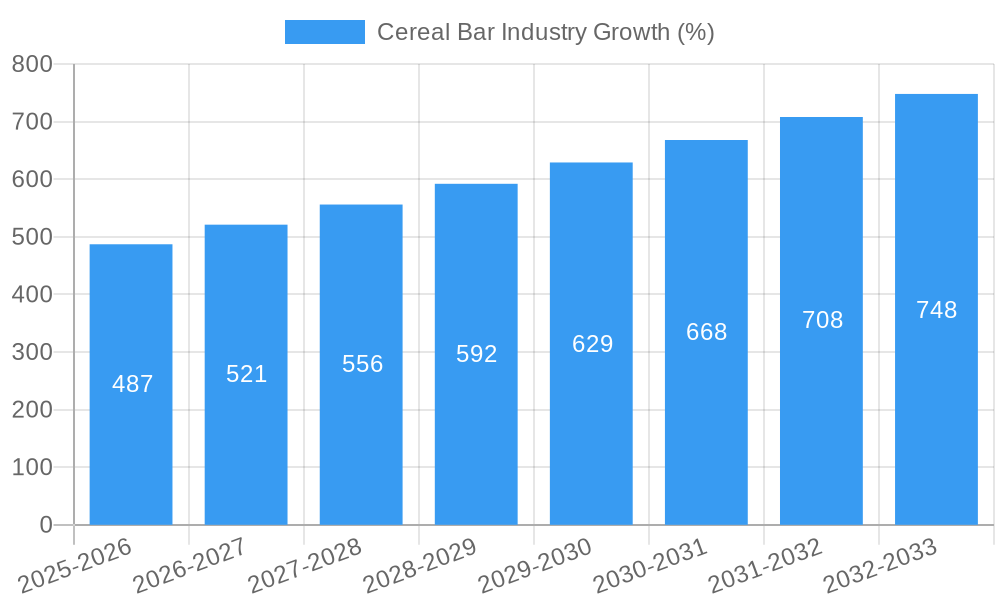
The cereal bar industry has witnessed significant growth from 2019 to 2024, expanding at a Compound Annual Growth Rate (CAGR) of XX%. This growth is attributed to several factors: increasing consumer awareness of health and wellness, the rising popularity of convenient snack options, and the proliferation of diverse product offerings. Technological advancements in food processing and packaging have played a crucial role in improving product quality, shelf life, and sustainability. Consumer preferences are shifting towards healthier options, with a growing demand for low-sugar, high-protein, and organic cereal bars. This trend has led to the introduction of innovative products featuring functional ingredients and unique flavor profiles. The industry has also seen a rise in personalized and customized cereal bar options, catering to specific dietary needs and preferences. Further growth is expected, with the projected CAGR of XX% from 2025 to 2033.
Leading Regions, Countries, or Segments in Cereal Bar Industry
The North American region currently dominates the global cereal bar market, followed by Europe. Within the product type segment, Granola/Muesli bars hold a larger market share compared to other bar types due to their perceived health benefits and widespread consumer acceptance. Supermarkets/Hypermarkets remain the primary distribution channel, followed by convenience stores and online retail stores, reflecting the growing importance of e-commerce in the food and beverage industry.
- Key Drivers for North American Dominance: High per capita consumption, strong consumer demand for convenient snacks, and well-established retail infrastructure.
- Key Drivers for Granola/Muesli Bar Segment: Perceived health benefits, versatility, and availability in various flavors and formats.
- Key Drivers for Supermarkets/Hypermarkets Channel: Wide product assortment, established distribution network, and consumer familiarity.
Cereal Bar Industry Product Innovations
Recent innovations focus on enhanced nutritional profiles, such as increased protein content, addition of functional ingredients (e.g., probiotics, prebiotics), and reduced sugar content. Technological advancements include improved processing techniques to enhance texture and shelf life and the adoption of sustainable packaging materials. Unique selling propositions include gluten-free, organic, and vegan options, catering to the growing demand for specialized dietary products.
Propelling Factors for Cereal Bar Industry Growth
Several factors contribute to the growth of the cereal bar industry. Firstly, the increasing demand for convenient and portable snacks fuels market expansion. Secondly, the growing health-conscious population drives demand for healthier alternatives. Thirdly, technological advancements enable manufacturers to create more nutritious and appealing products. Finally, favorable government regulations and support for the food industry promote growth.
Obstacles in the Cereal Bar Industry Market
The cereal bar industry faces challenges including fluctuating raw material prices, stringent regulations on food safety and labeling, and intense competition from substitute products. Supply chain disruptions can affect production and distribution, impacting market stability. The rise of private labels also puts pressure on established brands.
Future Opportunities in Cereal Bar Industry
Emerging opportunities include expansion into untapped markets, particularly in developing economies. Innovation in product formulations, including the development of functional bars catering to specific dietary needs, presents significant opportunities. The growing adoption of sustainable and ethical sourcing practices offers a competitive advantage. Finally, personalized nutrition and customized cereal bars will be key drivers of growth.
Major Players in the Cereal Bar Industry Ecosystem
- The Kellogg Company
- General Mills Inc
- PepsiCo Inc
- Associated British Foods PLC
- Mars Incorporated
- Mondelēz International Inc
- NuGo Nutrition
- McKee Foods Corporation
- Sproutlife Foods Private Limited (Yoga Bar)
- Riverside Natural Foods Ltd
Key Developments in Cereal Bar Industry Industry
- January 2024: McKee Foods launched Sunbelt Bakery chewy granola bars in three flavors for the vending industry, highlighting self-stable, individually wrapped products.
- January 2024: Mars China launched a SNICKERS bar with dark chocolate cereal, emphasizing sustainable mono-PP packaging and a low-sugar, low-GI option.
- March 2024: World of Sweets partnered with Mondelez International to expand the Clif brand's retail presence.
Strategic Cereal Bar Industry Market Forecast
The cereal bar market is poised for continued growth, driven by innovation, evolving consumer preferences, and expanding distribution channels. The focus on healthier ingredients, sustainable packaging, and personalized nutrition will shape future market trends. The market is expected to reach $XX Million by 2033, representing significant growth potential for both established and emerging players.
Cereal Bar Industry Segmentation
-
1. Product Type
- 1.1. Granola/Muesli Bars
- 1.2. Other Bars
-
2. Distribution Channel
- 2.1. Convenience Stores
- 2.2. Supermarkets/Hypermarkets
- 2.3. Specialty Stores
- 2.4. Online Retail Stores
- 2.5. Other Distribution Channels
Cereal Bar Industry Segmentation By Geography
-
1. North America
- 1.1. United States
- 1.2. Canada
- 1.3. Mexico
- 1.4. Rest of North America
-
2. Europe
- 2.1. Spain
- 2.2. United Kingdom
- 2.3. Germany
- 2.4. France
- 2.5. Italy
- 2.6. Netherlands
- 2.7. Rest of Europe
-
3. Asia Pacific
- 3.1. China
- 3.2. Japan
- 3.3. India
- 3.4. Australia
- 3.5. Rest of Asia Pacific
-
4. South America
- 4.1. Brazil
- 4.2. Argentina
- 4.3. Rest of South America
-
5. Middle East and Africa
- 5.1. South Africa
- 5.2. United Arab Emirates
- 5.3. Rest of Middle East and Africa
Cereal Bar Industry REPORT HIGHLIGHTS
| Aspects | Details |
|---|---|
| Study Period | 2019-2033 |
| Base Year | 2024 |
| Estimated Year | 2025 |
| Forecast Period | 2025-2033 |
| Historical Period | 2019-2024 |
| Growth Rate | CAGR of 5.32% from 2019-2033 |
| Segmentation |
|
Table of Contents
- 1. Introduction
- 1.1. Research Scope
- 1.2. Market Segmentation
- 1.3. Research Methodology
- 1.4. Definitions and Assumptions
- 2. Executive Summary
- 2.1. Introduction
- 3. Market Dynamics
- 3.1. Introduction
- 3.2. Market Drivers
- 3.2.1. Popularity of On-the-Go Snacking Options; Trend Of Clean Label and Plant-Based Bars
- 3.3. Market Restrains
- 3.3.1. Availability of Counterfeit Products
- 3.4. Market Trends
- 3.4.1. Rising Demand for On-the-go and Small-portion Snacking
- 4. Market Factor Analysis
- 4.1. Porters Five Forces
- 4.2. Supply/Value Chain
- 4.3. PESTEL analysis
- 4.4. Market Entropy
- 4.5. Patent/Trademark Analysis
- 5. Global Cereal Bar Industry Analysis, Insights and Forecast, 2019-2031
- 5.1. Market Analysis, Insights and Forecast - by Product Type
- 5.1.1. Granola/Muesli Bars
- 5.1.2. Other Bars
- 5.2. Market Analysis, Insights and Forecast - by Distribution Channel
- 5.2.1. Convenience Stores
- 5.2.2. Supermarkets/Hypermarkets
- 5.2.3. Specialty Stores
- 5.2.4. Online Retail Stores
- 5.2.5. Other Distribution Channels
- 5.3. Market Analysis, Insights and Forecast - by Region
- 5.3.1. North America
- 5.3.2. Europe
- 5.3.3. Asia Pacific
- 5.3.4. South America
- 5.3.5. Middle East and Africa
- 5.1. Market Analysis, Insights and Forecast - by Product Type
- 6. North America Cereal Bar Industry Analysis, Insights and Forecast, 2019-2031
- 6.1. Market Analysis, Insights and Forecast - by Product Type
- 6.1.1. Granola/Muesli Bars
- 6.1.2. Other Bars
- 6.2. Market Analysis, Insights and Forecast - by Distribution Channel
- 6.2.1. Convenience Stores
- 6.2.2. Supermarkets/Hypermarkets
- 6.2.3. Specialty Stores
- 6.2.4. Online Retail Stores
- 6.2.5. Other Distribution Channels
- 6.1. Market Analysis, Insights and Forecast - by Product Type
- 7. Europe Cereal Bar Industry Analysis, Insights and Forecast, 2019-2031
- 7.1. Market Analysis, Insights and Forecast - by Product Type
- 7.1.1. Granola/Muesli Bars
- 7.1.2. Other Bars
- 7.2. Market Analysis, Insights and Forecast - by Distribution Channel
- 7.2.1. Convenience Stores
- 7.2.2. Supermarkets/Hypermarkets
- 7.2.3. Specialty Stores
- 7.2.4. Online Retail Stores
- 7.2.5. Other Distribution Channels
- 7.1. Market Analysis, Insights and Forecast - by Product Type
- 8. Asia Pacific Cereal Bar Industry Analysis, Insights and Forecast, 2019-2031
- 8.1. Market Analysis, Insights and Forecast - by Product Type
- 8.1.1. Granola/Muesli Bars
- 8.1.2. Other Bars
- 8.2. Market Analysis, Insights and Forecast - by Distribution Channel
- 8.2.1. Convenience Stores
- 8.2.2. Supermarkets/Hypermarkets
- 8.2.3. Specialty Stores
- 8.2.4. Online Retail Stores
- 8.2.5. Other Distribution Channels
- 8.1. Market Analysis, Insights and Forecast - by Product Type
- 9. South America Cereal Bar Industry Analysis, Insights and Forecast, 2019-2031
- 9.1. Market Analysis, Insights and Forecast - by Product Type
- 9.1.1. Granola/Muesli Bars
- 9.1.2. Other Bars
- 9.2. Market Analysis, Insights and Forecast - by Distribution Channel
- 9.2.1. Convenience Stores
- 9.2.2. Supermarkets/Hypermarkets
- 9.2.3. Specialty Stores
- 9.2.4. Online Retail Stores
- 9.2.5. Other Distribution Channels
- 9.1. Market Analysis, Insights and Forecast - by Product Type
- 10. Middle East and Africa Cereal Bar Industry Analysis, Insights and Forecast, 2019-2031
- 10.1. Market Analysis, Insights and Forecast - by Product Type
- 10.1.1. Granola/Muesli Bars
- 10.1.2. Other Bars
- 10.2. Market Analysis, Insights and Forecast - by Distribution Channel
- 10.2.1. Convenience Stores
- 10.2.2. Supermarkets/Hypermarkets
- 10.2.3. Specialty Stores
- 10.2.4. Online Retail Stores
- 10.2.5. Other Distribution Channels
- 10.1. Market Analysis, Insights and Forecast - by Product Type
- 11. North America Cereal Bar Industry Analysis, Insights and Forecast, 2019-2031
- 11.1. Market Analysis, Insights and Forecast - By Country/Sub-region
- 11.1.1 United States
- 11.1.2 Canada
- 11.1.3 Mexico
- 11.1.4 Rest of North America
- 12. Europe Cereal Bar Industry Analysis, Insights and Forecast, 2019-2031
- 12.1. Market Analysis, Insights and Forecast - By Country/Sub-region
- 12.1.1 Spain
- 12.1.2 United Kingdom
- 12.1.3 Germany
- 12.1.4 France
- 12.1.5 Italy
- 12.1.6 Netherlands
- 12.1.7 Rest of Europe
- 13. Asia Pacific Cereal Bar Industry Analysis, Insights and Forecast, 2019-2031
- 13.1. Market Analysis, Insights and Forecast - By Country/Sub-region
- 13.1.1 China
- 13.1.2 Japan
- 13.1.3 India
- 13.1.4 Australia
- 13.1.5 Rest of Asia Pacific
- 14. South America Cereal Bar Industry Analysis, Insights and Forecast, 2019-2031
- 14.1. Market Analysis, Insights and Forecast - By Country/Sub-region
- 14.1.1 Brazil
- 14.1.2 Argentina
- 14.1.3 Rest of South America
- 15. Middle East and Africa Cereal Bar Industry Analysis, Insights and Forecast, 2019-2031
- 15.1. Market Analysis, Insights and Forecast - By Country/Sub-region
- 15.1.1 South Africa
- 15.1.2 United Arab Emirates
- 15.1.3 Rest of Middle East and Africa
- 16. Competitive Analysis
- 16.1. Global Market Share Analysis 2024
- 16.2. Company Profiles
- 16.2.1 Sproutlife Foods Private Limited (Yoga Bar)
- 16.2.1.1. Overview
- 16.2.1.2. Products
- 16.2.1.3. SWOT Analysis
- 16.2.1.4. Recent Developments
- 16.2.1.5. Financials (Based on Availability)
- 16.2.2 The Kellogg Company
- 16.2.2.1. Overview
- 16.2.2.2. Products
- 16.2.2.3. SWOT Analysis
- 16.2.2.4. Recent Developments
- 16.2.2.5. Financials (Based on Availability)
- 16.2.3 Riverside Natural Foods Ltd
- 16.2.3.1. Overview
- 16.2.3.2. Products
- 16.2.3.3. SWOT Analysis
- 16.2.3.4. Recent Developments
- 16.2.3.5. Financials (Based on Availability)
- 16.2.4 General Mills Inc
- 16.2.4.1. Overview
- 16.2.4.2. Products
- 16.2.4.3. SWOT Analysis
- 16.2.4.4. Recent Developments
- 16.2.4.5. Financials (Based on Availability)
- 16.2.5 PepsiCo Inc
- 16.2.5.1. Overview
- 16.2.5.2. Products
- 16.2.5.3. SWOT Analysis
- 16.2.5.4. Recent Developments
- 16.2.5.5. Financials (Based on Availability)
- 16.2.6 Associated British Foods PLC*List Not Exhaustive
- 16.2.6.1. Overview
- 16.2.6.2. Products
- 16.2.6.3. SWOT Analysis
- 16.2.6.4. Recent Developments
- 16.2.6.5. Financials (Based on Availability)
- 16.2.7 Mars Incorporated
- 16.2.7.1. Overview
- 16.2.7.2. Products
- 16.2.7.3. SWOT Analysis
- 16.2.7.4. Recent Developments
- 16.2.7.5. Financials (Based on Availability)
- 16.2.8 Mondelēz International Inc
- 16.2.8.1. Overview
- 16.2.8.2. Products
- 16.2.8.3. SWOT Analysis
- 16.2.8.4. Recent Developments
- 16.2.8.5. Financials (Based on Availability)
- 16.2.9 NuGo Nutrition
- 16.2.9.1. Overview
- 16.2.9.2. Products
- 16.2.9.3. SWOT Analysis
- 16.2.9.4. Recent Developments
- 16.2.9.5. Financials (Based on Availability)
- 16.2.10 McKee Foods Corporation
- 16.2.10.1. Overview
- 16.2.10.2. Products
- 16.2.10.3. SWOT Analysis
- 16.2.10.4. Recent Developments
- 16.2.10.5. Financials (Based on Availability)
- 16.2.1 Sproutlife Foods Private Limited (Yoga Bar)
List of Figures
- Figure 1: Global Cereal Bar Industry Revenue Breakdown (Million, %) by Region 2024 & 2032
- Figure 2: North America Cereal Bar Industry Revenue (Million), by Country 2024 & 2032
- Figure 3: North America Cereal Bar Industry Revenue Share (%), by Country 2024 & 2032
- Figure 4: Europe Cereal Bar Industry Revenue (Million), by Country 2024 & 2032
- Figure 5: Europe Cereal Bar Industry Revenue Share (%), by Country 2024 & 2032
- Figure 6: Asia Pacific Cereal Bar Industry Revenue (Million), by Country 2024 & 2032
- Figure 7: Asia Pacific Cereal Bar Industry Revenue Share (%), by Country 2024 & 2032
- Figure 8: South America Cereal Bar Industry Revenue (Million), by Country 2024 & 2032
- Figure 9: South America Cereal Bar Industry Revenue Share (%), by Country 2024 & 2032
- Figure 10: Middle East and Africa Cereal Bar Industry Revenue (Million), by Country 2024 & 2032
- Figure 11: Middle East and Africa Cereal Bar Industry Revenue Share (%), by Country 2024 & 2032
- Figure 12: North America Cereal Bar Industry Revenue (Million), by Product Type 2024 & 2032
- Figure 13: North America Cereal Bar Industry Revenue Share (%), by Product Type 2024 & 2032
- Figure 14: North America Cereal Bar Industry Revenue (Million), by Distribution Channel 2024 & 2032
- Figure 15: North America Cereal Bar Industry Revenue Share (%), by Distribution Channel 2024 & 2032
- Figure 16: North America Cereal Bar Industry Revenue (Million), by Country 2024 & 2032
- Figure 17: North America Cereal Bar Industry Revenue Share (%), by Country 2024 & 2032
- Figure 18: Europe Cereal Bar Industry Revenue (Million), by Product Type 2024 & 2032
- Figure 19: Europe Cereal Bar Industry Revenue Share (%), by Product Type 2024 & 2032
- Figure 20: Europe Cereal Bar Industry Revenue (Million), by Distribution Channel 2024 & 2032
- Figure 21: Europe Cereal Bar Industry Revenue Share (%), by Distribution Channel 2024 & 2032
- Figure 22: Europe Cereal Bar Industry Revenue (Million), by Country 2024 & 2032
- Figure 23: Europe Cereal Bar Industry Revenue Share (%), by Country 2024 & 2032
- Figure 24: Asia Pacific Cereal Bar Industry Revenue (Million), by Product Type 2024 & 2032
- Figure 25: Asia Pacific Cereal Bar Industry Revenue Share (%), by Product Type 2024 & 2032
- Figure 26: Asia Pacific Cereal Bar Industry Revenue (Million), by Distribution Channel 2024 & 2032
- Figure 27: Asia Pacific Cereal Bar Industry Revenue Share (%), by Distribution Channel 2024 & 2032
- Figure 28: Asia Pacific Cereal Bar Industry Revenue (Million), by Country 2024 & 2032
- Figure 29: Asia Pacific Cereal Bar Industry Revenue Share (%), by Country 2024 & 2032
- Figure 30: South America Cereal Bar Industry Revenue (Million), by Product Type 2024 & 2032
- Figure 31: South America Cereal Bar Industry Revenue Share (%), by Product Type 2024 & 2032
- Figure 32: South America Cereal Bar Industry Revenue (Million), by Distribution Channel 2024 & 2032
- Figure 33: South America Cereal Bar Industry Revenue Share (%), by Distribution Channel 2024 & 2032
- Figure 34: South America Cereal Bar Industry Revenue (Million), by Country 2024 & 2032
- Figure 35: South America Cereal Bar Industry Revenue Share (%), by Country 2024 & 2032
- Figure 36: Middle East and Africa Cereal Bar Industry Revenue (Million), by Product Type 2024 & 2032
- Figure 37: Middle East and Africa Cereal Bar Industry Revenue Share (%), by Product Type 2024 & 2032
- Figure 38: Middle East and Africa Cereal Bar Industry Revenue (Million), by Distribution Channel 2024 & 2032
- Figure 39: Middle East and Africa Cereal Bar Industry Revenue Share (%), by Distribution Channel 2024 & 2032
- Figure 40: Middle East and Africa Cereal Bar Industry Revenue (Million), by Country 2024 & 2032
- Figure 41: Middle East and Africa Cereal Bar Industry Revenue Share (%), by Country 2024 & 2032
List of Tables
- Table 1: Global Cereal Bar Industry Revenue Million Forecast, by Region 2019 & 2032
- Table 2: Global Cereal Bar Industry Revenue Million Forecast, by Product Type 2019 & 2032
- Table 3: Global Cereal Bar Industry Revenue Million Forecast, by Distribution Channel 2019 & 2032
- Table 4: Global Cereal Bar Industry Revenue Million Forecast, by Region 2019 & 2032
- Table 5: Global Cereal Bar Industry Revenue Million Forecast, by Country 2019 & 2032
- Table 6: United States Cereal Bar Industry Revenue (Million) Forecast, by Application 2019 & 2032
- Table 7: Canada Cereal Bar Industry Revenue (Million) Forecast, by Application 2019 & 2032
- Table 8: Mexico Cereal Bar Industry Revenue (Million) Forecast, by Application 2019 & 2032
- Table 9: Rest of North America Cereal Bar Industry Revenue (Million) Forecast, by Application 2019 & 2032
- Table 10: Global Cereal Bar Industry Revenue Million Forecast, by Country 2019 & 2032
- Table 11: Spain Cereal Bar Industry Revenue (Million) Forecast, by Application 2019 & 2032
- Table 12: United Kingdom Cereal Bar Industry Revenue (Million) Forecast, by Application 2019 & 2032
- Table 13: Germany Cereal Bar Industry Revenue (Million) Forecast, by Application 2019 & 2032
- Table 14: France Cereal Bar Industry Revenue (Million) Forecast, by Application 2019 & 2032
- Table 15: Italy Cereal Bar Industry Revenue (Million) Forecast, by Application 2019 & 2032
- Table 16: Netherlands Cereal Bar Industry Revenue (Million) Forecast, by Application 2019 & 2032
- Table 17: Rest of Europe Cereal Bar Industry Revenue (Million) Forecast, by Application 2019 & 2032
- Table 18: Global Cereal Bar Industry Revenue Million Forecast, by Country 2019 & 2032
- Table 19: China Cereal Bar Industry Revenue (Million) Forecast, by Application 2019 & 2032
- Table 20: Japan Cereal Bar Industry Revenue (Million) Forecast, by Application 2019 & 2032
- Table 21: India Cereal Bar Industry Revenue (Million) Forecast, by Application 2019 & 2032
- Table 22: Australia Cereal Bar Industry Revenue (Million) Forecast, by Application 2019 & 2032
- Table 23: Rest of Asia Pacific Cereal Bar Industry Revenue (Million) Forecast, by Application 2019 & 2032
- Table 24: Global Cereal Bar Industry Revenue Million Forecast, by Country 2019 & 2032
- Table 25: Brazil Cereal Bar Industry Revenue (Million) Forecast, by Application 2019 & 2032
- Table 26: Argentina Cereal Bar Industry Revenue (Million) Forecast, by Application 2019 & 2032
- Table 27: Rest of South America Cereal Bar Industry Revenue (Million) Forecast, by Application 2019 & 2032
- Table 28: Global Cereal Bar Industry Revenue Million Forecast, by Country 2019 & 2032
- Table 29: South Africa Cereal Bar Industry Revenue (Million) Forecast, by Application 2019 & 2032
- Table 30: United Arab Emirates Cereal Bar Industry Revenue (Million) Forecast, by Application 2019 & 2032
- Table 31: Rest of Middle East and Africa Cereal Bar Industry Revenue (Million) Forecast, by Application 2019 & 2032
- Table 32: Global Cereal Bar Industry Revenue Million Forecast, by Product Type 2019 & 2032
- Table 33: Global Cereal Bar Industry Revenue Million Forecast, by Distribution Channel 2019 & 2032
- Table 34: Global Cereal Bar Industry Revenue Million Forecast, by Country 2019 & 2032
- Table 35: United States Cereal Bar Industry Revenue (Million) Forecast, by Application 2019 & 2032
- Table 36: Canada Cereal Bar Industry Revenue (Million) Forecast, by Application 2019 & 2032
- Table 37: Mexico Cereal Bar Industry Revenue (Million) Forecast, by Application 2019 & 2032
- Table 38: Rest of North America Cereal Bar Industry Revenue (Million) Forecast, by Application 2019 & 2032
- Table 39: Global Cereal Bar Industry Revenue Million Forecast, by Product Type 2019 & 2032
- Table 40: Global Cereal Bar Industry Revenue Million Forecast, by Distribution Channel 2019 & 2032
- Table 41: Global Cereal Bar Industry Revenue Million Forecast, by Country 2019 & 2032
- Table 42: Spain Cereal Bar Industry Revenue (Million) Forecast, by Application 2019 & 2032
- Table 43: United Kingdom Cereal Bar Industry Revenue (Million) Forecast, by Application 2019 & 2032
- Table 44: Germany Cereal Bar Industry Revenue (Million) Forecast, by Application 2019 & 2032
- Table 45: France Cereal Bar Industry Revenue (Million) Forecast, by Application 2019 & 2032
- Table 46: Italy Cereal Bar Industry Revenue (Million) Forecast, by Application 2019 & 2032
- Table 47: Netherlands Cereal Bar Industry Revenue (Million) Forecast, by Application 2019 & 2032
- Table 48: Rest of Europe Cereal Bar Industry Revenue (Million) Forecast, by Application 2019 & 2032
- Table 49: Global Cereal Bar Industry Revenue Million Forecast, by Product Type 2019 & 2032
- Table 50: Global Cereal Bar Industry Revenue Million Forecast, by Distribution Channel 2019 & 2032
- Table 51: Global Cereal Bar Industry Revenue Million Forecast, by Country 2019 & 2032
- Table 52: China Cereal Bar Industry Revenue (Million) Forecast, by Application 2019 & 2032
- Table 53: Japan Cereal Bar Industry Revenue (Million) Forecast, by Application 2019 & 2032
- Table 54: India Cereal Bar Industry Revenue (Million) Forecast, by Application 2019 & 2032
- Table 55: Australia Cereal Bar Industry Revenue (Million) Forecast, by Application 2019 & 2032
- Table 56: Rest of Asia Pacific Cereal Bar Industry Revenue (Million) Forecast, by Application 2019 & 2032
- Table 57: Global Cereal Bar Industry Revenue Million Forecast, by Product Type 2019 & 2032
- Table 58: Global Cereal Bar Industry Revenue Million Forecast, by Distribution Channel 2019 & 2032
- Table 59: Global Cereal Bar Industry Revenue Million Forecast, by Country 2019 & 2032
- Table 60: Brazil Cereal Bar Industry Revenue (Million) Forecast, by Application 2019 & 2032
- Table 61: Argentina Cereal Bar Industry Revenue (Million) Forecast, by Application 2019 & 2032
- Table 62: Rest of South America Cereal Bar Industry Revenue (Million) Forecast, by Application 2019 & 2032
- Table 63: Global Cereal Bar Industry Revenue Million Forecast, by Product Type 2019 & 2032
- Table 64: Global Cereal Bar Industry Revenue Million Forecast, by Distribution Channel 2019 & 2032
- Table 65: Global Cereal Bar Industry Revenue Million Forecast, by Country 2019 & 2032
- Table 66: South Africa Cereal Bar Industry Revenue (Million) Forecast, by Application 2019 & 2032
- Table 67: United Arab Emirates Cereal Bar Industry Revenue (Million) Forecast, by Application 2019 & 2032
- Table 68: Rest of Middle East and Africa Cereal Bar Industry Revenue (Million) Forecast, by Application 2019 & 2032
Frequently Asked Questions
1. What is the projected Compound Annual Growth Rate (CAGR) of the Cereal Bar Industry?
The projected CAGR is approximately 5.32%.
2. Which companies are prominent players in the Cereal Bar Industry?
Key companies in the market include Sproutlife Foods Private Limited (Yoga Bar), The Kellogg Company, Riverside Natural Foods Ltd, General Mills Inc, PepsiCo Inc, Associated British Foods PLC*List Not Exhaustive, Mars Incorporated, Mondelēz International Inc, NuGo Nutrition, McKee Foods Corporation.
3. What are the main segments of the Cereal Bar Industry?
The market segments include Product Type, Distribution Channel.
4. Can you provide details about the market size?
The market size is estimated to be USD 8.92 Million as of 2022.
5. What are some drivers contributing to market growth?
Popularity of On-the-Go Snacking Options; Trend Of Clean Label and Plant-Based Bars.
6. What are the notable trends driving market growth?
Rising Demand for On-the-go and Small-portion Snacking.
7. Are there any restraints impacting market growth?
Availability of Counterfeit Products.
8. Can you provide examples of recent developments in the market?
March 2024: World of Sweets partnered and collaborated with Mondelez International to grow the American-born Clif brand, supplying retailers with their products.
9. What pricing options are available for accessing the report?
Pricing options include single-user, multi-user, and enterprise licenses priced at USD 4750, USD 5250, and USD 8750 respectively.
10. Is the market size provided in terms of value or volume?
The market size is provided in terms of value, measured in Million.
11. Are there any specific market keywords associated with the report?
Yes, the market keyword associated with the report is "Cereal Bar Industry," which aids in identifying and referencing the specific market segment covered.
12. How do I determine which pricing option suits my needs best?
The pricing options vary based on user requirements and access needs. Individual users may opt for single-user licenses, while businesses requiring broader access may choose multi-user or enterprise licenses for cost-effective access to the report.
13. Are there any additional resources or data provided in the Cereal Bar Industry report?
While the report offers comprehensive insights, it's advisable to review the specific contents or supplementary materials provided to ascertain if additional resources or data are available.
14. How can I stay updated on further developments or reports in the Cereal Bar Industry?
To stay informed about further developments, trends, and reports in the Cereal Bar Industry, consider subscribing to industry newsletters, following relevant companies and organizations, or regularly checking reputable industry news sources and publications.
Methodology
Step 1 - Identification of Relevant Samples Size from Population Database


Step 2 - Approaches for Defining Global Market Size (Value, Volume* & Price*)

Note*: In applicable scenarios
Step 3 - Data Sources
Primary Research
- Web Analytics
- Survey Reports
- Research Institute
- Latest Research Reports
- Opinion Leaders
Secondary Research
- Annual Reports
- White Paper
- Latest Press Release
- Industry Association
- Paid Database
- Investor Presentations

Step 4 - Data Triangulation
Involves using different sources of information in order to increase the validity of a study
These sources are likely to be stakeholders in a program - participants, other researchers, program staff, other community members, and so on.
Then we put all data in single framework & apply various statistical tools to find out the dynamic on the market.
During the analysis stage, feedback from the stakeholder groups would be compared to determine areas of agreement as well as areas of divergence
