

Key Insights
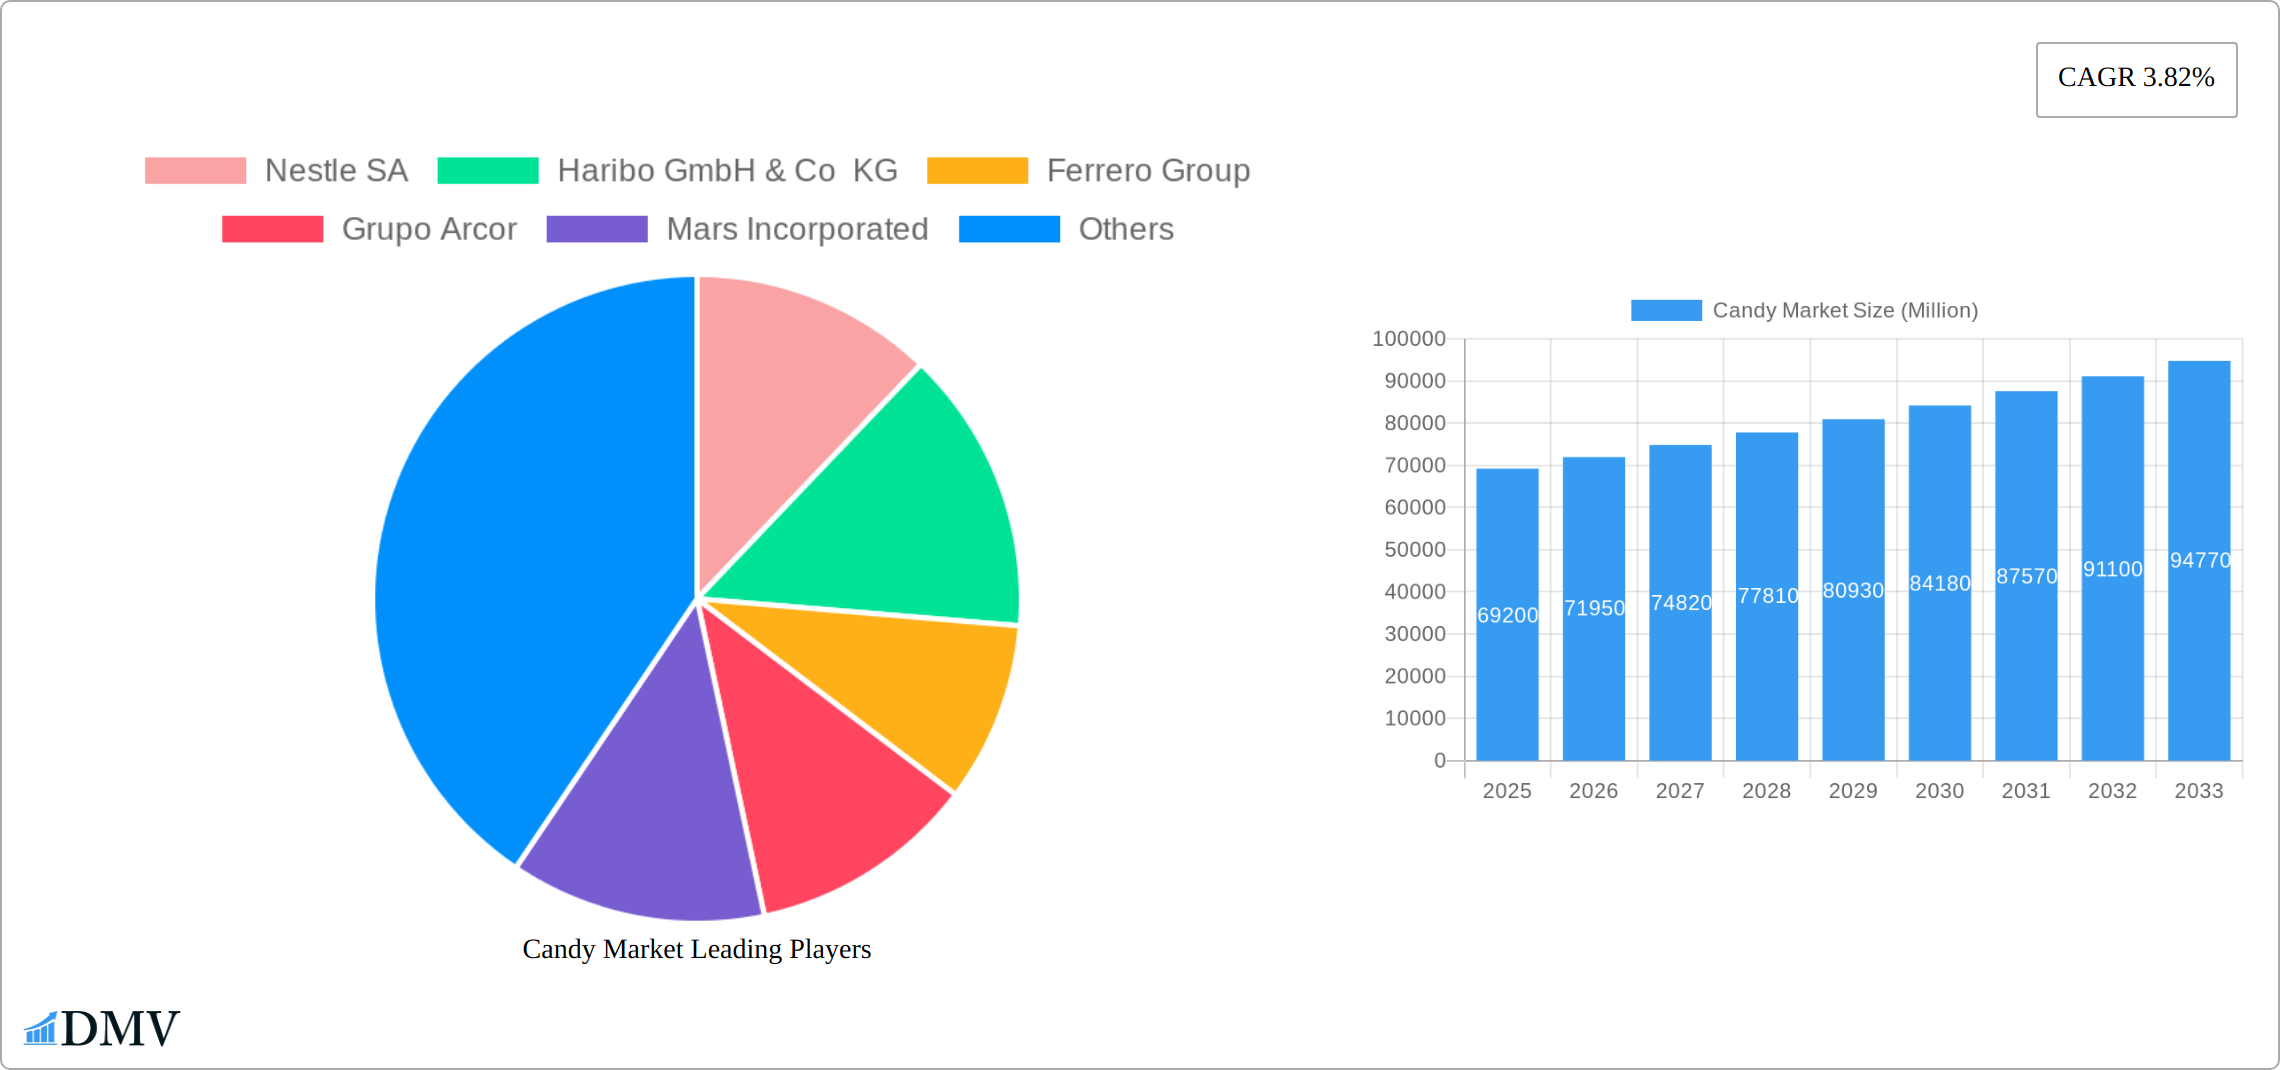
The global candy market, valued at $69.20 billion in 2025, is projected to experience steady growth, exhibiting a compound annual growth rate (CAGR) of 3.82% from 2025 to 2033. This growth is driven by several key factors. The increasing disposable incomes in developing economies fuel higher consumer spending on discretionary items like candy. Furthermore, the innovative product development strategies employed by major players, including the introduction of healthier options and unique flavor profiles, cater to evolving consumer preferences and broaden the market appeal. The rise of e-commerce platforms also presents significant opportunities, enhancing accessibility and convenience for consumers. However, growing health consciousness, particularly regarding sugar consumption and its associated health risks, poses a significant restraint to market expansion. Government regulations regarding sugar content and marketing towards children further complicate the market landscape. The market segmentation reveals that chocolate candy holds a dominant share, though non-chocolate candies are witnessing considerable growth due to increased demand for gummy candies and other confectionery items. Supermarkets and hypermarkets remain the primary distribution channel, but online retail is experiencing rapid expansion, creating new avenues for market penetration.
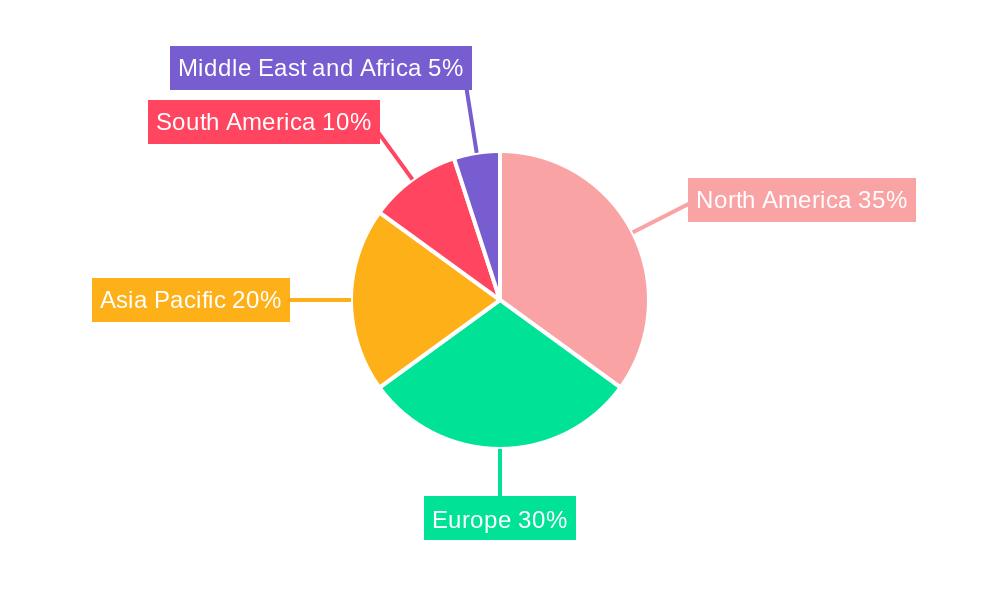
The competitive landscape is dominated by multinational giants such as Nestle SA, Ferrero Group, and Mars Incorporated, who leverage their extensive distribution networks and established brand recognition. However, smaller, specialized candy manufacturers are gaining traction by focusing on niche segments like organic or artisanal candies. Regional analysis shows that North America and Europe currently command the largest market shares due to established consumer preferences and high per capita consumption. However, rapidly growing economies in Asia-Pacific and South America present significant future growth potential, fueled by rising middle classes and increasing urbanization. The forecast period (2025-2033) anticipates continuous expansion, primarily driven by market penetration in emerging economies and innovative product launches that address evolving consumer demands for healthier and more diverse candy options. The market's future trajectory hinges on the delicate balance between consumer demand, health concerns, and regulatory landscapes.
Candy Market: A Comprehensive Market Report (2019-2033)
This insightful report provides a detailed analysis of the global candy market, offering a comprehensive overview of its current state, future trajectory, and key players. Valued at xx Million in 2024, the market is projected to reach xx Million by 2033, exhibiting a robust Compound Annual Growth Rate (CAGR) of xx% during the forecast period (2025-2033). The report covers the historical period (2019-2024), with 2025 serving as the base and estimated year. This analysis is crucial for stakeholders seeking to understand market dynamics, identify growth opportunities, and make informed strategic decisions.
Candy Market Composition & Trends
This section delves into the intricate landscape of the candy market, examining its concentration, innovation drivers, regulatory environment, substitute products, consumer profiles, and mergers & acquisitions (M&A) activities. The market exhibits a moderately concentrated structure, with key players like Nestle SA, Mars Incorporated, and Mondelez International Inc. holding significant market share. However, smaller, specialized players continue to innovate and disrupt the market.
Market Share Distribution (2024 Estimates):
- Nestle SA: xx%
- Mars Incorporated: xx%
- Mondelez International Inc: xx%
- Haribo GmbH & Co KG: xx%
- Ferrero Group: xx%
- Others: xx%
Innovation Catalysts:
- Growing demand for healthier options, including sugar-free and organic candies.
- Increasing popularity of innovative formats and flavors.
- Rise of personalized and customized candy experiences.
Regulatory Landscape:
- Varying regulations across different geographies regarding sugar content and labeling.
- Growing emphasis on sustainability and ethical sourcing of ingredients.
M&A Activities (2019-2024):
- A total of xx M&A deals were recorded, with a combined value of approximately xx Million. Significant deals included [Insert details of specific significant M&A deals if available, otherwise replace with "Analysis revealed significant consolidation activity, particularly among mid-sized players."].
Candy Market Industry Evolution
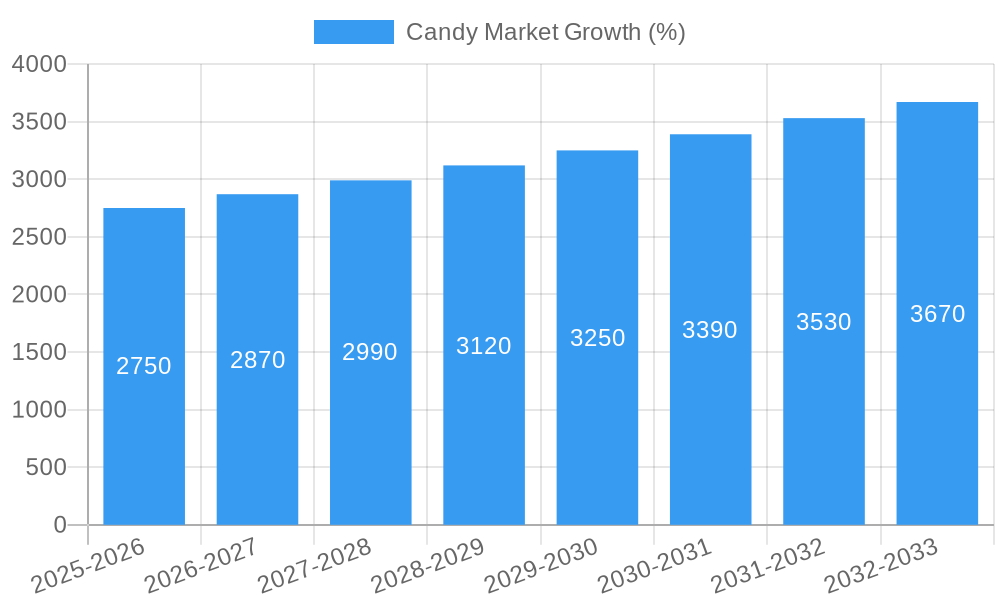
The candy market has undergone a dramatic transformation in the last five years, fueled by shifting consumer preferences, technological breakthroughs, and macroeconomic influences. Between 2019 and 2024, the market experienced moderate growth (e.g., a CAGR of X%, citing a source), influenced by factors such as increasing demand for convenient snacking options, stable economic conditions in key markets, and successful marketing campaigns by major players. However, the forecast period (2025-2033) projects accelerated growth, driven by several key factors. These include a projected Y% rise in disposable incomes in emerging markets (source), a Z% annual increase in online candy sales (source), and the continuous introduction of innovative products featuring unique flavors, textures, and functional benefits. This growth is further propelled by technological advancements like automated production lines boosting efficiency and the rise of niche e-commerce platforms specializing in artisanal or gourmet candies. Consumer demand is evolving towards healthier, premium, and personalized candy experiences, resulting in increased product diversification and a focus on ingredient transparency and sustainability. E-commerce adoption as a primary distribution channel is expected to accelerate at a CAGR of XX% during the forecast period (source).
Leading Regions, Countries, or Segments in Candy Market
The North American region currently holds the largest market share, followed by Europe and Asia Pacific. Within these regions, specific countries and segments display particularly strong performance.
By Type:
- Chocolate Candy: Maintains a dominant position due to its enduring popularity and strong brand recognition. Key drivers include the introduction of premium chocolate varieties and innovative flavor combinations.
- Non-Chocolate Candy: Exhibits robust growth, driven by the rising popularity of gummies, hard candies, and other confectionery items. Healthier options and innovative product formats are fueling this segment's expansion.
By Distribution Channel:
- Supermarkets/Hypermarkets: Remains the leading distribution channel due to its wide reach and established presence.
- Convenience Stores: Shows significant growth potential due to increasing consumer demand for quick and readily available confectionery items.
- Online Retail: Experiencing rapid expansion, propelled by the increasing adoption of e-commerce and online shopping platforms.
Key Drivers (Bullet Points):
- High per capita consumption in developed regions.
- Growing disposable incomes in emerging economies.
- Strong brand loyalty and consumer preference for established brands.
- Effective marketing and promotional campaigns by leading players.
Candy Market Product Innovations
Recent years have witnessed a remarkable surge in candy product innovation. Manufacturers are responding to the growing health-conscious consumer base by focusing on healthier options, including sugar-free, organic, and low-calorie candies, often using natural sweeteners and incorporating functional ingredients. Innovative formats and packaging are also gaining traction, with interactive and refillable containers (e.g., Push Pop Gummy Pop-its) increasing in popularity. Premiumization remains a significant trend, with manufacturers emphasizing high-quality, artisanal candies using premium ingredients and sophisticated packaging to cater to the demand for premium experiences. This is complemented by technological advancements in flavor creation, utilizing advanced techniques to develop complex and unique taste profiles, alongside production efficiencies that reduce costs while maintaining quality.
Propelling Factors for Candy Market Growth
Several key factors are driving the growth of the candy market. These include the rising disposable incomes in developing economies, leading to increased spending on discretionary items like confectionery. The enduring popularity of gifting candies during festive seasons and celebrations globally continues to fuel demand. Consistent product innovation by major players, who are constantly introducing new flavors, formats, and healthier options, is critical in maintaining consumer interest and driving growth. Furthermore, periods of positive economic conditions generally boost consumer spending and increase the appeal of candy products as a relatively affordable indulgence.
Obstacles in the Candy Market Market
Despite its growth potential, the candy market faces several challenges. Increasing health consciousness among consumers has led to a shift towards healthier alternatives, impacting sales of traditional sugar-laden candies. Furthermore, fluctuating raw material prices, particularly sugar and cocoa, pose a significant challenge to manufacturers' profitability. Stringent regulations regarding sugar content and labeling also add to the complexities of operating in this market.
Future Opportunities in Candy Market
Emerging opportunities lie in the growing demand for healthy and organic candies, expansion into new and untapped markets in developing economies, and the continuous innovation of flavors and formats. The rise of personalized and customized candy experiences also holds great potential for growth. Additionally, leveraging e-commerce for direct consumer engagement is crucial.
Major Players in the Candy Market Ecosystem
- Nestle SA
- Haribo GmbH & Co KG
- Ferrero Group
- Grupo Arcor
- Mars Incorporated
- Cloetta Ab
- Mondelez International Inc
- The Topps Company Inc
- Perfetti Van Melle Group BV
- The Hershey Company
Key Developments in Candy Market Industry
- May 2022: Bazooka Candy Brands launched Push Pop Gummy Pop-its in three flavors (strawberry, blue raspberry, berry blast, watermelon).
- March 2022: HARIBO unveiled a new lineup of Easter treats, including returning favorites and new products like Jelly Bunnies and Chick 'n' Mix.
- [Year]: Sweet & Snacks Expo in Chicago featured the latest gummy innovations.
Strategic Candy Market Market Forecast
The candy market is poised for continued growth, driven by innovation, evolving consumer preferences, and expanding global reach. The focus on healthier options, premiumization, and personalized experiences will shape future market dynamics. Emerging markets present significant growth opportunities, while the continued development of e-commerce channels will transform distribution strategies. This positive outlook signals a robust and promising future for the candy industry.
Candy Market Segmentation
-
1. Type
- 1.1. Chocolate Candy
-
1.2. Non-chocolate Candy
- 1.2.1. Hard Boiled Candies
- 1.2.2. Pastilles, Gums, Jellies, and Chews
- 1.2.3. Toffees, Caramels, and Nougat
- 1.2.4. Mints
- 1.2.5. Other Non-chocolate Candies
-
2. Distribution Channel
- 2.1. Supermarkets/Hypermarkets
- 2.2. Convenience Stores
- 2.3. Specalist Retailers
- 2.4. Online Retail
- 2.5. Other Distribution Channels
Candy Market Segmentation By Geography
-
1. North America
- 1.1. United States
- 1.2. Canada
- 1.3. Mexico
- 1.4. Rest of North America
-
2. Europe
- 2.1. Germany
- 2.2. United Kingdom
- 2.3. France
- 2.4. Russia
- 2.5. Italy
- 2.6. Spain
- 2.7. Rest of Europe
-
3. Asia Pacific
- 3.1. India
- 3.2. China
- 3.3. Australia
- 3.4. Japan
- 3.5. Rest of Asia Pacific
-
4. South America
- 4.1. Brazil
- 4.2. Argentina
- 4.3. Rest of South America
-
5. Middle East and Africa
- 5.1. United Arab Emirates
- 5.2. South Africa
- 5.3. Rest of Middle East and Africa
Candy Market REPORT HIGHLIGHTS
| Aspects | Details |
|---|---|
| Study Period | 2019-2033 |
| Base Year | 2024 |
| Estimated Year | 2025 |
| Forecast Period | 2025-2033 |
| Historical Period | 2019-2024 |
| Growth Rate | CAGR of 3.82% from 2019-2033 |
| Segmentation |
|
Table of Contents
- 1. Introduction
- 1.1. Research Scope
- 1.2. Market Segmentation
- 1.3. Research Methodology
- 1.4. Definitions and Assumptions
- 2. Executive Summary
- 2.1. Introduction
- 3. Market Dynamics
- 3.1. Introduction
- 3.2. Market Drivers
- 3.2.1. Iced Tea as a Healthy Alternative for Daily Intake; Introduction of Innovative and Flavorful Iced Tea Options
- 3.3. Market Restrains
- 3.3.1. Competiton From Substitutes
- 3.4. Market Trends
- 3.4.1. Rising Demand for Sugar-free Candies
- 4. Market Factor Analysis
- 4.1. Porters Five Forces
- 4.2. Supply/Value Chain
- 4.3. PESTEL analysis
- 4.4. Market Entropy
- 4.5. Patent/Trademark Analysis
- 5. Global Candy Market Analysis, Insights and Forecast, 2019-2031
- 5.1. Market Analysis, Insights and Forecast - by Type
- 5.1.1. Chocolate Candy
- 5.1.2. Non-chocolate Candy
- 5.1.2.1. Hard Boiled Candies
- 5.1.2.2. Pastilles, Gums, Jellies, and Chews
- 5.1.2.3. Toffees, Caramels, and Nougat
- 5.1.2.4. Mints
- 5.1.2.5. Other Non-chocolate Candies
- 5.2. Market Analysis, Insights and Forecast - by Distribution Channel
- 5.2.1. Supermarkets/Hypermarkets
- 5.2.2. Convenience Stores
- 5.2.3. Specalist Retailers
- 5.2.4. Online Retail
- 5.2.5. Other Distribution Channels
- 5.3. Market Analysis, Insights and Forecast - by Region
- 5.3.1. North America
- 5.3.2. Europe
- 5.3.3. Asia Pacific
- 5.3.4. South America
- 5.3.5. Middle East and Africa
- 5.1. Market Analysis, Insights and Forecast - by Type
- 6. North America Candy Market Analysis, Insights and Forecast, 2019-2031
- 6.1. Market Analysis, Insights and Forecast - by Type
- 6.1.1. Chocolate Candy
- 6.1.2. Non-chocolate Candy
- 6.1.2.1. Hard Boiled Candies
- 6.1.2.2. Pastilles, Gums, Jellies, and Chews
- 6.1.2.3. Toffees, Caramels, and Nougat
- 6.1.2.4. Mints
- 6.1.2.5. Other Non-chocolate Candies
- 6.2. Market Analysis, Insights and Forecast - by Distribution Channel
- 6.2.1. Supermarkets/Hypermarkets
- 6.2.2. Convenience Stores
- 6.2.3. Specalist Retailers
- 6.2.4. Online Retail
- 6.2.5. Other Distribution Channels
- 6.1. Market Analysis, Insights and Forecast - by Type
- 7. Europe Candy Market Analysis, Insights and Forecast, 2019-2031
- 7.1. Market Analysis, Insights and Forecast - by Type
- 7.1.1. Chocolate Candy
- 7.1.2. Non-chocolate Candy
- 7.1.2.1. Hard Boiled Candies
- 7.1.2.2. Pastilles, Gums, Jellies, and Chews
- 7.1.2.3. Toffees, Caramels, and Nougat
- 7.1.2.4. Mints
- 7.1.2.5. Other Non-chocolate Candies
- 7.2. Market Analysis, Insights and Forecast - by Distribution Channel
- 7.2.1. Supermarkets/Hypermarkets
- 7.2.2. Convenience Stores
- 7.2.3. Specalist Retailers
- 7.2.4. Online Retail
- 7.2.5. Other Distribution Channels
- 7.1. Market Analysis, Insights and Forecast - by Type
- 8. Asia Pacific Candy Market Analysis, Insights and Forecast, 2019-2031
- 8.1. Market Analysis, Insights and Forecast - by Type
- 8.1.1. Chocolate Candy
- 8.1.2. Non-chocolate Candy
- 8.1.2.1. Hard Boiled Candies
- 8.1.2.2. Pastilles, Gums, Jellies, and Chews
- 8.1.2.3. Toffees, Caramels, and Nougat
- 8.1.2.4. Mints
- 8.1.2.5. Other Non-chocolate Candies
- 8.2. Market Analysis, Insights and Forecast - by Distribution Channel
- 8.2.1. Supermarkets/Hypermarkets
- 8.2.2. Convenience Stores
- 8.2.3. Specalist Retailers
- 8.2.4. Online Retail
- 8.2.5. Other Distribution Channels
- 8.1. Market Analysis, Insights and Forecast - by Type
- 9. South America Candy Market Analysis, Insights and Forecast, 2019-2031
- 9.1. Market Analysis, Insights and Forecast - by Type
- 9.1.1. Chocolate Candy
- 9.1.2. Non-chocolate Candy
- 9.1.2.1. Hard Boiled Candies
- 9.1.2.2. Pastilles, Gums, Jellies, and Chews
- 9.1.2.3. Toffees, Caramels, and Nougat
- 9.1.2.4. Mints
- 9.1.2.5. Other Non-chocolate Candies
- 9.2. Market Analysis, Insights and Forecast - by Distribution Channel
- 9.2.1. Supermarkets/Hypermarkets
- 9.2.2. Convenience Stores
- 9.2.3. Specalist Retailers
- 9.2.4. Online Retail
- 9.2.5. Other Distribution Channels
- 9.1. Market Analysis, Insights and Forecast - by Type
- 10. Middle East and Africa Candy Market Analysis, Insights and Forecast, 2019-2031
- 10.1. Market Analysis, Insights and Forecast - by Type
- 10.1.1. Chocolate Candy
- 10.1.2. Non-chocolate Candy
- 10.1.2.1. Hard Boiled Candies
- 10.1.2.2. Pastilles, Gums, Jellies, and Chews
- 10.1.2.3. Toffees, Caramels, and Nougat
- 10.1.2.4. Mints
- 10.1.2.5. Other Non-chocolate Candies
- 10.2. Market Analysis, Insights and Forecast - by Distribution Channel
- 10.2.1. Supermarkets/Hypermarkets
- 10.2.2. Convenience Stores
- 10.2.3. Specalist Retailers
- 10.2.4. Online Retail
- 10.2.5. Other Distribution Channels
- 10.1. Market Analysis, Insights and Forecast - by Type
- 11. North America Candy Market Analysis, Insights and Forecast, 2019-2031
- 11.1. Market Analysis, Insights and Forecast - By Country/Sub-region
- 11.1.1 United States
- 11.1.2 Canada
- 11.1.3 Mexico
- 11.1.4 Rest of North America
- 12. Europe Candy Market Analysis, Insights and Forecast, 2019-2031
- 12.1. Market Analysis, Insights and Forecast - By Country/Sub-region
- 12.1.1 Germany
- 12.1.2 United Kingdom
- 12.1.3 France
- 12.1.4 Russia
- 12.1.5 Italy
- 12.1.6 Spain
- 12.1.7 Rest of Europe
- 13. Asia Pacific Candy Market Analysis, Insights and Forecast, 2019-2031
- 13.1. Market Analysis, Insights and Forecast - By Country/Sub-region
- 13.1.1 India
- 13.1.2 China
- 13.1.3 Australia
- 13.1.4 Japan
- 13.1.5 Rest of Asia Pacific
- 14. South America Candy Market Analysis, Insights and Forecast, 2019-2031
- 14.1. Market Analysis, Insights and Forecast - By Country/Sub-region
- 14.1.1 Brazil
- 14.1.2 Argentina
- 14.1.3 Rest of South America
- 15. Middle East and Africa Candy Market Analysis, Insights and Forecast, 2019-2031
- 15.1. Market Analysis, Insights and Forecast - By Country/Sub-region
- 15.1.1 United Arab Emirates
- 15.1.2 South Africa
- 15.1.3 Rest of Middle East and Africa
- 16. Competitive Analysis
- 16.1. Global Market Share Analysis 2024
- 16.2. Company Profiles
- 16.2.1 Nestle SA
- 16.2.1.1. Overview
- 16.2.1.2. Products
- 16.2.1.3. SWOT Analysis
- 16.2.1.4. Recent Developments
- 16.2.1.5. Financials (Based on Availability)
- 16.2.2 Haribo GmbH & Co KG
- 16.2.2.1. Overview
- 16.2.2.2. Products
- 16.2.2.3. SWOT Analysis
- 16.2.2.4. Recent Developments
- 16.2.2.5. Financials (Based on Availability)
- 16.2.3 Ferrero Group
- 16.2.3.1. Overview
- 16.2.3.2. Products
- 16.2.3.3. SWOT Analysis
- 16.2.3.4. Recent Developments
- 16.2.3.5. Financials (Based on Availability)
- 16.2.4 Grupo Arcor
- 16.2.4.1. Overview
- 16.2.4.2. Products
- 16.2.4.3. SWOT Analysis
- 16.2.4.4. Recent Developments
- 16.2.4.5. Financials (Based on Availability)
- 16.2.5 Mars Incorporated
- 16.2.5.1. Overview
- 16.2.5.2. Products
- 16.2.5.3. SWOT Analysis
- 16.2.5.4. Recent Developments
- 16.2.5.5. Financials (Based on Availability)
- 16.2.6 Cloetta Ab
- 16.2.6.1. Overview
- 16.2.6.2. Products
- 16.2.6.3. SWOT Analysis
- 16.2.6.4. Recent Developments
- 16.2.6.5. Financials (Based on Availability)
- 16.2.7 Mondelez International Inc
- 16.2.7.1. Overview
- 16.2.7.2. Products
- 16.2.7.3. SWOT Analysis
- 16.2.7.4. Recent Developments
- 16.2.7.5. Financials (Based on Availability)
- 16.2.8 The Topps Company Inc *List Not Exhaustive
- 16.2.8.1. Overview
- 16.2.8.2. Products
- 16.2.8.3. SWOT Analysis
- 16.2.8.4. Recent Developments
- 16.2.8.5. Financials (Based on Availability)
- 16.2.9 Perfetti Van Melle Group BV
- 16.2.9.1. Overview
- 16.2.9.2. Products
- 16.2.9.3. SWOT Analysis
- 16.2.9.4. Recent Developments
- 16.2.9.5. Financials (Based on Availability)
- 16.2.10 The Hershey Company
- 16.2.10.1. Overview
- 16.2.10.2. Products
- 16.2.10.3. SWOT Analysis
- 16.2.10.4. Recent Developments
- 16.2.10.5. Financials (Based on Availability)
- 16.2.1 Nestle SA
List of Figures
- Figure 1: Global Candy Market Revenue Breakdown (Million, %) by Region 2024 & 2032
- Figure 2: North America Candy Market Revenue (Million), by Country 2024 & 2032
- Figure 3: North America Candy Market Revenue Share (%), by Country 2024 & 2032
- Figure 4: Europe Candy Market Revenue (Million), by Country 2024 & 2032
- Figure 5: Europe Candy Market Revenue Share (%), by Country 2024 & 2032
- Figure 6: Asia Pacific Candy Market Revenue (Million), by Country 2024 & 2032
- Figure 7: Asia Pacific Candy Market Revenue Share (%), by Country 2024 & 2032
- Figure 8: South America Candy Market Revenue (Million), by Country 2024 & 2032
- Figure 9: South America Candy Market Revenue Share (%), by Country 2024 & 2032
- Figure 10: Middle East and Africa Candy Market Revenue (Million), by Country 2024 & 2032
- Figure 11: Middle East and Africa Candy Market Revenue Share (%), by Country 2024 & 2032
- Figure 12: North America Candy Market Revenue (Million), by Type 2024 & 2032
- Figure 13: North America Candy Market Revenue Share (%), by Type 2024 & 2032
- Figure 14: North America Candy Market Revenue (Million), by Distribution Channel 2024 & 2032
- Figure 15: North America Candy Market Revenue Share (%), by Distribution Channel 2024 & 2032
- Figure 16: North America Candy Market Revenue (Million), by Country 2024 & 2032
- Figure 17: North America Candy Market Revenue Share (%), by Country 2024 & 2032
- Figure 18: Europe Candy Market Revenue (Million), by Type 2024 & 2032
- Figure 19: Europe Candy Market Revenue Share (%), by Type 2024 & 2032
- Figure 20: Europe Candy Market Revenue (Million), by Distribution Channel 2024 & 2032
- Figure 21: Europe Candy Market Revenue Share (%), by Distribution Channel 2024 & 2032
- Figure 22: Europe Candy Market Revenue (Million), by Country 2024 & 2032
- Figure 23: Europe Candy Market Revenue Share (%), by Country 2024 & 2032
- Figure 24: Asia Pacific Candy Market Revenue (Million), by Type 2024 & 2032
- Figure 25: Asia Pacific Candy Market Revenue Share (%), by Type 2024 & 2032
- Figure 26: Asia Pacific Candy Market Revenue (Million), by Distribution Channel 2024 & 2032
- Figure 27: Asia Pacific Candy Market Revenue Share (%), by Distribution Channel 2024 & 2032
- Figure 28: Asia Pacific Candy Market Revenue (Million), by Country 2024 & 2032
- Figure 29: Asia Pacific Candy Market Revenue Share (%), by Country 2024 & 2032
- Figure 30: South America Candy Market Revenue (Million), by Type 2024 & 2032
- Figure 31: South America Candy Market Revenue Share (%), by Type 2024 & 2032
- Figure 32: South America Candy Market Revenue (Million), by Distribution Channel 2024 & 2032
- Figure 33: South America Candy Market Revenue Share (%), by Distribution Channel 2024 & 2032
- Figure 34: South America Candy Market Revenue (Million), by Country 2024 & 2032
- Figure 35: South America Candy Market Revenue Share (%), by Country 2024 & 2032
- Figure 36: Middle East and Africa Candy Market Revenue (Million), by Type 2024 & 2032
- Figure 37: Middle East and Africa Candy Market Revenue Share (%), by Type 2024 & 2032
- Figure 38: Middle East and Africa Candy Market Revenue (Million), by Distribution Channel 2024 & 2032
- Figure 39: Middle East and Africa Candy Market Revenue Share (%), by Distribution Channel 2024 & 2032
- Figure 40: Middle East and Africa Candy Market Revenue (Million), by Country 2024 & 2032
- Figure 41: Middle East and Africa Candy Market Revenue Share (%), by Country 2024 & 2032
List of Tables
- Table 1: Global Candy Market Revenue Million Forecast, by Region 2019 & 2032
- Table 2: Global Candy Market Revenue Million Forecast, by Type 2019 & 2032
- Table 3: Global Candy Market Revenue Million Forecast, by Distribution Channel 2019 & 2032
- Table 4: Global Candy Market Revenue Million Forecast, by Region 2019 & 2032
- Table 5: Global Candy Market Revenue Million Forecast, by Country 2019 & 2032
- Table 6: United States Candy Market Revenue (Million) Forecast, by Application 2019 & 2032
- Table 7: Canada Candy Market Revenue (Million) Forecast, by Application 2019 & 2032
- Table 8: Mexico Candy Market Revenue (Million) Forecast, by Application 2019 & 2032
- Table 9: Rest of North America Candy Market Revenue (Million) Forecast, by Application 2019 & 2032
- Table 10: Global Candy Market Revenue Million Forecast, by Country 2019 & 2032
- Table 11: Germany Candy Market Revenue (Million) Forecast, by Application 2019 & 2032
- Table 12: United Kingdom Candy Market Revenue (Million) Forecast, by Application 2019 & 2032
- Table 13: France Candy Market Revenue (Million) Forecast, by Application 2019 & 2032
- Table 14: Russia Candy Market Revenue (Million) Forecast, by Application 2019 & 2032
- Table 15: Italy Candy Market Revenue (Million) Forecast, by Application 2019 & 2032
- Table 16: Spain Candy Market Revenue (Million) Forecast, by Application 2019 & 2032
- Table 17: Rest of Europe Candy Market Revenue (Million) Forecast, by Application 2019 & 2032
- Table 18: Global Candy Market Revenue Million Forecast, by Country 2019 & 2032
- Table 19: India Candy Market Revenue (Million) Forecast, by Application 2019 & 2032
- Table 20: China Candy Market Revenue (Million) Forecast, by Application 2019 & 2032
- Table 21: Australia Candy Market Revenue (Million) Forecast, by Application 2019 & 2032
- Table 22: Japan Candy Market Revenue (Million) Forecast, by Application 2019 & 2032
- Table 23: Rest of Asia Pacific Candy Market Revenue (Million) Forecast, by Application 2019 & 2032
- Table 24: Global Candy Market Revenue Million Forecast, by Country 2019 & 2032
- Table 25: Brazil Candy Market Revenue (Million) Forecast, by Application 2019 & 2032
- Table 26: Argentina Candy Market Revenue (Million) Forecast, by Application 2019 & 2032
- Table 27: Rest of South America Candy Market Revenue (Million) Forecast, by Application 2019 & 2032
- Table 28: Global Candy Market Revenue Million Forecast, by Country 2019 & 2032
- Table 29: United Arab Emirates Candy Market Revenue (Million) Forecast, by Application 2019 & 2032
- Table 30: South Africa Candy Market Revenue (Million) Forecast, by Application 2019 & 2032
- Table 31: Rest of Middle East and Africa Candy Market Revenue (Million) Forecast, by Application 2019 & 2032
- Table 32: Global Candy Market Revenue Million Forecast, by Type 2019 & 2032
- Table 33: Global Candy Market Revenue Million Forecast, by Distribution Channel 2019 & 2032
- Table 34: Global Candy Market Revenue Million Forecast, by Country 2019 & 2032
- Table 35: United States Candy Market Revenue (Million) Forecast, by Application 2019 & 2032
- Table 36: Canada Candy Market Revenue (Million) Forecast, by Application 2019 & 2032
- Table 37: Mexico Candy Market Revenue (Million) Forecast, by Application 2019 & 2032
- Table 38: Rest of North America Candy Market Revenue (Million) Forecast, by Application 2019 & 2032
- Table 39: Global Candy Market Revenue Million Forecast, by Type 2019 & 2032
- Table 40: Global Candy Market Revenue Million Forecast, by Distribution Channel 2019 & 2032
- Table 41: Global Candy Market Revenue Million Forecast, by Country 2019 & 2032
- Table 42: Germany Candy Market Revenue (Million) Forecast, by Application 2019 & 2032
- Table 43: United Kingdom Candy Market Revenue (Million) Forecast, by Application 2019 & 2032
- Table 44: France Candy Market Revenue (Million) Forecast, by Application 2019 & 2032
- Table 45: Russia Candy Market Revenue (Million) Forecast, by Application 2019 & 2032
- Table 46: Italy Candy Market Revenue (Million) Forecast, by Application 2019 & 2032
- Table 47: Spain Candy Market Revenue (Million) Forecast, by Application 2019 & 2032
- Table 48: Rest of Europe Candy Market Revenue (Million) Forecast, by Application 2019 & 2032
- Table 49: Global Candy Market Revenue Million Forecast, by Type 2019 & 2032
- Table 50: Global Candy Market Revenue Million Forecast, by Distribution Channel 2019 & 2032
- Table 51: Global Candy Market Revenue Million Forecast, by Country 2019 & 2032
- Table 52: India Candy Market Revenue (Million) Forecast, by Application 2019 & 2032
- Table 53: China Candy Market Revenue (Million) Forecast, by Application 2019 & 2032
- Table 54: Australia Candy Market Revenue (Million) Forecast, by Application 2019 & 2032
- Table 55: Japan Candy Market Revenue (Million) Forecast, by Application 2019 & 2032
- Table 56: Rest of Asia Pacific Candy Market Revenue (Million) Forecast, by Application 2019 & 2032
- Table 57: Global Candy Market Revenue Million Forecast, by Type 2019 & 2032
- Table 58: Global Candy Market Revenue Million Forecast, by Distribution Channel 2019 & 2032
- Table 59: Global Candy Market Revenue Million Forecast, by Country 2019 & 2032
- Table 60: Brazil Candy Market Revenue (Million) Forecast, by Application 2019 & 2032
- Table 61: Argentina Candy Market Revenue (Million) Forecast, by Application 2019 & 2032
- Table 62: Rest of South America Candy Market Revenue (Million) Forecast, by Application 2019 & 2032
- Table 63: Global Candy Market Revenue Million Forecast, by Type 2019 & 2032
- Table 64: Global Candy Market Revenue Million Forecast, by Distribution Channel 2019 & 2032
- Table 65: Global Candy Market Revenue Million Forecast, by Country 2019 & 2032
- Table 66: United Arab Emirates Candy Market Revenue (Million) Forecast, by Application 2019 & 2032
- Table 67: South Africa Candy Market Revenue (Million) Forecast, by Application 2019 & 2032
- Table 68: Rest of Middle East and Africa Candy Market Revenue (Million) Forecast, by Application 2019 & 2032
Frequently Asked Questions
1. What is the projected Compound Annual Growth Rate (CAGR) of the Candy Market?
The projected CAGR is approximately 3.82%.
2. Which companies are prominent players in the Candy Market?
Key companies in the market include Nestle SA, Haribo GmbH & Co KG, Ferrero Group, Grupo Arcor, Mars Incorporated, Cloetta Ab, Mondelez International Inc, The Topps Company Inc *List Not Exhaustive, Perfetti Van Melle Group BV, The Hershey Company.
3. What are the main segments of the Candy Market?
The market segments include Type, Distribution Channel.
4. Can you provide details about the market size?
The market size is estimated to be USD 69.20 Million as of 2022.
5. What are some drivers contributing to market growth?
Iced Tea as a Healthy Alternative for Daily Intake; Introduction of Innovative and Flavorful Iced Tea Options.
6. What are the notable trends driving market growth?
Rising Demand for Sugar-free Candies.
7. Are there any restraints impacting market growth?
Competiton From Substitutes.
8. Can you provide examples of recent developments in the market?
In May 2022, Push Pop Gummy Pop-its were introduced by Bazooka Candy Brands. This year's Sweet & Snacks Expo in Chicago will feature the newest gummy innovation. Push Pop Gummy Pop-its, which debuted under the Push Pop brand, combine gummies with an interactive, refillable container.
9. What pricing options are available for accessing the report?
Pricing options include single-user, multi-user, and enterprise licenses priced at USD 4750, USD 5250, and USD 8750 respectively.
10. Is the market size provided in terms of value or volume?
The market size is provided in terms of value, measured in Million.
11. Are there any specific market keywords associated with the report?
Yes, the market keyword associated with the report is "Candy Market," which aids in identifying and referencing the specific market segment covered.
12. How do I determine which pricing option suits my needs best?
The pricing options vary based on user requirements and access needs. Individual users may opt for single-user licenses, while businesses requiring broader access may choose multi-user or enterprise licenses for cost-effective access to the report.
13. Are there any additional resources or data provided in the Candy Market report?
While the report offers comprehensive insights, it's advisable to review the specific contents or supplementary materials provided to ascertain if additional resources or data are available.
14. How can I stay updated on further developments or reports in the Candy Market?
To stay informed about further developments, trends, and reports in the Candy Market, consider subscribing to industry newsletters, following relevant companies and organizations, or regularly checking reputable industry news sources and publications.
Methodology
Step 1 - Identification of Relevant Samples Size from Population Database


Step 2 - Approaches for Defining Global Market Size (Value, Volume* & Price*)

Note*: In applicable scenarios
Step 3 - Data Sources
Primary Research
- Web Analytics
- Survey Reports
- Research Institute
- Latest Research Reports
- Opinion Leaders
Secondary Research
- Annual Reports
- White Paper
- Latest Press Release
- Industry Association
- Paid Database
- Investor Presentations

Step 4 - Data Triangulation
Involves using different sources of information in order to increase the validity of a study
These sources are likely to be stakeholders in a program - participants, other researchers, program staff, other community members, and so on.
Then we put all data in single framework & apply various statistical tools to find out the dynamic on the market.
During the analysis stage, feedback from the stakeholder groups would be compared to determine areas of agreement as well as areas of divergence
