

Key Insights
The Business Process as a Service (BPaaS) market is experiencing robust growth, driven by the increasing need for cost optimization, enhanced operational efficiency, and improved scalability among businesses globally. The market's Compound Annual Growth Rate (CAGR) of 10.89% from 2019 to 2024 suggests a significant expansion, projected to continue through 2033. Key drivers include the rising adoption of cloud-based solutions, the increasing demand for specialized services like human resource management (HRM) and accounting and finance, and the growing preference for outsourcing non-core business functions. The shift towards digital transformation across various sectors, including banking, financial services and insurance (BFSI), healthcare, and retail, further fuels market growth. Large enterprises are leading the adoption, driven by their need for sophisticated solutions and large-scale implementations. However, concerns about data security and vendor lock-in remain potential restraints. The market is segmented by end-user industry, organizational size, and process type, offering diverse opportunities for BPaaS providers. North America currently holds a significant market share due to high technological adoption and a mature IT infrastructure, followed by Europe and Asia-Pacific, with the latter experiencing rapid growth.
The competitive landscape is highly fragmented, with both large multinational corporations like Accenture, IBM, and Wipro, and smaller specialized providers vying for market share. The success of these companies hinges on their ability to offer innovative solutions, robust security measures, and flexible service models catering to the specific needs of different industries and organizational sizes. Future market growth will be influenced by factors such as advancements in artificial intelligence (AI), automation technologies, and the evolving regulatory landscape. Continued investment in research and development, strategic partnerships, and acquisitions will be crucial for maintaining competitiveness in this dynamic market. The BPaaS market is anticipated to reach substantial value by 2033, driven by sustained demand for agile, scalable, and cost-effective business solutions. The focus on value-added services, process automation, and the incorporation of emerging technologies will be paramount for sustained growth and market leadership in the coming years.
Business Process as a Service (BPaaS) Industry Market Report: 2019-2033
This comprehensive report provides a detailed analysis of the Business Process as a Service (BPaaS) industry, projecting a market valued at $XX Million by 2033. It covers market composition, leading players, technological advancements, and future growth opportunities, offering invaluable insights for stakeholders across the value chain. The report uses 2025 as the base year and incorporates data from the historical period (2019-2024) and forecast period (2025-2033).
Business Process as a Service Industry Market Composition & Trends
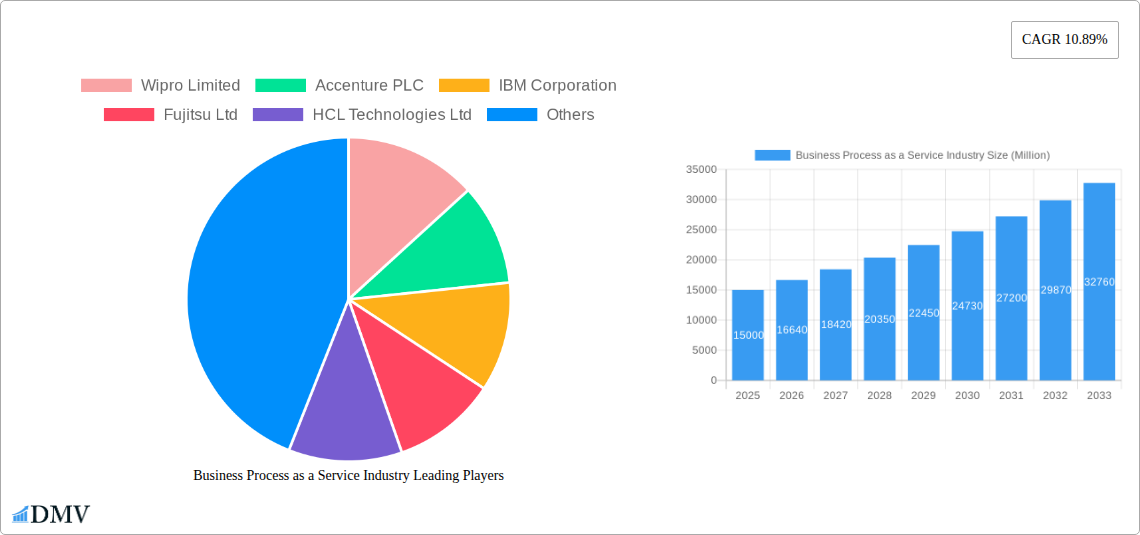
The BPaaS market, estimated at $XX Million in 2025, is characterized by a moderately concentrated landscape with key players holding significant market share. Wipro Limited, Accenture PLC, IBM Corporation, and others control a substantial portion of the market, though the exact distribution remains dynamic due to ongoing mergers and acquisitions (M&A) activity. Innovation is driven by advancements in artificial intelligence (AI), automation, and cloud computing, leading to enhanced efficiency and cost reduction for businesses. Regulatory landscapes, varying across different regions, play a significant role in shaping market dynamics and influencing adoption rates. Substitute products, such as in-house process management, exist but often lack the scalability and cost-effectiveness of BPaaS solutions. The end-user profile is diverse, spanning various industries and organizational sizes.
- Market Share Distribution (2025): Wipro Limited (XX%), Accenture PLC (XX%), IBM Corporation (XX%), Others (XX%)
- M&A Activity (2019-2024): Total deal value estimated at $XX Million, with significant transactions focused on expanding service portfolios and geographic reach.
- Innovation Catalysts: AI, automation, cloud computing, blockchain.
- Regulatory Landscape: Significant variations across regions impacting data privacy, security, and compliance.
Business Process as a Service Industry Industry Evolution
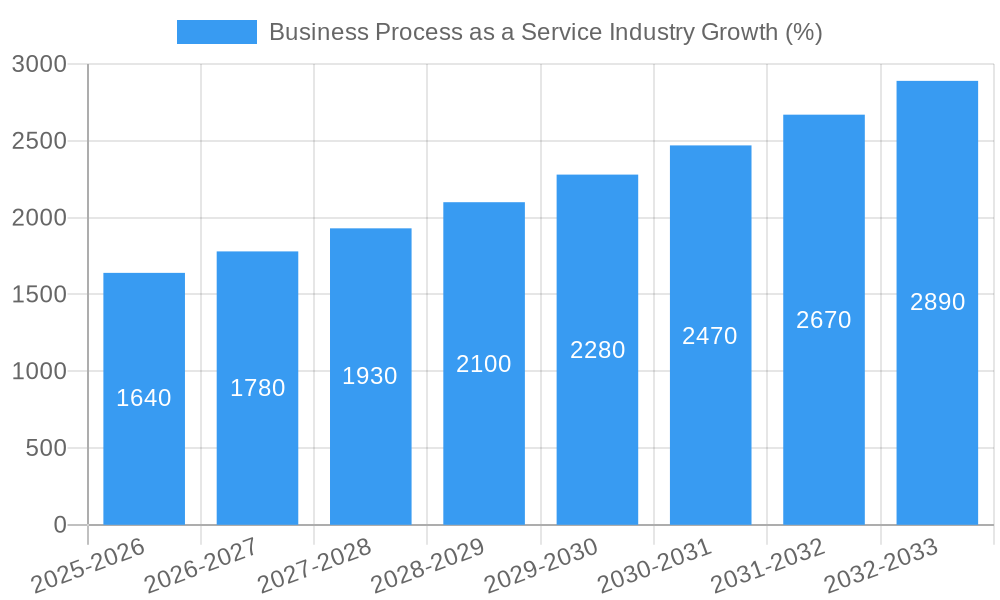
The BPaaS market exhibits a robust growth trajectory, driven by the increasing adoption of cloud-based solutions and the growing need for operational efficiency across various industries. Between 2019 and 2024, the market experienced a Compound Annual Growth Rate (CAGR) of XX%, projected to reach a CAGR of XX% from 2025 to 2033. This growth is fueled by several factors including: the rising demand for digital transformation initiatives within organizations of all sizes; the increasing complexity of business processes; and the growing availability of advanced technologies such as AI and machine learning, facilitating automation and enhancing process efficiency. The market has witnessed a shift in consumer demands towards more flexible, scalable, and cost-effective solutions, prompting BPaaS providers to constantly innovate and adapt their offerings. This trend is expected to accelerate in the coming years, leading to further market expansion. Specific examples of technological advancements include the increased integration of AI and machine learning capabilities within BPaaS solutions, enabling improved process automation and decision-making.
Leading Regions, Countries, or Segments in Business Process as a Service Industry
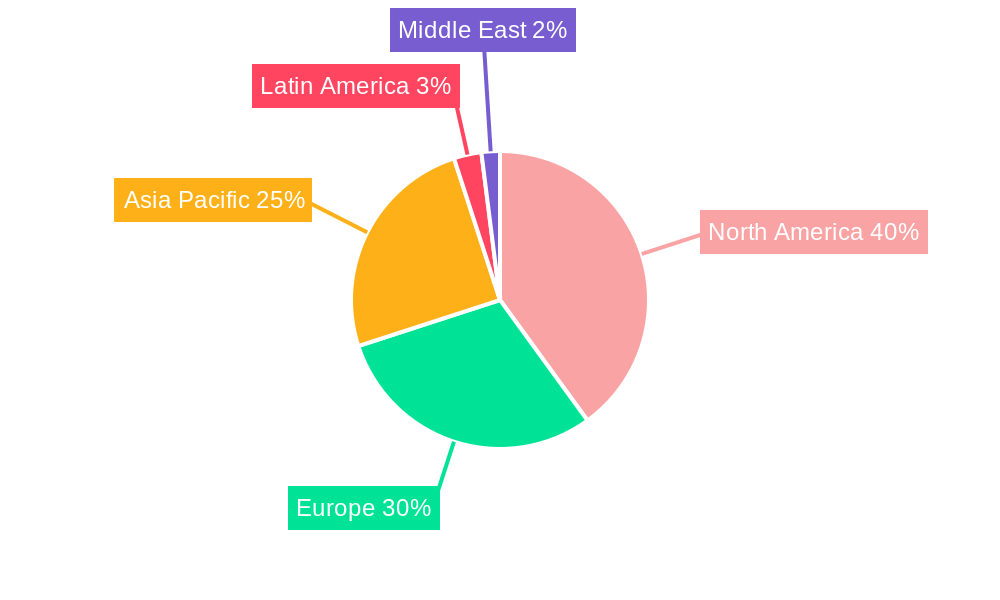
The BPaaS market exhibits significant regional variations in growth and adoption. While a definitive "dominant" region is difficult to pinpoint definitively without specific data, North America and Europe are currently leading in terms of market size and adoption due to high technological maturity and strong demand for digital transformation. However, the Asia-Pacific region is witnessing rapid growth, driven by expanding economies and increasing investment in technology.
By End-user Industry: BFSI (Banking, Financial Services and Insurance) and IT and Telecommunication currently hold the largest shares, driven by high regulatory compliance demands and high-volume transaction processing needs. However, Government and Defense, Healthcare, and Manufacturing sectors are exhibiting strong growth potential due to increasing adoption of cloud-based solutions and the need for improved operational efficiency.
By Size of Organization: Large enterprises currently dominate the market due to their greater resources and higher spending capacity. However, the segment of small and medium-sized organizations (SMOs) is also exhibiting substantial growth, driven by the availability of affordable and scalable BPaaS solutions.
By Process: Accounting and Finance, and Supply Chain Management segments lead in BPaaS adoption due to their inherent suitability for automation and efficiency improvements. However, growth is expected across all process categories as BPaaS providers expand their offerings.
Key Drivers: High levels of investment in digital transformation, supportive regulatory environments (particularly in regions with data privacy regulations), and increasing awareness of the benefits of BPaaS solutions.
Business Process as a Service Industry Product Innovations
Recent product innovations in the BPaaS sector are centered around AI-powered automation, enhanced security features, and improved integration with existing enterprise systems. This includes solutions like intelligent document processing, robotic process automation (RPA), and advanced analytics platforms. Key performance metrics include reduced operational costs, increased process efficiency, improved compliance, and enhanced customer satisfaction. Unique selling propositions often revolve around specialized industry solutions, flexible pricing models, and strong security guarantees.
Propelling Factors for Business Process as a Service Industry Growth
The BPaaS market is driven by several key factors. Technological advancements, like AI and automation, enable greater efficiency and scalability. Economically, BPaaS provides cost savings through reduced operational expenditure and optimized resource allocation. Favorable regulatory environments, such as supportive data privacy legislation (though regulations can also present obstacles), facilitate wider adoption. For example, the increasing need for data security and compliance fuels demand for secure BPaaS solutions.
Obstacles in the Business Process as a Service Industry Market
The BPaaS market faces challenges including stringent data privacy regulations that increase compliance costs and complexity, potential supply chain disruptions affecting service delivery, and intense competition among established and emerging players leading to price pressures and margin erosion. These factors can negatively impact adoption rates and overall market growth if not effectively addressed.
Future Opportunities in Business Process as a Service Industry
Emerging opportunities include expansion into new geographic markets, particularly in developing economies with increasing digitalization, leveraging advanced technologies like blockchain and edge computing, and catering to emerging industry-specific needs within sectors like healthcare and fintech. Focus on developing niche BPaaS solutions tailored to specific industry verticals or business processes will also be critical for success.
Major Players in the Business Process as a Service Industry Ecosystem
- Wipro Limited
- Accenture PLC
- IBM Corporation
- Fujitsu Ltd
- HCL Technologies Ltd
- Tata Consultancy Services Limited
- Oracle Corporation
- Capgemini SE
- Cognizant Technology Solutions
- Genpact Limited
Key Developments in Business Process as a Service Industry Industry
November 2022: Infosys BPM and IBM launch an AI and automation center in Poland, offering solutions leveraging IBM's CloudPak, Watson AI, and blockchain technologies. This significantly enhances Infosys's BPaaS capabilities, particularly in AI-driven automation.
May 2022: Oracle enhances its cloud security with integrated threat management, strengthening its BPaaS offering by improving data protection and compliance. This directly addresses a key concern for BPaaS clients.
April 2022: Fujitsu launches its Fujitsu Computing as a Service (CaaS), expanding its BPaaS portfolio and providing access to advanced computing technologies via the cloud. This broadens the scope of its offerings and drives competitiveness.
March 2022: Oracle Cloud Infrastructure expands with new services, enhancing flexibility and cost-effectiveness for BPaaS clients. This improves the underlying infrastructure supporting BPaaS offerings.
Strategic Business Process as a Service Industry Market Forecast
The BPaaS market is poised for sustained growth, driven by continuous technological advancements, increasing digital transformation initiatives, and expanding demand across various industries. The ongoing integration of AI, automation, and advanced analytics within BPaaS solutions will drive further efficiency gains and cost reductions, creating significant opportunities for both existing and new market players. The market’s future success hinges on adaptability, innovation, and addressing evolving customer needs and regulatory compliance requirements.
Business Process as a Service Industry Segmentation
-
1. Size of Organization
- 1.1. Small and Medium Organizations
- 1.2. Large Enterprises
-
2. Process
- 2.1. Human Resource Management
- 2.2. Accounting and Finance
- 2.3. Sales and Marketing
- 2.4. Supply Chain Management
- 2.5. Other Processes
-
3. End-user Industry
- 3.1. Government and Defense
- 3.2. Banking, Financial Services and Insurance (BFSI)
- 3.3. IT and Telecommunication
- 3.4. Healthcare
- 3.5. Retail
- 3.6. Manufacturing
- 3.7. Other End-user Industries
Business Process as a Service Industry Segmentation By Geography
-
1. North America
- 1.1. United States
- 1.2. Canada
-
2. Europe
- 2.1. United Kingdom
- 2.2. Germany
- 2.3. France
- 2.4. Rest of Europe
-
3. Asia Pacific
- 3.1. China
- 3.2. India
- 3.3. Japan
- 3.4. Rest of Asia Pacific
- 4. Latin America
- 5. Middle East
Business Process as a Service Industry REPORT HIGHLIGHTS
| Aspects | Details |
|---|---|
| Study Period | 2019-2033 |
| Base Year | 2024 |
| Estimated Year | 2025 |
| Forecast Period | 2025-2033 |
| Historical Period | 2019-2024 |
| Growth Rate | CAGR of 10.89% from 2019-2033 |
| Segmentation |
|
Table of Contents
- 1. Introduction
- 1.1. Research Scope
- 1.2. Market Segmentation
- 1.3. Research Methodology
- 1.4. Definitions and Assumptions
- 2. Executive Summary
- 2.1. Introduction
- 3. Market Dynamics
- 3.1. Introduction
- 3.2. Market Drivers
- 3.2.1. Growing Demand for Cloud Services and Standard Operating Processes; Rising Need for the Reduction of Operational Costs and Improvement of Productivity
- 3.3. Market Restrains
- 3.3.1. Managing Regulatory and Compliance Needs Across the World
- 3.4. Market Trends
- 3.4.1. Reduction of Operational Costs and Productivity Improvement to Drive the Market
- 4. Market Factor Analysis
- 4.1. Porters Five Forces
- 4.2. Supply/Value Chain
- 4.3. PESTEL analysis
- 4.4. Market Entropy
- 4.5. Patent/Trademark Analysis
- 5. Global Business Process as a Service Industry Analysis, Insights and Forecast, 2019-2031
- 5.1. Market Analysis, Insights and Forecast - by Size of Organization
- 5.1.1. Small and Medium Organizations
- 5.1.2. Large Enterprises
- 5.2. Market Analysis, Insights and Forecast - by Process
- 5.2.1. Human Resource Management
- 5.2.2. Accounting and Finance
- 5.2.3. Sales and Marketing
- 5.2.4. Supply Chain Management
- 5.2.5. Other Processes
- 5.3. Market Analysis, Insights and Forecast - by End-user Industry
- 5.3.1. Government and Defense
- 5.3.2. Banking, Financial Services and Insurance (BFSI)
- 5.3.3. IT and Telecommunication
- 5.3.4. Healthcare
- 5.3.5. Retail
- 5.3.6. Manufacturing
- 5.3.7. Other End-user Industries
- 5.4. Market Analysis, Insights and Forecast - by Region
- 5.4.1. North America
- 5.4.2. Europe
- 5.4.3. Asia Pacific
- 5.4.4. Latin America
- 5.4.5. Middle East
- 5.1. Market Analysis, Insights and Forecast - by Size of Organization
- 6. North America Business Process as a Service Industry Analysis, Insights and Forecast, 2019-2031
- 6.1. Market Analysis, Insights and Forecast - by Size of Organization
- 6.1.1. Small and Medium Organizations
- 6.1.2. Large Enterprises
- 6.2. Market Analysis, Insights and Forecast - by Process
- 6.2.1. Human Resource Management
- 6.2.2. Accounting and Finance
- 6.2.3. Sales and Marketing
- 6.2.4. Supply Chain Management
- 6.2.5. Other Processes
- 6.3. Market Analysis, Insights and Forecast - by End-user Industry
- 6.3.1. Government and Defense
- 6.3.2. Banking, Financial Services and Insurance (BFSI)
- 6.3.3. IT and Telecommunication
- 6.3.4. Healthcare
- 6.3.5. Retail
- 6.3.6. Manufacturing
- 6.3.7. Other End-user Industries
- 6.1. Market Analysis, Insights and Forecast - by Size of Organization
- 7. Europe Business Process as a Service Industry Analysis, Insights and Forecast, 2019-2031
- 7.1. Market Analysis, Insights and Forecast - by Size of Organization
- 7.1.1. Small and Medium Organizations
- 7.1.2. Large Enterprises
- 7.2. Market Analysis, Insights and Forecast - by Process
- 7.2.1. Human Resource Management
- 7.2.2. Accounting and Finance
- 7.2.3. Sales and Marketing
- 7.2.4. Supply Chain Management
- 7.2.5. Other Processes
- 7.3. Market Analysis, Insights and Forecast - by End-user Industry
- 7.3.1. Government and Defense
- 7.3.2. Banking, Financial Services and Insurance (BFSI)
- 7.3.3. IT and Telecommunication
- 7.3.4. Healthcare
- 7.3.5. Retail
- 7.3.6. Manufacturing
- 7.3.7. Other End-user Industries
- 7.1. Market Analysis, Insights and Forecast - by Size of Organization
- 8. Asia Pacific Business Process as a Service Industry Analysis, Insights and Forecast, 2019-2031
- 8.1. Market Analysis, Insights and Forecast - by Size of Organization
- 8.1.1. Small and Medium Organizations
- 8.1.2. Large Enterprises
- 8.2. Market Analysis, Insights and Forecast - by Process
- 8.2.1. Human Resource Management
- 8.2.2. Accounting and Finance
- 8.2.3. Sales and Marketing
- 8.2.4. Supply Chain Management
- 8.2.5. Other Processes
- 8.3. Market Analysis, Insights and Forecast - by End-user Industry
- 8.3.1. Government and Defense
- 8.3.2. Banking, Financial Services and Insurance (BFSI)
- 8.3.3. IT and Telecommunication
- 8.3.4. Healthcare
- 8.3.5. Retail
- 8.3.6. Manufacturing
- 8.3.7. Other End-user Industries
- 8.1. Market Analysis, Insights and Forecast - by Size of Organization
- 9. Latin America Business Process as a Service Industry Analysis, Insights and Forecast, 2019-2031
- 9.1. Market Analysis, Insights and Forecast - by Size of Organization
- 9.1.1. Small and Medium Organizations
- 9.1.2. Large Enterprises
- 9.2. Market Analysis, Insights and Forecast - by Process
- 9.2.1. Human Resource Management
- 9.2.2. Accounting and Finance
- 9.2.3. Sales and Marketing
- 9.2.4. Supply Chain Management
- 9.2.5. Other Processes
- 9.3. Market Analysis, Insights and Forecast - by End-user Industry
- 9.3.1. Government and Defense
- 9.3.2. Banking, Financial Services and Insurance (BFSI)
- 9.3.3. IT and Telecommunication
- 9.3.4. Healthcare
- 9.3.5. Retail
- 9.3.6. Manufacturing
- 9.3.7. Other End-user Industries
- 9.1. Market Analysis, Insights and Forecast - by Size of Organization
- 10. Middle East Business Process as a Service Industry Analysis, Insights and Forecast, 2019-2031
- 10.1. Market Analysis, Insights and Forecast - by Size of Organization
- 10.1.1. Small and Medium Organizations
- 10.1.2. Large Enterprises
- 10.2. Market Analysis, Insights and Forecast - by Process
- 10.2.1. Human Resource Management
- 10.2.2. Accounting and Finance
- 10.2.3. Sales and Marketing
- 10.2.4. Supply Chain Management
- 10.2.5. Other Processes
- 10.3. Market Analysis, Insights and Forecast - by End-user Industry
- 10.3.1. Government and Defense
- 10.3.2. Banking, Financial Services and Insurance (BFSI)
- 10.3.3. IT and Telecommunication
- 10.3.4. Healthcare
- 10.3.5. Retail
- 10.3.6. Manufacturing
- 10.3.7. Other End-user Industries
- 10.1. Market Analysis, Insights and Forecast - by Size of Organization
- 11. North America Business Process as a Service Industry Analysis, Insights and Forecast, 2019-2031
- 11.1. Market Analysis, Insights and Forecast - By Country/Sub-region
- 11.1.1 United States
- 11.1.2 Canada
- 12. Europe Business Process as a Service Industry Analysis, Insights and Forecast, 2019-2031
- 12.1. Market Analysis, Insights and Forecast - By Country/Sub-region
- 12.1.1 United Kingdom
- 12.1.2 Germany
- 12.1.3 France
- 12.1.4 Rest of Europe
- 13. Asia Pacific Business Process as a Service Industry Analysis, Insights and Forecast, 2019-2031
- 13.1. Market Analysis, Insights and Forecast - By Country/Sub-region
- 13.1.1 China
- 13.1.2 India
- 13.1.3 Japan
- 13.1.4 Rest of Asia Pacific
- 14. Latin America Business Process as a Service Industry Analysis, Insights and Forecast, 2019-2031
- 14.1. Market Analysis, Insights and Forecast - By Country/Sub-region
- 14.1.1.
- 15. Middle East Business Process as a Service Industry Analysis, Insights and Forecast, 2019-2031
- 15.1. Market Analysis, Insights and Forecast - By Country/Sub-region
- 15.1.1.
- 16. Competitive Analysis
- 16.1. Global Market Share Analysis 2024
- 16.2. Company Profiles
- 16.2.1 Wipro Limited
- 16.2.1.1. Overview
- 16.2.1.2. Products
- 16.2.1.3. SWOT Analysis
- 16.2.1.4. Recent Developments
- 16.2.1.5. Financials (Based on Availability)
- 16.2.2 Accenture PLC
- 16.2.2.1. Overview
- 16.2.2.2. Products
- 16.2.2.3. SWOT Analysis
- 16.2.2.4. Recent Developments
- 16.2.2.5. Financials (Based on Availability)
- 16.2.3 IBM Corporation
- 16.2.3.1. Overview
- 16.2.3.2. Products
- 16.2.3.3. SWOT Analysis
- 16.2.3.4. Recent Developments
- 16.2.3.5. Financials (Based on Availability)
- 16.2.4 Fujitsu Ltd
- 16.2.4.1. Overview
- 16.2.4.2. Products
- 16.2.4.3. SWOT Analysis
- 16.2.4.4. Recent Developments
- 16.2.4.5. Financials (Based on Availability)
- 16.2.5 HCL Technologies Ltd
- 16.2.5.1. Overview
- 16.2.5.2. Products
- 16.2.5.3. SWOT Analysis
- 16.2.5.4. Recent Developments
- 16.2.5.5. Financials (Based on Availability)
- 16.2.6 Tata Consultancy Services Limited
- 16.2.6.1. Overview
- 16.2.6.2. Products
- 16.2.6.3. SWOT Analysis
- 16.2.6.4. Recent Developments
- 16.2.6.5. Financials (Based on Availability)
- 16.2.7 Oracle Corporation
- 16.2.7.1. Overview
- 16.2.7.2. Products
- 16.2.7.3. SWOT Analysis
- 16.2.7.4. Recent Developments
- 16.2.7.5. Financials (Based on Availability)
- 16.2.8 Capgemini SE*List Not Exhaustive
- 16.2.8.1. Overview
- 16.2.8.2. Products
- 16.2.8.3. SWOT Analysis
- 16.2.8.4. Recent Developments
- 16.2.8.5. Financials (Based on Availability)
- 16.2.9 Cognizant Technology Solutions
- 16.2.9.1. Overview
- 16.2.9.2. Products
- 16.2.9.3. SWOT Analysis
- 16.2.9.4. Recent Developments
- 16.2.9.5. Financials (Based on Availability)
- 16.2.10 Genpact Limited
- 16.2.10.1. Overview
- 16.2.10.2. Products
- 16.2.10.3. SWOT Analysis
- 16.2.10.4. Recent Developments
- 16.2.10.5. Financials (Based on Availability)
- 16.2.1 Wipro Limited
List of Figures
- Figure 1: Global Business Process as a Service Industry Revenue Breakdown (Million, %) by Region 2024 & 2032
- Figure 2: North America Business Process as a Service Industry Revenue (Million), by Country 2024 & 2032
- Figure 3: North America Business Process as a Service Industry Revenue Share (%), by Country 2024 & 2032
- Figure 4: Europe Business Process as a Service Industry Revenue (Million), by Country 2024 & 2032
- Figure 5: Europe Business Process as a Service Industry Revenue Share (%), by Country 2024 & 2032
- Figure 6: Asia Pacific Business Process as a Service Industry Revenue (Million), by Country 2024 & 2032
- Figure 7: Asia Pacific Business Process as a Service Industry Revenue Share (%), by Country 2024 & 2032
- Figure 8: Latin America Business Process as a Service Industry Revenue (Million), by Country 2024 & 2032
- Figure 9: Latin America Business Process as a Service Industry Revenue Share (%), by Country 2024 & 2032
- Figure 10: Middle East Business Process as a Service Industry Revenue (Million), by Country 2024 & 2032
- Figure 11: Middle East Business Process as a Service Industry Revenue Share (%), by Country 2024 & 2032
- Figure 12: North America Business Process as a Service Industry Revenue (Million), by Size of Organization 2024 & 2032
- Figure 13: North America Business Process as a Service Industry Revenue Share (%), by Size of Organization 2024 & 2032
- Figure 14: North America Business Process as a Service Industry Revenue (Million), by Process 2024 & 2032
- Figure 15: North America Business Process as a Service Industry Revenue Share (%), by Process 2024 & 2032
- Figure 16: North America Business Process as a Service Industry Revenue (Million), by End-user Industry 2024 & 2032
- Figure 17: North America Business Process as a Service Industry Revenue Share (%), by End-user Industry 2024 & 2032
- Figure 18: North America Business Process as a Service Industry Revenue (Million), by Country 2024 & 2032
- Figure 19: North America Business Process as a Service Industry Revenue Share (%), by Country 2024 & 2032
- Figure 20: Europe Business Process as a Service Industry Revenue (Million), by Size of Organization 2024 & 2032
- Figure 21: Europe Business Process as a Service Industry Revenue Share (%), by Size of Organization 2024 & 2032
- Figure 22: Europe Business Process as a Service Industry Revenue (Million), by Process 2024 & 2032
- Figure 23: Europe Business Process as a Service Industry Revenue Share (%), by Process 2024 & 2032
- Figure 24: Europe Business Process as a Service Industry Revenue (Million), by End-user Industry 2024 & 2032
- Figure 25: Europe Business Process as a Service Industry Revenue Share (%), by End-user Industry 2024 & 2032
- Figure 26: Europe Business Process as a Service Industry Revenue (Million), by Country 2024 & 2032
- Figure 27: Europe Business Process as a Service Industry Revenue Share (%), by Country 2024 & 2032
- Figure 28: Asia Pacific Business Process as a Service Industry Revenue (Million), by Size of Organization 2024 & 2032
- Figure 29: Asia Pacific Business Process as a Service Industry Revenue Share (%), by Size of Organization 2024 & 2032
- Figure 30: Asia Pacific Business Process as a Service Industry Revenue (Million), by Process 2024 & 2032
- Figure 31: Asia Pacific Business Process as a Service Industry Revenue Share (%), by Process 2024 & 2032
- Figure 32: Asia Pacific Business Process as a Service Industry Revenue (Million), by End-user Industry 2024 & 2032
- Figure 33: Asia Pacific Business Process as a Service Industry Revenue Share (%), by End-user Industry 2024 & 2032
- Figure 34: Asia Pacific Business Process as a Service Industry Revenue (Million), by Country 2024 & 2032
- Figure 35: Asia Pacific Business Process as a Service Industry Revenue Share (%), by Country 2024 & 2032
- Figure 36: Latin America Business Process as a Service Industry Revenue (Million), by Size of Organization 2024 & 2032
- Figure 37: Latin America Business Process as a Service Industry Revenue Share (%), by Size of Organization 2024 & 2032
- Figure 38: Latin America Business Process as a Service Industry Revenue (Million), by Process 2024 & 2032
- Figure 39: Latin America Business Process as a Service Industry Revenue Share (%), by Process 2024 & 2032
- Figure 40: Latin America Business Process as a Service Industry Revenue (Million), by End-user Industry 2024 & 2032
- Figure 41: Latin America Business Process as a Service Industry Revenue Share (%), by End-user Industry 2024 & 2032
- Figure 42: Latin America Business Process as a Service Industry Revenue (Million), by Country 2024 & 2032
- Figure 43: Latin America Business Process as a Service Industry Revenue Share (%), by Country 2024 & 2032
- Figure 44: Middle East Business Process as a Service Industry Revenue (Million), by Size of Organization 2024 & 2032
- Figure 45: Middle East Business Process as a Service Industry Revenue Share (%), by Size of Organization 2024 & 2032
- Figure 46: Middle East Business Process as a Service Industry Revenue (Million), by Process 2024 & 2032
- Figure 47: Middle East Business Process as a Service Industry Revenue Share (%), by Process 2024 & 2032
- Figure 48: Middle East Business Process as a Service Industry Revenue (Million), by End-user Industry 2024 & 2032
- Figure 49: Middle East Business Process as a Service Industry Revenue Share (%), by End-user Industry 2024 & 2032
- Figure 50: Middle East Business Process as a Service Industry Revenue (Million), by Country 2024 & 2032
- Figure 51: Middle East Business Process as a Service Industry Revenue Share (%), by Country 2024 & 2032
List of Tables
- Table 1: Global Business Process as a Service Industry Revenue Million Forecast, by Region 2019 & 2032
- Table 2: Global Business Process as a Service Industry Revenue Million Forecast, by Size of Organization 2019 & 2032
- Table 3: Global Business Process as a Service Industry Revenue Million Forecast, by Process 2019 & 2032
- Table 4: Global Business Process as a Service Industry Revenue Million Forecast, by End-user Industry 2019 & 2032
- Table 5: Global Business Process as a Service Industry Revenue Million Forecast, by Region 2019 & 2032
- Table 6: Global Business Process as a Service Industry Revenue Million Forecast, by Country 2019 & 2032
- Table 7: United States Business Process as a Service Industry Revenue (Million) Forecast, by Application 2019 & 2032
- Table 8: Canada Business Process as a Service Industry Revenue (Million) Forecast, by Application 2019 & 2032
- Table 9: Global Business Process as a Service Industry Revenue Million Forecast, by Country 2019 & 2032
- Table 10: United Kingdom Business Process as a Service Industry Revenue (Million) Forecast, by Application 2019 & 2032
- Table 11: Germany Business Process as a Service Industry Revenue (Million) Forecast, by Application 2019 & 2032
- Table 12: France Business Process as a Service Industry Revenue (Million) Forecast, by Application 2019 & 2032
- Table 13: Rest of Europe Business Process as a Service Industry Revenue (Million) Forecast, by Application 2019 & 2032
- Table 14: Global Business Process as a Service Industry Revenue Million Forecast, by Country 2019 & 2032
- Table 15: China Business Process as a Service Industry Revenue (Million) Forecast, by Application 2019 & 2032
- Table 16: India Business Process as a Service Industry Revenue (Million) Forecast, by Application 2019 & 2032
- Table 17: Japan Business Process as a Service Industry Revenue (Million) Forecast, by Application 2019 & 2032
- Table 18: Rest of Asia Pacific Business Process as a Service Industry Revenue (Million) Forecast, by Application 2019 & 2032
- Table 19: Global Business Process as a Service Industry Revenue Million Forecast, by Country 2019 & 2032
- Table 20: Business Process as a Service Industry Revenue (Million) Forecast, by Application 2019 & 2032
- Table 21: Global Business Process as a Service Industry Revenue Million Forecast, by Country 2019 & 2032
- Table 22: Business Process as a Service Industry Revenue (Million) Forecast, by Application 2019 & 2032
- Table 23: Global Business Process as a Service Industry Revenue Million Forecast, by Size of Organization 2019 & 2032
- Table 24: Global Business Process as a Service Industry Revenue Million Forecast, by Process 2019 & 2032
- Table 25: Global Business Process as a Service Industry Revenue Million Forecast, by End-user Industry 2019 & 2032
- Table 26: Global Business Process as a Service Industry Revenue Million Forecast, by Country 2019 & 2032
- Table 27: United States Business Process as a Service Industry Revenue (Million) Forecast, by Application 2019 & 2032
- Table 28: Canada Business Process as a Service Industry Revenue (Million) Forecast, by Application 2019 & 2032
- Table 29: Global Business Process as a Service Industry Revenue Million Forecast, by Size of Organization 2019 & 2032
- Table 30: Global Business Process as a Service Industry Revenue Million Forecast, by Process 2019 & 2032
- Table 31: Global Business Process as a Service Industry Revenue Million Forecast, by End-user Industry 2019 & 2032
- Table 32: Global Business Process as a Service Industry Revenue Million Forecast, by Country 2019 & 2032
- Table 33: United Kingdom Business Process as a Service Industry Revenue (Million) Forecast, by Application 2019 & 2032
- Table 34: Germany Business Process as a Service Industry Revenue (Million) Forecast, by Application 2019 & 2032
- Table 35: France Business Process as a Service Industry Revenue (Million) Forecast, by Application 2019 & 2032
- Table 36: Rest of Europe Business Process as a Service Industry Revenue (Million) Forecast, by Application 2019 & 2032
- Table 37: Global Business Process as a Service Industry Revenue Million Forecast, by Size of Organization 2019 & 2032
- Table 38: Global Business Process as a Service Industry Revenue Million Forecast, by Process 2019 & 2032
- Table 39: Global Business Process as a Service Industry Revenue Million Forecast, by End-user Industry 2019 & 2032
- Table 40: Global Business Process as a Service Industry Revenue Million Forecast, by Country 2019 & 2032
- Table 41: China Business Process as a Service Industry Revenue (Million) Forecast, by Application 2019 & 2032
- Table 42: India Business Process as a Service Industry Revenue (Million) Forecast, by Application 2019 & 2032
- Table 43: Japan Business Process as a Service Industry Revenue (Million) Forecast, by Application 2019 & 2032
- Table 44: Rest of Asia Pacific Business Process as a Service Industry Revenue (Million) Forecast, by Application 2019 & 2032
- Table 45: Global Business Process as a Service Industry Revenue Million Forecast, by Size of Organization 2019 & 2032
- Table 46: Global Business Process as a Service Industry Revenue Million Forecast, by Process 2019 & 2032
- Table 47: Global Business Process as a Service Industry Revenue Million Forecast, by End-user Industry 2019 & 2032
- Table 48: Global Business Process as a Service Industry Revenue Million Forecast, by Country 2019 & 2032
- Table 49: Global Business Process as a Service Industry Revenue Million Forecast, by Size of Organization 2019 & 2032
- Table 50: Global Business Process as a Service Industry Revenue Million Forecast, by Process 2019 & 2032
- Table 51: Global Business Process as a Service Industry Revenue Million Forecast, by End-user Industry 2019 & 2032
- Table 52: Global Business Process as a Service Industry Revenue Million Forecast, by Country 2019 & 2032
Frequently Asked Questions
1. What is the projected Compound Annual Growth Rate (CAGR) of the Business Process as a Service Industry?
The projected CAGR is approximately 10.89%.
2. Which companies are prominent players in the Business Process as a Service Industry?
Key companies in the market include Wipro Limited, Accenture PLC, IBM Corporation, Fujitsu Ltd, HCL Technologies Ltd, Tata Consultancy Services Limited, Oracle Corporation, Capgemini SE*List Not Exhaustive, Cognizant Technology Solutions, Genpact Limited.
3. What are the main segments of the Business Process as a Service Industry?
The market segments include Size of Organization, Process, End-user Industry.
4. Can you provide details about the market size?
The market size is estimated to be USD XX Million as of 2022.
5. What are some drivers contributing to market growth?
Growing Demand for Cloud Services and Standard Operating Processes; Rising Need for the Reduction of Operational Costs and Improvement of Productivity.
6. What are the notable trends driving market growth?
Reduction of Operational Costs and Productivity Improvement to Drive the Market.
7. Are there any restraints impacting market growth?
Managing Regulatory and Compliance Needs Across the World.
8. Can you provide examples of recent developments in the market?
November 2022: In collaboration with IBM, Infosys Business Process Management (BPM) launches a cutting-edge AI and automation center in Poland. The partnership between Infosys BPM and IBM aims to deliver client success, identify new use cases, and build solutions to enable clients to innovate in hybrid cloud environments. Customers will have access to a range of digital solution offerings across the space of data, AI, and hyper-automation, including IBM CloudPak for data, IBM Watson Assistant and IBM Watson Discovery, IBM SaferPayments, IBM Blockchain, IBM Sterling Supply Chain, IBM Risk and Fraud Detection software, and Envizi for sustainability. They will also access critical solutions from Infosys BPM, such as Infosys Intelligent Document Processing, Infosys Interaction Analytics, and Infosys.
9. What pricing options are available for accessing the report?
Pricing options include single-user, multi-user, and enterprise licenses priced at USD 4750, USD 5250, and USD 8750 respectively.
10. Is the market size provided in terms of value or volume?
The market size is provided in terms of value, measured in Million.
11. Are there any specific market keywords associated with the report?
Yes, the market keyword associated with the report is "Business Process as a Service Industry," which aids in identifying and referencing the specific market segment covered.
12. How do I determine which pricing option suits my needs best?
The pricing options vary based on user requirements and access needs. Individual users may opt for single-user licenses, while businesses requiring broader access may choose multi-user or enterprise licenses for cost-effective access to the report.
13. Are there any additional resources or data provided in the Business Process as a Service Industry report?
While the report offers comprehensive insights, it's advisable to review the specific contents or supplementary materials provided to ascertain if additional resources or data are available.
14. How can I stay updated on further developments or reports in the Business Process as a Service Industry?
To stay informed about further developments, trends, and reports in the Business Process as a Service Industry, consider subscribing to industry newsletters, following relevant companies and organizations, or regularly checking reputable industry news sources and publications.
Methodology
Step 1 - Identification of Relevant Samples Size from Population Database


Step 2 - Approaches for Defining Global Market Size (Value, Volume* & Price*)

Note*: In applicable scenarios
Step 3 - Data Sources
Primary Research
- Web Analytics
- Survey Reports
- Research Institute
- Latest Research Reports
- Opinion Leaders
Secondary Research
- Annual Reports
- White Paper
- Latest Press Release
- Industry Association
- Paid Database
- Investor Presentations

Step 4 - Data Triangulation
Involves using different sources of information in order to increase the validity of a study
These sources are likely to be stakeholders in a program - participants, other researchers, program staff, other community members, and so on.
Then we put all data in single framework & apply various statistical tools to find out the dynamic on the market.
During the analysis stage, feedback from the stakeholder groups would be compared to determine areas of agreement as well as areas of divergence
