

Key Insights
The biologics fill and finish services market is experiencing robust growth, driven by the increasing demand for biologics, particularly monoclonal antibodies and other complex therapeutic proteins. The market's expansion is fueled by advancements in biotechnology, leading to a surge in innovative therapies for various chronic diseases like cancer, autoimmune disorders, and infectious diseases. Furthermore, the rising prevalence of these diseases globally contributes significantly to the market's upward trajectory. Stringent regulatory requirements and the need for specialized infrastructure are key factors shaping the competitive landscape. Large Contract Development and Manufacturing Organizations (CDMOs) such as Lonza, Catalent, and Boehringer Ingelheim hold significant market share, leveraging their expertise in aseptic processing and advanced fill-finish technologies. Smaller, specialized CDMOs are also gaining traction, focusing on niche therapeutic areas or specific technologies like aseptic liquid filling and lyophilization. The market is segmented by service type (e.g., aseptic filling, lyophilization, labeling, packaging), therapeutic area, and geography. North America and Europe currently dominate the market due to high research and development investment and established regulatory frameworks. However, emerging markets in Asia-Pacific are demonstrating rapid growth potential, attracted by increasing healthcare expenditure and favorable government initiatives.
The forecast period (2025-2033) anticipates continued expansion, primarily fueled by the pipeline of biosimilars and novel biologics entering the market. Technological advancements, such as single-use technologies and automation, will improve efficiency and reduce costs, further driving market growth. However, challenges such as high development and manufacturing costs, stringent regulatory compliance, and potential supply chain disruptions could moderate growth. The market will likely witness increasing consolidation through mergers and acquisitions, with larger players aiming to expand their service offerings and geographical reach. The focus will remain on providing high-quality, efficient, and compliant fill and finish services to meet the growing demands of the biopharmaceutical industry. Companies are likely to invest in advanced analytics and digital technologies to optimize their processes and enhance their offerings.
Biologics Fill and Finish Services Market Report: 2019-2033
This comprehensive report provides an in-depth analysis of the global Biologics Fill and Finish Services market, offering invaluable insights for stakeholders across the pharmaceutical and biotechnology industries. With a study period spanning 2019-2033, a base year of 2025, and a forecast period of 2025-2033, this report leverages extensive market research to present a clear picture of current trends and future projections, encompassing market sizing exceeding $XX million.
Biologics Fill and Finish Services Market Composition & Trends
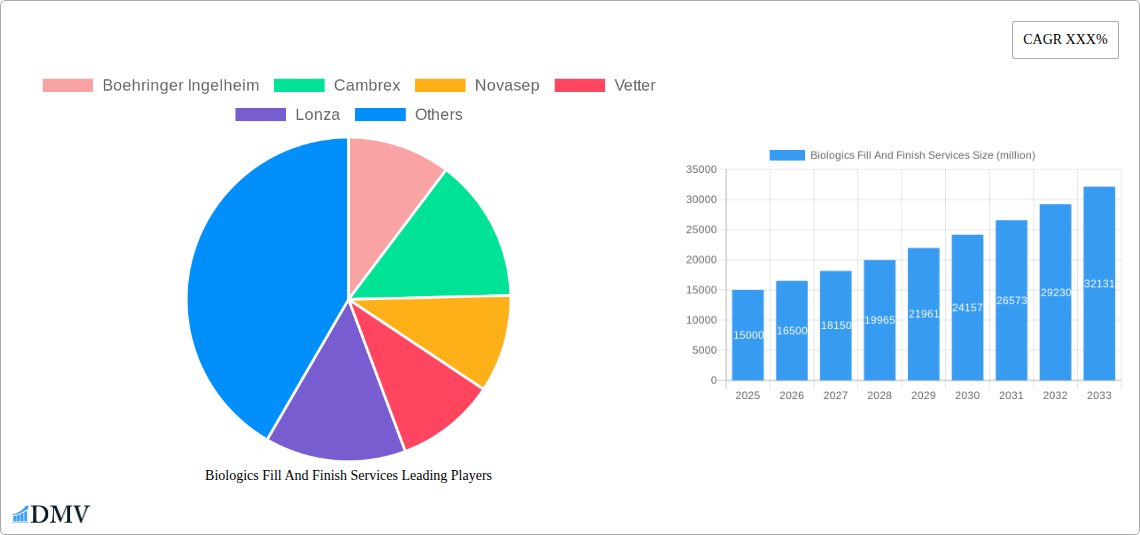
This section evaluates the competitive landscape, innovation drivers, and regulatory factors shaping the Biologics Fill and Finish Services market. The market exhibits a moderately concentrated structure, with key players holding significant market share. The estimated market share distribution in 2025 is as follows: Lonza (15%), Catalent (12%), Boehringer Ingelheim (10%), with the remaining share distributed among other players like Vetter, Novasep, and others.
- Market Concentration: Moderately concentrated, with a few major players dominating.
- Innovation Catalysts: Advancements in aseptic processing technologies, single-use systems, and continuous manufacturing are driving innovation.
- Regulatory Landscape: Stringent regulatory requirements (e.g., GMP compliance) influence market dynamics, favoring companies with robust quality control systems.
- Substitute Products: Limited substitutes exist, reinforcing the market's growth trajectory.
- End-User Profiles: Pharmaceutical and biotechnology companies, contract research organizations (CROs), and contract manufacturing organizations (CMOs) are primary end-users.
- M&A Activities: Significant M&A activity has been observed in the last five years, with total deal values exceeding $XX million, driven by strategic expansions and technological acquisitions. Examples include the acquisition of [Insert Example Acquisition if available, otherwise state "XX"] for $XX million in [Year].
Biologics Fill and Finish Services Industry Evolution
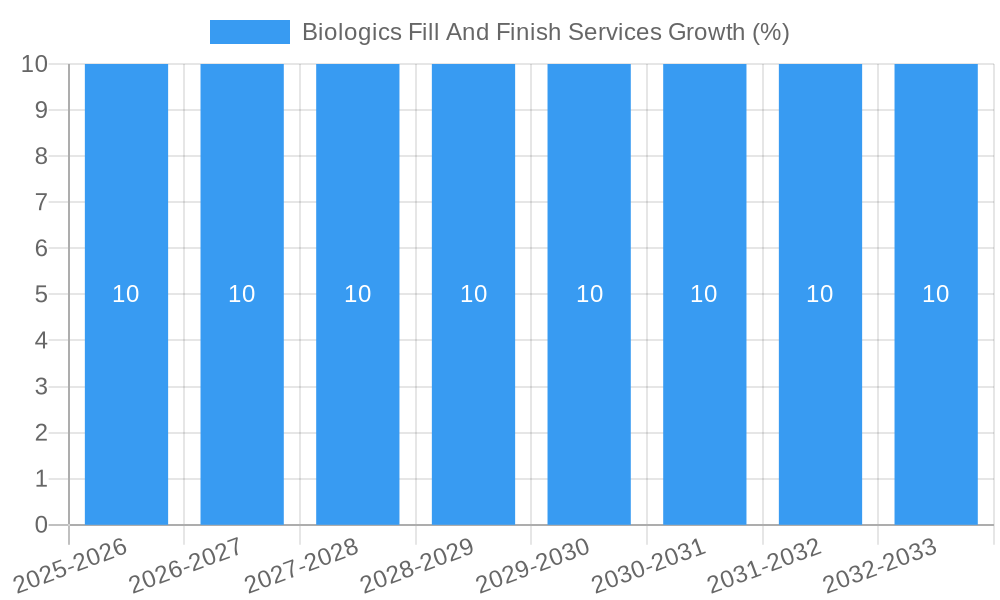
The Biologics Fill and Finish Services market has experienced substantial growth over the historical period (2019-2024), with a Compound Annual Growth Rate (CAGR) of XX%. This growth is fueled by several factors, including the rising demand for biologics (driven by an aging population and increasing prevalence of chronic diseases), technological advancements improving efficiency and reducing costs, and the increasing outsourcing of fill-finish operations by pharmaceutical companies. The market is expected to maintain a robust growth trajectory during the forecast period (2025-2033), with a projected CAGR of XX%, exceeding $XX million by 2033. This growth will be propelled by the continued rise in biologics approvals, expansion into emerging markets, and ongoing technological innovations in fill-finish processes, particularly around automation and advanced analytical techniques. Adoption of single-use technologies is expected to increase by XX% during the forecast period, while the adoption of continuous manufacturing will reach approximately XX%.
Leading Regions, Countries, or Segments in Biologics Fill and Finish Services
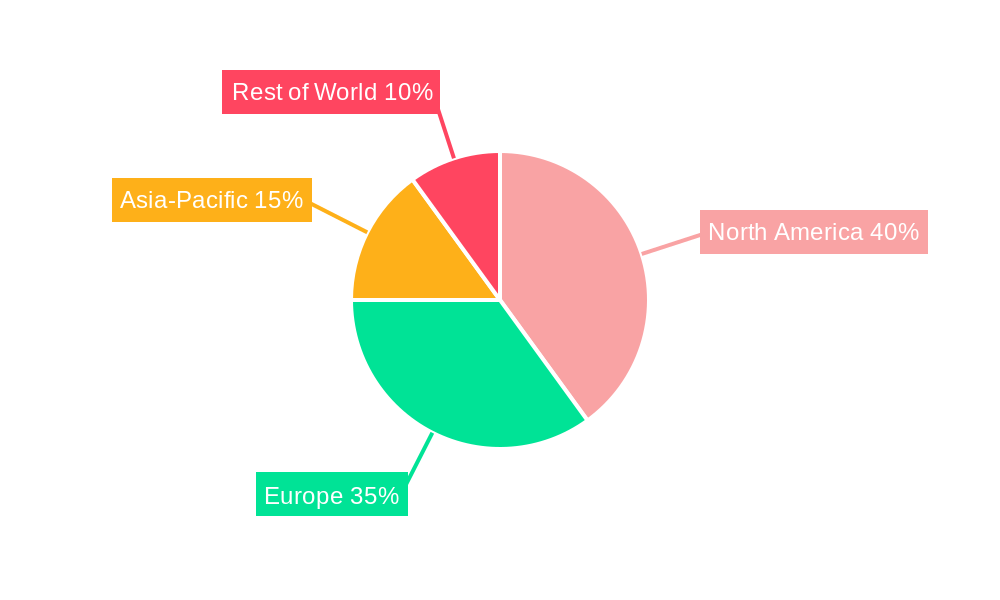
North America currently holds the largest market share, driven by a robust biopharmaceutical industry, significant R&D investments, and strong regulatory frameworks.
Key Drivers in North America:
- High concentration of biopharmaceutical companies.
- Extensive R&D investment in biologics.
- Stringent but supportive regulatory environment.
- Well-established infrastructure for bioprocessing.
Dominance Factors: The region’s dominance stems from a combination of factors, including high concentration of biologics manufacturers, substantial investments in R&D, favorable regulatory frameworks that encourage innovation, and a sophisticated supply chain infrastructure. Europe and Asia are also experiencing significant growth, fueled by rising demand for biologics and increasing outsourcing of fill-finish activities. However, North America’s established ecosystem and regulatory maturity are likely to maintain its leading position throughout the forecast period.
Biologics Fill and Finish Services Product Innovations
Recent innovations focus on enhancing speed, efficiency, and sterility assurance in fill-finish processes. These include advanced aseptic filling technologies, such as robotic systems and single-use technologies that minimize contamination risk. Furthermore, improvements in analytical techniques allow for real-time process monitoring and quality control, thereby ensuring high product consistency and minimizing waste. The adoption of these innovations results in increased productivity, reduced operational costs, and improved product quality.
Propelling Factors for Biologics Fill and Finish Services Growth
Several factors drive the growth of the Biologics Fill and Finish Services market. The increasing prevalence of chronic diseases, such as cancer and autoimmune disorders, is boosting the demand for biologics. Simultaneously, technological advancements in fill-finish processes, such as automation and single-use systems, are increasing efficiency and reducing costs. Favorable regulatory environments in key markets further stimulate growth by facilitating innovation and market entry. Finally, the trend towards outsourcing of fill-finish operations by pharmaceutical companies creates significant opportunities for contract manufacturers.
Obstacles in the Biologics Fill and Finish Services Market
Despite the positive growth outlook, the Biologics Fill and Finish Services market faces challenges. Stringent regulatory requirements increase compliance costs and complexity for companies. Supply chain disruptions, particularly in the procurement of raw materials and critical components, can impact production and lead times. Intense competition among established and emerging players puts pressure on pricing and margins. These factors, if not effectively managed, could hinder market growth.
Future Opportunities in Biologics Fill and Finish Services
Future opportunities lie in the expansion into emerging markets, particularly in Asia and Latin America, where demand for biologics is rapidly growing. Technological advancements, such as continuous manufacturing and advanced process analytical technologies (PAT), offer opportunities for enhanced efficiency and reduced costs. Moreover, the development of innovative fill-finish solutions for complex biologics, like cell and gene therapies, will create lucrative new market segments.
Major Players in the Biologics Fill and Finish Services Ecosystem
- Boehringer Ingelheim
- Cambrex
- Novasep
- Vetter
- Lonza
- Emergent BioSolutions
- Cobra Biologics
- Catalent
- MabPlex
- Polpharma Biologics
- Baxter Healthcare Corporation
- ABL, Inc.
- Rentschler Fill Solutions
- Symbiosis Pharmaceutical Services
- iBio
Key Developments in Biologics Fill and Finish Services Industry
- [Month, Year]: Lonza announced a significant expansion of its fill-finish capacity in [Location].
- [Month, Year]: Catalent launched a new aseptic filling line for [Specific Biologic Type].
- [Month, Year]: Novasep acquired [Acquired Company] to strengthen its capabilities in [Specific Area].
- [Insert further developments with dates and brief descriptions as available. If data is limited, use "XX" or a predicted event with a plausible date.]
Strategic Biologics Fill and Finish Services Market Forecast
The Biologics Fill and Finish Services market is poised for continued strong growth, driven by factors such as the increasing demand for biologics, technological advancements, and favorable regulatory landscapes. The market is expected to reach $XX million by 2033, presenting significant opportunities for companies with robust technological capabilities and a strong focus on quality and compliance. The market will witness increasing consolidation through M&A activity, with larger players acquiring smaller companies to expand their capabilities and market reach. The focus will remain on continuous innovation, efficiency improvements, and the development of solutions for next-generation biologics.
Biologics Fill And Finish Services Segmentation
-
1. Application
- 1.1. Clinical Manufacturing
- 1.2. Commercial Manufacturing
- 1.3. Others
-
2. Type
- 2.1. Liquid
- 2.2. Lyophilized
Biologics Fill And Finish Services Segmentation By Geography
-
1. North America
- 1.1. United States
- 1.2. Canada
- 1.3. Mexico
-
2. South America
- 2.1. Brazil
- 2.2. Argentina
- 2.3. Rest of South America
-
3. Europe
- 3.1. United Kingdom
- 3.2. Germany
- 3.3. France
- 3.4. Italy
- 3.5. Spain
- 3.6. Russia
- 3.7. Benelux
- 3.8. Nordics
- 3.9. Rest of Europe
-
4. Middle East & Africa
- 4.1. Turkey
- 4.2. Israel
- 4.3. GCC
- 4.4. North Africa
- 4.5. South Africa
- 4.6. Rest of Middle East & Africa
-
5. Asia Pacific
- 5.1. China
- 5.2. India
- 5.3. Japan
- 5.4. South Korea
- 5.5. ASEAN
- 5.6. Oceania
- 5.7. Rest of Asia Pacific
Biologics Fill And Finish Services REPORT HIGHLIGHTS
| Aspects | Details |
|---|---|
| Study Period | 2019-2033 |
| Base Year | 2024 |
| Estimated Year | 2025 |
| Forecast Period | 2025-2033 |
| Historical Period | 2019-2024 |
| Growth Rate | CAGR of XXX% from 2019-2033 |
| Segmentation |
|
Table of Contents
- 1. Introduction
- 1.1. Research Scope
- 1.2. Market Segmentation
- 1.3. Research Methodology
- 1.4. Definitions and Assumptions
- 2. Executive Summary
- 2.1. Introduction
- 3. Market Dynamics
- 3.1. Introduction
- 3.2. Market Drivers
- 3.3. Market Restrains
- 3.4. Market Trends
- 4. Market Factor Analysis
- 4.1. Porters Five Forces
- 4.2. Supply/Value Chain
- 4.3. PESTEL analysis
- 4.4. Market Entropy
- 4.5. Patent/Trademark Analysis
- 5. Global Biologics Fill And Finish Services Analysis, Insights and Forecast, 2019-2031
- 5.1. Market Analysis, Insights and Forecast - by Application
- 5.1.1. Clinical Manufacturing
- 5.1.2. Commercial Manufacturing
- 5.1.3. Others
- 5.2. Market Analysis, Insights and Forecast - by Type
- 5.2.1. Liquid
- 5.2.2. Lyophilized
- 5.3. Market Analysis, Insights and Forecast - by Region
- 5.3.1. North America
- 5.3.2. South America
- 5.3.3. Europe
- 5.3.4. Middle East & Africa
- 5.3.5. Asia Pacific
- 5.1. Market Analysis, Insights and Forecast - by Application
- 6. North America Biologics Fill And Finish Services Analysis, Insights and Forecast, 2019-2031
- 6.1. Market Analysis, Insights and Forecast - by Application
- 6.1.1. Clinical Manufacturing
- 6.1.2. Commercial Manufacturing
- 6.1.3. Others
- 6.2. Market Analysis, Insights and Forecast - by Type
- 6.2.1. Liquid
- 6.2.2. Lyophilized
- 6.1. Market Analysis, Insights and Forecast - by Application
- 7. South America Biologics Fill And Finish Services Analysis, Insights and Forecast, 2019-2031
- 7.1. Market Analysis, Insights and Forecast - by Application
- 7.1.1. Clinical Manufacturing
- 7.1.2. Commercial Manufacturing
- 7.1.3. Others
- 7.2. Market Analysis, Insights and Forecast - by Type
- 7.2.1. Liquid
- 7.2.2. Lyophilized
- 7.1. Market Analysis, Insights and Forecast - by Application
- 8. Europe Biologics Fill And Finish Services Analysis, Insights and Forecast, 2019-2031
- 8.1. Market Analysis, Insights and Forecast - by Application
- 8.1.1. Clinical Manufacturing
- 8.1.2. Commercial Manufacturing
- 8.1.3. Others
- 8.2. Market Analysis, Insights and Forecast - by Type
- 8.2.1. Liquid
- 8.2.2. Lyophilized
- 8.1. Market Analysis, Insights and Forecast - by Application
- 9. Middle East & Africa Biologics Fill And Finish Services Analysis, Insights and Forecast, 2019-2031
- 9.1. Market Analysis, Insights and Forecast - by Application
- 9.1.1. Clinical Manufacturing
- 9.1.2. Commercial Manufacturing
- 9.1.3. Others
- 9.2. Market Analysis, Insights and Forecast - by Type
- 9.2.1. Liquid
- 9.2.2. Lyophilized
- 9.1. Market Analysis, Insights and Forecast - by Application
- 10. Asia Pacific Biologics Fill And Finish Services Analysis, Insights and Forecast, 2019-2031
- 10.1. Market Analysis, Insights and Forecast - by Application
- 10.1.1. Clinical Manufacturing
- 10.1.2. Commercial Manufacturing
- 10.1.3. Others
- 10.2. Market Analysis, Insights and Forecast - by Type
- 10.2.1. Liquid
- 10.2.2. Lyophilized
- 10.1. Market Analysis, Insights and Forecast - by Application
- 11. Competitive Analysis
- 11.1. Global Market Share Analysis 2024
- 11.2. Company Profiles
- 11.2.1 Boehringer Ingelheim
- 11.2.1.1. Overview
- 11.2.1.2. Products
- 11.2.1.3. SWOT Analysis
- 11.2.1.4. Recent Developments
- 11.2.1.5. Financials (Based on Availability)
- 11.2.2 Cambrex
- 11.2.2.1. Overview
- 11.2.2.2. Products
- 11.2.2.3. SWOT Analysis
- 11.2.2.4. Recent Developments
- 11.2.2.5. Financials (Based on Availability)
- 11.2.3 Novasep
- 11.2.3.1. Overview
- 11.2.3.2. Products
- 11.2.3.3. SWOT Analysis
- 11.2.3.4. Recent Developments
- 11.2.3.5. Financials (Based on Availability)
- 11.2.4 Vetter
- 11.2.4.1. Overview
- 11.2.4.2. Products
- 11.2.4.3. SWOT Analysis
- 11.2.4.4. Recent Developments
- 11.2.4.5. Financials (Based on Availability)
- 11.2.5 Lonza
- 11.2.5.1. Overview
- 11.2.5.2. Products
- 11.2.5.3. SWOT Analysis
- 11.2.5.4. Recent Developments
- 11.2.5.5. Financials (Based on Availability)
- 11.2.6 Emergent BioSolutions
- 11.2.6.1. Overview
- 11.2.6.2. Products
- 11.2.6.3. SWOT Analysis
- 11.2.6.4. Recent Developments
- 11.2.6.5. Financials (Based on Availability)
- 11.2.7 Cobra Biologics
- 11.2.7.1. Overview
- 11.2.7.2. Products
- 11.2.7.3. SWOT Analysis
- 11.2.7.4. Recent Developments
- 11.2.7.5. Financials (Based on Availability)
- 11.2.8 Catalent
- 11.2.8.1. Overview
- 11.2.8.2. Products
- 11.2.8.3. SWOT Analysis
- 11.2.8.4. Recent Developments
- 11.2.8.5. Financials (Based on Availability)
- 11.2.9 MabPlex
- 11.2.9.1. Overview
- 11.2.9.2. Products
- 11.2.9.3. SWOT Analysis
- 11.2.9.4. Recent Developments
- 11.2.9.5. Financials (Based on Availability)
- 11.2.10 Polpharma Biologics
- 11.2.10.1. Overview
- 11.2.10.2. Products
- 11.2.10.3. SWOT Analysis
- 11.2.10.4. Recent Developments
- 11.2.10.5. Financials (Based on Availability)
- 11.2.11 Baxter Healthcare Corporation
- 11.2.11.1. Overview
- 11.2.11.2. Products
- 11.2.11.3. SWOT Analysis
- 11.2.11.4. Recent Developments
- 11.2.11.5. Financials (Based on Availability)
- 11.2.12 ABL Inc.
- 11.2.12.1. Overview
- 11.2.12.2. Products
- 11.2.12.3. SWOT Analysis
- 11.2.12.4. Recent Developments
- 11.2.12.5. Financials (Based on Availability)
- 11.2.13 Rentschler Fill Solutions
- 11.2.13.1. Overview
- 11.2.13.2. Products
- 11.2.13.3. SWOT Analysis
- 11.2.13.4. Recent Developments
- 11.2.13.5. Financials (Based on Availability)
- 11.2.14 Symbiosis Pharmaceutical Services
- 11.2.14.1. Overview
- 11.2.14.2. Products
- 11.2.14.3. SWOT Analysis
- 11.2.14.4. Recent Developments
- 11.2.14.5. Financials (Based on Availability)
- 11.2.15 iBio
- 11.2.15.1. Overview
- 11.2.15.2. Products
- 11.2.15.3. SWOT Analysis
- 11.2.15.4. Recent Developments
- 11.2.15.5. Financials (Based on Availability)
- 11.2.1 Boehringer Ingelheim
List of Figures
- Figure 1: Global Biologics Fill And Finish Services Revenue Breakdown (million, %) by Region 2024 & 2032
- Figure 2: North America Biologics Fill And Finish Services Revenue (million), by Application 2024 & 2032
- Figure 3: North America Biologics Fill And Finish Services Revenue Share (%), by Application 2024 & 2032
- Figure 4: North America Biologics Fill And Finish Services Revenue (million), by Type 2024 & 2032
- Figure 5: North America Biologics Fill And Finish Services Revenue Share (%), by Type 2024 & 2032
- Figure 6: North America Biologics Fill And Finish Services Revenue (million), by Country 2024 & 2032
- Figure 7: North America Biologics Fill And Finish Services Revenue Share (%), by Country 2024 & 2032
- Figure 8: South America Biologics Fill And Finish Services Revenue (million), by Application 2024 & 2032
- Figure 9: South America Biologics Fill And Finish Services Revenue Share (%), by Application 2024 & 2032
- Figure 10: South America Biologics Fill And Finish Services Revenue (million), by Type 2024 & 2032
- Figure 11: South America Biologics Fill And Finish Services Revenue Share (%), by Type 2024 & 2032
- Figure 12: South America Biologics Fill And Finish Services Revenue (million), by Country 2024 & 2032
- Figure 13: South America Biologics Fill And Finish Services Revenue Share (%), by Country 2024 & 2032
- Figure 14: Europe Biologics Fill And Finish Services Revenue (million), by Application 2024 & 2032
- Figure 15: Europe Biologics Fill And Finish Services Revenue Share (%), by Application 2024 & 2032
- Figure 16: Europe Biologics Fill And Finish Services Revenue (million), by Type 2024 & 2032
- Figure 17: Europe Biologics Fill And Finish Services Revenue Share (%), by Type 2024 & 2032
- Figure 18: Europe Biologics Fill And Finish Services Revenue (million), by Country 2024 & 2032
- Figure 19: Europe Biologics Fill And Finish Services Revenue Share (%), by Country 2024 & 2032
- Figure 20: Middle East & Africa Biologics Fill And Finish Services Revenue (million), by Application 2024 & 2032
- Figure 21: Middle East & Africa Biologics Fill And Finish Services Revenue Share (%), by Application 2024 & 2032
- Figure 22: Middle East & Africa Biologics Fill And Finish Services Revenue (million), by Type 2024 & 2032
- Figure 23: Middle East & Africa Biologics Fill And Finish Services Revenue Share (%), by Type 2024 & 2032
- Figure 24: Middle East & Africa Biologics Fill And Finish Services Revenue (million), by Country 2024 & 2032
- Figure 25: Middle East & Africa Biologics Fill And Finish Services Revenue Share (%), by Country 2024 & 2032
- Figure 26: Asia Pacific Biologics Fill And Finish Services Revenue (million), by Application 2024 & 2032
- Figure 27: Asia Pacific Biologics Fill And Finish Services Revenue Share (%), by Application 2024 & 2032
- Figure 28: Asia Pacific Biologics Fill And Finish Services Revenue (million), by Type 2024 & 2032
- Figure 29: Asia Pacific Biologics Fill And Finish Services Revenue Share (%), by Type 2024 & 2032
- Figure 30: Asia Pacific Biologics Fill And Finish Services Revenue (million), by Country 2024 & 2032
- Figure 31: Asia Pacific Biologics Fill And Finish Services Revenue Share (%), by Country 2024 & 2032
List of Tables
- Table 1: Global Biologics Fill And Finish Services Revenue million Forecast, by Region 2019 & 2032
- Table 2: Global Biologics Fill And Finish Services Revenue million Forecast, by Application 2019 & 2032
- Table 3: Global Biologics Fill And Finish Services Revenue million Forecast, by Type 2019 & 2032
- Table 4: Global Biologics Fill And Finish Services Revenue million Forecast, by Region 2019 & 2032
- Table 5: Global Biologics Fill And Finish Services Revenue million Forecast, by Application 2019 & 2032
- Table 6: Global Biologics Fill And Finish Services Revenue million Forecast, by Type 2019 & 2032
- Table 7: Global Biologics Fill And Finish Services Revenue million Forecast, by Country 2019 & 2032
- Table 8: United States Biologics Fill And Finish Services Revenue (million) Forecast, by Application 2019 & 2032
- Table 9: Canada Biologics Fill And Finish Services Revenue (million) Forecast, by Application 2019 & 2032
- Table 10: Mexico Biologics Fill And Finish Services Revenue (million) Forecast, by Application 2019 & 2032
- Table 11: Global Biologics Fill And Finish Services Revenue million Forecast, by Application 2019 & 2032
- Table 12: Global Biologics Fill And Finish Services Revenue million Forecast, by Type 2019 & 2032
- Table 13: Global Biologics Fill And Finish Services Revenue million Forecast, by Country 2019 & 2032
- Table 14: Brazil Biologics Fill And Finish Services Revenue (million) Forecast, by Application 2019 & 2032
- Table 15: Argentina Biologics Fill And Finish Services Revenue (million) Forecast, by Application 2019 & 2032
- Table 16: Rest of South America Biologics Fill And Finish Services Revenue (million) Forecast, by Application 2019 & 2032
- Table 17: Global Biologics Fill And Finish Services Revenue million Forecast, by Application 2019 & 2032
- Table 18: Global Biologics Fill And Finish Services Revenue million Forecast, by Type 2019 & 2032
- Table 19: Global Biologics Fill And Finish Services Revenue million Forecast, by Country 2019 & 2032
- Table 20: United Kingdom Biologics Fill And Finish Services Revenue (million) Forecast, by Application 2019 & 2032
- Table 21: Germany Biologics Fill And Finish Services Revenue (million) Forecast, by Application 2019 & 2032
- Table 22: France Biologics Fill And Finish Services Revenue (million) Forecast, by Application 2019 & 2032
- Table 23: Italy Biologics Fill And Finish Services Revenue (million) Forecast, by Application 2019 & 2032
- Table 24: Spain Biologics Fill And Finish Services Revenue (million) Forecast, by Application 2019 & 2032
- Table 25: Russia Biologics Fill And Finish Services Revenue (million) Forecast, by Application 2019 & 2032
- Table 26: Benelux Biologics Fill And Finish Services Revenue (million) Forecast, by Application 2019 & 2032
- Table 27: Nordics Biologics Fill And Finish Services Revenue (million) Forecast, by Application 2019 & 2032
- Table 28: Rest of Europe Biologics Fill And Finish Services Revenue (million) Forecast, by Application 2019 & 2032
- Table 29: Global Biologics Fill And Finish Services Revenue million Forecast, by Application 2019 & 2032
- Table 30: Global Biologics Fill And Finish Services Revenue million Forecast, by Type 2019 & 2032
- Table 31: Global Biologics Fill And Finish Services Revenue million Forecast, by Country 2019 & 2032
- Table 32: Turkey Biologics Fill And Finish Services Revenue (million) Forecast, by Application 2019 & 2032
- Table 33: Israel Biologics Fill And Finish Services Revenue (million) Forecast, by Application 2019 & 2032
- Table 34: GCC Biologics Fill And Finish Services Revenue (million) Forecast, by Application 2019 & 2032
- Table 35: North Africa Biologics Fill And Finish Services Revenue (million) Forecast, by Application 2019 & 2032
- Table 36: South Africa Biologics Fill And Finish Services Revenue (million) Forecast, by Application 2019 & 2032
- Table 37: Rest of Middle East & Africa Biologics Fill And Finish Services Revenue (million) Forecast, by Application 2019 & 2032
- Table 38: Global Biologics Fill And Finish Services Revenue million Forecast, by Application 2019 & 2032
- Table 39: Global Biologics Fill And Finish Services Revenue million Forecast, by Type 2019 & 2032
- Table 40: Global Biologics Fill And Finish Services Revenue million Forecast, by Country 2019 & 2032
- Table 41: China Biologics Fill And Finish Services Revenue (million) Forecast, by Application 2019 & 2032
- Table 42: India Biologics Fill And Finish Services Revenue (million) Forecast, by Application 2019 & 2032
- Table 43: Japan Biologics Fill And Finish Services Revenue (million) Forecast, by Application 2019 & 2032
- Table 44: South Korea Biologics Fill And Finish Services Revenue (million) Forecast, by Application 2019 & 2032
- Table 45: ASEAN Biologics Fill And Finish Services Revenue (million) Forecast, by Application 2019 & 2032
- Table 46: Oceania Biologics Fill And Finish Services Revenue (million) Forecast, by Application 2019 & 2032
- Table 47: Rest of Asia Pacific Biologics Fill And Finish Services Revenue (million) Forecast, by Application 2019 & 2032
Frequently Asked Questions
1. What is the projected Compound Annual Growth Rate (CAGR) of the Biologics Fill And Finish Services?
The projected CAGR is approximately XXX%.
2. Which companies are prominent players in the Biologics Fill And Finish Services?
Key companies in the market include Boehringer Ingelheim, Cambrex, Novasep, Vetter, Lonza, Emergent BioSolutions, Cobra Biologics, Catalent, MabPlex, Polpharma Biologics, Baxter Healthcare Corporation, ABL, Inc., Rentschler Fill Solutions, Symbiosis Pharmaceutical Services, iBio.
3. What are the main segments of the Biologics Fill And Finish Services?
The market segments include Application, Type.
4. Can you provide details about the market size?
The market size is estimated to be USD XXX million as of 2022.
5. What are some drivers contributing to market growth?
N/A
6. What are the notable trends driving market growth?
N/A
7. Are there any restraints impacting market growth?
N/A
8. Can you provide examples of recent developments in the market?
N/A
9. What pricing options are available for accessing the report?
Pricing options include single-user, multi-user, and enterprise licenses priced at USD 2900.00, USD 4350.00, and USD 5800.00 respectively.
10. Is the market size provided in terms of value or volume?
The market size is provided in terms of value, measured in million.
11. Are there any specific market keywords associated with the report?
Yes, the market keyword associated with the report is "Biologics Fill And Finish Services," which aids in identifying and referencing the specific market segment covered.
12. How do I determine which pricing option suits my needs best?
The pricing options vary based on user requirements and access needs. Individual users may opt for single-user licenses, while businesses requiring broader access may choose multi-user or enterprise licenses for cost-effective access to the report.
13. Are there any additional resources or data provided in the Biologics Fill And Finish Services report?
While the report offers comprehensive insights, it's advisable to review the specific contents or supplementary materials provided to ascertain if additional resources or data are available.
14. How can I stay updated on further developments or reports in the Biologics Fill And Finish Services?
To stay informed about further developments, trends, and reports in the Biologics Fill And Finish Services, consider subscribing to industry newsletters, following relevant companies and organizations, or regularly checking reputable industry news sources and publications.
Methodology
Step 1 - Identification of Relevant Samples Size from Population Database


Step 2 - Approaches for Defining Global Market Size (Value, Volume* & Price*)

Note*: In applicable scenarios
Step 3 - Data Sources
Primary Research
- Web Analytics
- Survey Reports
- Research Institute
- Latest Research Reports
- Opinion Leaders
Secondary Research
- Annual Reports
- White Paper
- Latest Press Release
- Industry Association
- Paid Database
- Investor Presentations

Step 4 - Data Triangulation
Involves using different sources of information in order to increase the validity of a study
These sources are likely to be stakeholders in a program - participants, other researchers, program staff, other community members, and so on.
Then we put all data in single framework & apply various statistical tools to find out the dynamic on the market.
During the analysis stage, feedback from the stakeholder groups would be compared to determine areas of agreement as well as areas of divergence
