

Key Insights
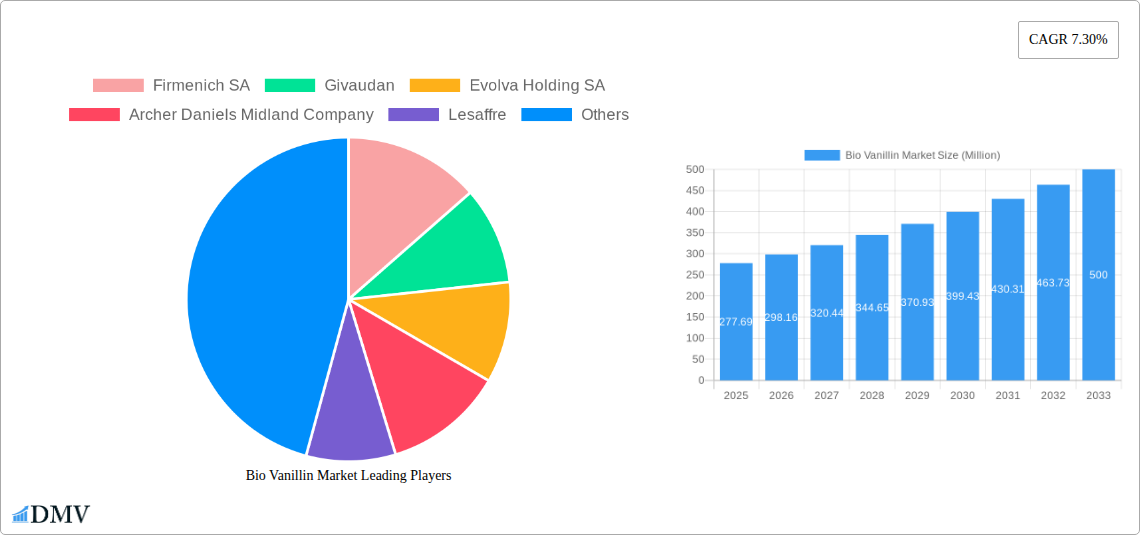
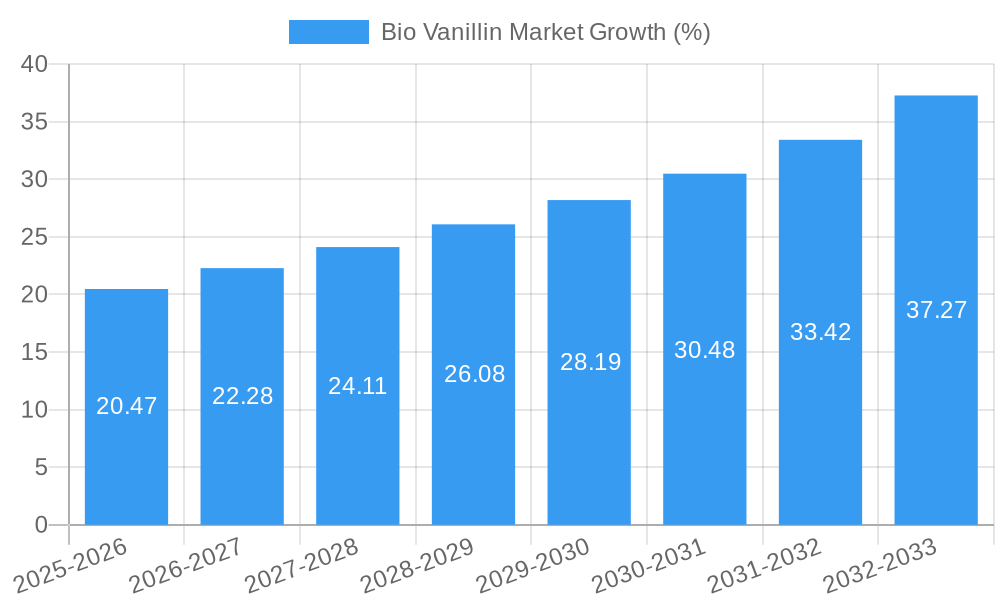
The global bio vanillin market, valued at $277.69 million in 2025, is projected to experience robust growth, driven by increasing consumer demand for natural and clean-label food and beverage products. The market's Compound Annual Growth Rate (CAGR) of 7.30% from 2025 to 2033 signifies a considerable expansion, primarily fueled by the growing preference for naturally derived flavoring agents in various applications, including food and beverages, pharmaceuticals, and fragrances. The rising awareness of the health implications of synthetic vanillin is further bolstering the adoption of bio-based alternatives. Key market segments, such as food and beverages, are anticipated to witness significant growth due to the increasing use of bio vanillin in confectionery, bakery items, and beverages. The pharmaceutical and fragrance sectors are also contributing to market expansion, driven by the demand for natural ingredients in cosmetics and medicinal applications. Leading players like Firmenich SA and Givaudan are actively investing in research and development, driving innovation and expanding product portfolios within this burgeoning market. Geographical expansion, particularly in Asia-Pacific regions experiencing rapid economic growth and increasing consumer spending on premium food and beverages, will further contribute to market expansion. Challenges such as the relatively higher cost of production compared to synthetic vanillin and the need for efficient and sustainable production methods remain, but ongoing technological advancements are gradually mitigating these factors.
The competitive landscape is characterized by a mix of large multinational corporations and smaller specialized companies. Strategic partnerships and mergers and acquisitions are expected to shape the industry, resulting in consolidation and increased market share for key players. Future market growth will be influenced by factors such as technological advancements in bio-based production methods, evolving consumer preferences, stringent regulatory frameworks regarding food additives, and increasing sustainability concerns within various industries. The market is expected to see further diversification across applications, with potential growth in niche sectors. Overall, the bio vanillin market presents a promising investment opportunity with substantial growth potential over the forecast period, driven by a confluence of consumer demand, technological progress, and increasing industry focus on sustainable solutions.
Bio Vanillin Market: A Comprehensive Report (2019-2033)
This insightful report provides a comprehensive analysis of the Bio Vanillin Market, offering a detailed understanding of its current state, future trajectory, and key players. With a study period spanning 2019-2033, a base year of 2025, and a forecast period of 2025-2033, this report is an invaluable resource for stakeholders seeking to navigate this dynamic market. The global Bio Vanillin Market size was valued at xx Million in 2024 and is projected to reach xx Million by 2033, exhibiting a CAGR of xx% during the forecast period.
Bio Vanillin Market Composition & Trends
This section delves into the intricate landscape of the Bio Vanillin Market, examining its concentration, innovation drivers, regulatory environment, substitute products, end-user profiles, and mergers & acquisitions (M&A) activities. The market exhibits a moderately concentrated structure, with key players like Firmenich SA, Givaudan, and Evolva Holding SA holding significant market share. The exact distribution is analyzed in detail within the full report, revealing insights into competitive dynamics and market power. Innovation is driven by the increasing demand for natural and sustainable ingredients, pushing companies to invest in research and development of novel bio-based production methods. Stringent regulatory frameworks surrounding food additives and flavorings influence market dynamics, especially in regions with stricter regulations. Competition from synthetic vanillin, a cheaper alternative, presents a key challenge. End-user profiles reveal a diverse customer base spanning the food & beverage, pharmaceutical, and fragrance industries. M&A activity in the Bio Vanillin Market has been moderate over the past few years, with deal values ranging from xx Million to xx Million. The report further explores these aspects, providing a nuanced understanding of the market's composition and trends.
- Market Share Distribution: Detailed breakdown by key players (Firmenich SA, Givaudan, Evolva Holding SA, etc.)
- M&A Deal Values: Analysis of completed deals, highlighting key transactions and their impact on the market landscape.
- Regulatory Landscape: Assessment of key regulations and their impact on market growth across different regions.
- Substitute Product Analysis: Comparison of bio-vanillin with synthetic vanillin, highlighting their advantages and disadvantages.
Bio Vanillin Market Industry Evolution
The Bio Vanillin Market has witnessed significant evolution driven by technological advancements, evolving consumer preferences, and sustained market growth. The historical period (2019-2024) saw a steady rise in demand, fueled by the growing preference for natural and clean-label products in the food and beverage sector. Technological advancements in fermentation and bio-engineering have significantly reduced production costs and improved the quality of bio-vanillin, making it a more competitive alternative to synthetic vanillin. Shifting consumer demands toward natural and sustainable products have fueled the market's growth trajectory. The adoption rate of bio-vanillin is increasing steadily, with projections indicating continued growth in the forecast period (2025-2033). The report includes specific data points on historical and projected growth rates, adoption metrics, and technological trends shaping the industry's evolution. Detailed market size forecasts (in Million) are presented for each year within the forecast period.
Leading Regions, Countries, or Segments in Bio Vanillin Market
The Food & Beverage segment currently dominates the Bio Vanillin Market, driven primarily by the growing demand for natural flavors and ingredients in various food and beverage applications. The report provides detailed insights into the drivers behind the dominance of this segment and specific regions.
- Key Drivers for Food & Beverage Dominance:
- Increasing consumer preference for natural and clean-label products.
- Growing demand for vanilla flavor in various food and beverage products.
- Significant investments in research and development to improve the quality and reduce the cost of bio-vanillin.
- Favorable regulatory environment in key regions promoting the use of natural ingredients.
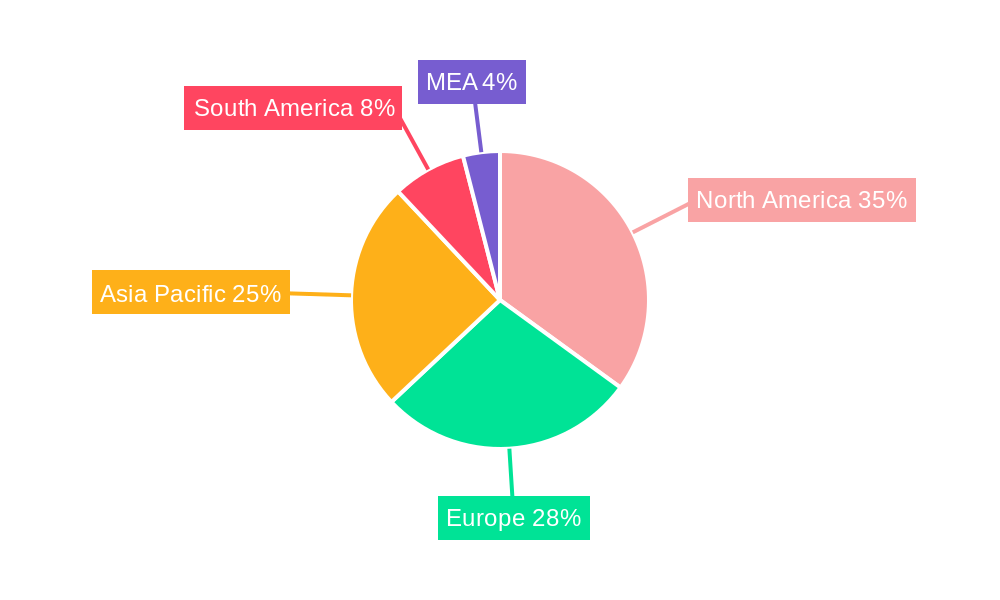
The analysis extends to a geographical breakdown, identifying leading regions and countries based on market size and growth potential. Factors influencing regional differences are explored in detail.
Bio Vanillin Market Product Innovations
Recent innovations in bio-vanillin production include advanced fermentation techniques, resulting in higher yields and improved product purity. This has led to cost reductions and broader applications, particularly in the pharmaceutical and fragrance industries. Unique selling propositions (USPs) of bio-vanillin include its natural origin, sustainability, and improved sensory characteristics compared to synthetic vanillin. The integration of advanced biotechnologies and innovative production processes continually enhances the product's performance metrics, leading to increased market acceptance.
Propelling Factors for Bio Vanillin Market Growth
The Bio Vanillin Market is propelled by several key factors: Firstly, the increasing consumer demand for natural and sustainable products is a significant driver. Secondly, technological advancements in fermentation and bio-engineering are leading to more efficient and cost-effective production methods. Thirdly, favorable government regulations and policies promoting the use of natural ingredients are also contributing to market expansion. The rising prevalence of health consciousness and the growing adoption of clean-label products further fuel this market growth.
Obstacles in the Bio Vanillin Market
Several factors hinder the growth of the Bio Vanillin Market. Regulatory hurdles in certain regions, particularly regarding the approval and labeling of bio-based ingredients, can create significant challenges. Supply chain disruptions due to factors such as raw material availability and production capacity constraints can impact the market. Competitive pressure from cheaper synthetic vanillin remains a persistent obstacle. These obstacles present quantifiable impacts on market growth that are carefully assessed within the full report.
Future Opportunities in Bio Vanillin Market
Future opportunities lie in expanding into new market segments, such as cosmetics and personal care, where the demand for natural ingredients is growing. The development of novel bio-based production methods, utilizing waste biomass or renewable resources, presents exciting opportunities for sustainable and cost-effective production. The exploration of new applications for bio-vanillin, leveraging its unique properties, will unlock further growth potential. These trends are detailed within the report, providing strategic insights for market players.
Major Players in the Bio Vanillin Market Ecosystem
- Firmenich SA
- Givaudan
- Evolva Holding SA
- Archer Daniels Midland Company
- Lesaffre
- Advanced Biotech
- AUROCHEMICAL
- Apple Flavor & Fragrance Group Co Ltd
Key Developments in Bio Vanillin Market Industry
- 2024-03: Evolva Holding SA announced a significant expansion of its bio-vanillin production capacity.
- 2023-11: Firmenich SA launched a new line of bio-vanillin based flavor compounds.
- 2022-06: Givaudan acquired a smaller bio-vanillin producer, enhancing its market presence.
- (Further key developments are detailed within the full report)
Strategic Bio Vanillin Market Forecast
The Bio Vanillin Market is poised for significant growth in the coming years, driven by strong demand from the food and beverage industry, along with advancements in bio-based production technologies. Emerging opportunities in new applications and regions, coupled with increasing consumer preference for natural products, will contribute to robust market expansion. The report provides a detailed forecast, outlining the potential market size and key growth drivers for the coming decade.
Bio Vanillin Market Segmentation
-
1. Application
-
1.1. Food
- 1.1.1. Ice Cream
- 1.1.2. Baked Goods
- 1.1.3. Chocolate
- 1.1.4. Other Foods
- 1.2. Beverage
- 1.3. Pharmaceutical
- 1.4. Fragrance
-
1.1. Food
Bio Vanillin Market Segmentation By Geography
-
1. North America
- 1.1. United States
- 1.2. Canada
- 1.3. Mexico
- 1.4. Rest of North America
-
2. Europe
- 2.1. United Kingdom
- 2.2. Germany
- 2.3. France
- 2.4. Russia
- 2.5. Italy
- 2.6. Rest of Europe
-
3. Asia Pacific
- 3.1. India
- 3.2. China
- 3.3. Japan
- 3.4. Australia
- 3.5. Rest of Asia Pacific
-
4. Rest of the World
- 4.1. South America
- 4.2. Middle East
Bio Vanillin Market REPORT HIGHLIGHTS
| Aspects | Details |
|---|---|
| Study Period | 2019-2033 |
| Base Year | 2024 |
| Estimated Year | 2025 |
| Forecast Period | 2025-2033 |
| Historical Period | 2019-2024 |
| Growth Rate | CAGR of 7.30% from 2019-2033 |
| Segmentation |
|
Table of Contents
- 1. Introduction
- 1.1. Research Scope
- 1.2. Market Segmentation
- 1.3. Research Methodology
- 1.4. Definitions and Assumptions
- 2. Executive Summary
- 2.1. Introduction
- 3. Market Dynamics
- 3.1. Introduction
- 3.2. Market Drivers
- 3.2.1. Surge in Demand for 'Free-from' Food Products; Demand For Convenient And Healthy On-the-go Snacking Options
- 3.3. Market Restrains
- 3.3.1. Health Risk Associated with Certain Ingredients
- 3.4. Market Trends
- 3.4.1. Growing Demand for Bio Vanillin in the Food and Beverage Industry
- 4. Market Factor Analysis
- 4.1. Porters Five Forces
- 4.2. Supply/Value Chain
- 4.3. PESTEL analysis
- 4.4. Market Entropy
- 4.5. Patent/Trademark Analysis
- 5. Global Bio Vanillin Market Analysis, Insights and Forecast, 2019-2031
- 5.1. Market Analysis, Insights and Forecast - by Application
- 5.1.1. Food
- 5.1.1.1. Ice Cream
- 5.1.1.2. Baked Goods
- 5.1.1.3. Chocolate
- 5.1.1.4. Other Foods
- 5.1.2. Beverage
- 5.1.3. Pharmaceutical
- 5.1.4. Fragrance
- 5.1.1. Food
- 5.2. Market Analysis, Insights and Forecast - by Region
- 5.2.1. North America
- 5.2.2. Europe
- 5.2.3. Asia Pacific
- 5.2.4. Rest of the World
- 5.1. Market Analysis, Insights and Forecast - by Application
- 6. North America Bio Vanillin Market Analysis, Insights and Forecast, 2019-2031
- 6.1. Market Analysis, Insights and Forecast - by Application
- 6.1.1. Food
- 6.1.1.1. Ice Cream
- 6.1.1.2. Baked Goods
- 6.1.1.3. Chocolate
- 6.1.1.4. Other Foods
- 6.1.2. Beverage
- 6.1.3. Pharmaceutical
- 6.1.4. Fragrance
- 6.1.1. Food
- 6.1. Market Analysis, Insights and Forecast - by Application
- 7. Europe Bio Vanillin Market Analysis, Insights and Forecast, 2019-2031
- 7.1. Market Analysis, Insights and Forecast - by Application
- 7.1.1. Food
- 7.1.1.1. Ice Cream
- 7.1.1.2. Baked Goods
- 7.1.1.3. Chocolate
- 7.1.1.4. Other Foods
- 7.1.2. Beverage
- 7.1.3. Pharmaceutical
- 7.1.4. Fragrance
- 7.1.1. Food
- 7.1. Market Analysis, Insights and Forecast - by Application
- 8. Asia Pacific Bio Vanillin Market Analysis, Insights and Forecast, 2019-2031
- 8.1. Market Analysis, Insights and Forecast - by Application
- 8.1.1. Food
- 8.1.1.1. Ice Cream
- 8.1.1.2. Baked Goods
- 8.1.1.3. Chocolate
- 8.1.1.4. Other Foods
- 8.1.2. Beverage
- 8.1.3. Pharmaceutical
- 8.1.4. Fragrance
- 8.1.1. Food
- 8.1. Market Analysis, Insights and Forecast - by Application
- 9. Rest of the World Bio Vanillin Market Analysis, Insights and Forecast, 2019-2031
- 9.1. Market Analysis, Insights and Forecast - by Application
- 9.1.1. Food
- 9.1.1.1. Ice Cream
- 9.1.1.2. Baked Goods
- 9.1.1.3. Chocolate
- 9.1.1.4. Other Foods
- 9.1.2. Beverage
- 9.1.3. Pharmaceutical
- 9.1.4. Fragrance
- 9.1.1. Food
- 9.1. Market Analysis, Insights and Forecast - by Application
- 10. North America Bio Vanillin Market Analysis, Insights and Forecast, 2019-2031
- 10.1. Market Analysis, Insights and Forecast - By Country/Sub-region
- 10.1.1 United States
- 10.1.2 Canada
- 10.1.3 Mexico
- 11. Europe Bio Vanillin Market Analysis, Insights and Forecast, 2019-2031
- 11.1. Market Analysis, Insights and Forecast - By Country/Sub-region
- 11.1.1 Germany
- 11.1.2 United Kingdom
- 11.1.3 France
- 11.1.4 Spain
- 11.1.5 Italy
- 11.1.6 Spain
- 11.1.7 Belgium
- 11.1.8 Netherland
- 11.1.9 Nordics
- 11.1.10 Rest of Europe
- 12. Asia Pacific Bio Vanillin Market Analysis, Insights and Forecast, 2019-2031
- 12.1. Market Analysis, Insights and Forecast - By Country/Sub-region
- 12.1.1 China
- 12.1.2 Japan
- 12.1.3 India
- 12.1.4 South Korea
- 12.1.5 Southeast Asia
- 12.1.6 Australia
- 12.1.7 Indonesia
- 12.1.8 Phillipes
- 12.1.9 Singapore
- 12.1.10 Thailandc
- 12.1.11 Rest of Asia Pacific
- 13. South America Bio Vanillin Market Analysis, Insights and Forecast, 2019-2031
- 13.1. Market Analysis, Insights and Forecast - By Country/Sub-region
- 13.1.1 Brazil
- 13.1.2 Argentina
- 13.1.3 Peru
- 13.1.4 Chile
- 13.1.5 Colombia
- 13.1.6 Ecuador
- 13.1.7 Venezuela
- 13.1.8 Rest of South America
- 14. MEA Bio Vanillin Market Analysis, Insights and Forecast, 2019-2031
- 14.1. Market Analysis, Insights and Forecast - By Country/Sub-region
- 14.1.1 United Arab Emirates
- 14.1.2 Saudi Arabia
- 14.1.3 South Africa
- 14.1.4 Rest of Middle East and Africa
- 15. Competitive Analysis
- 15.1. Global Market Share Analysis 2024
- 15.2. Company Profiles
- 15.2.1 Firmenich SA
- 15.2.1.1. Overview
- 15.2.1.2. Products
- 15.2.1.3. SWOT Analysis
- 15.2.1.4. Recent Developments
- 15.2.1.5. Financials (Based on Availability)
- 15.2.2 Givaudan
- 15.2.2.1. Overview
- 15.2.2.2. Products
- 15.2.2.3. SWOT Analysis
- 15.2.2.4. Recent Developments
- 15.2.2.5. Financials (Based on Availability)
- 15.2.3 Evolva Holding SA
- 15.2.3.1. Overview
- 15.2.3.2. Products
- 15.2.3.3. SWOT Analysis
- 15.2.3.4. Recent Developments
- 15.2.3.5. Financials (Based on Availability)
- 15.2.4 Archer Daniels Midland Company
- 15.2.4.1. Overview
- 15.2.4.2. Products
- 15.2.4.3. SWOT Analysis
- 15.2.4.4. Recent Developments
- 15.2.4.5. Financials (Based on Availability)
- 15.2.5 Lesaffre
- 15.2.5.1. Overview
- 15.2.5.2. Products
- 15.2.5.3. SWOT Analysis
- 15.2.5.4. Recent Developments
- 15.2.5.5. Financials (Based on Availability)
- 15.2.6 Advanced Biotech
- 15.2.6.1. Overview
- 15.2.6.2. Products
- 15.2.6.3. SWOT Analysis
- 15.2.6.4. Recent Developments
- 15.2.6.5. Financials (Based on Availability)
- 15.2.7 AUROCHEMICAL
- 15.2.7.1. Overview
- 15.2.7.2. Products
- 15.2.7.3. SWOT Analysis
- 15.2.7.4. Recent Developments
- 15.2.7.5. Financials (Based on Availability)
- 15.2.8 Apple Flavor & Fragrance Group Co Ltd
- 15.2.8.1. Overview
- 15.2.8.2. Products
- 15.2.8.3. SWOT Analysis
- 15.2.8.4. Recent Developments
- 15.2.8.5. Financials (Based on Availability)
- 15.2.1 Firmenich SA
List of Figures
- Figure 1: Global Bio Vanillin Market Revenue Breakdown (Million, %) by Region 2024 & 2032
- Figure 2: Global Bio Vanillin Market Volume Breakdown (K Units, %) by Region 2024 & 2032
- Figure 3: North America Bio Vanillin Market Revenue (Million), by Country 2024 & 2032
- Figure 4: North America Bio Vanillin Market Volume (K Units), by Country 2024 & 2032
- Figure 5: North America Bio Vanillin Market Revenue Share (%), by Country 2024 & 2032
- Figure 6: North America Bio Vanillin Market Volume Share (%), by Country 2024 & 2032
- Figure 7: Europe Bio Vanillin Market Revenue (Million), by Country 2024 & 2032
- Figure 8: Europe Bio Vanillin Market Volume (K Units), by Country 2024 & 2032
- Figure 9: Europe Bio Vanillin Market Revenue Share (%), by Country 2024 & 2032
- Figure 10: Europe Bio Vanillin Market Volume Share (%), by Country 2024 & 2032
- Figure 11: Asia Pacific Bio Vanillin Market Revenue (Million), by Country 2024 & 2032
- Figure 12: Asia Pacific Bio Vanillin Market Volume (K Units), by Country 2024 & 2032
- Figure 13: Asia Pacific Bio Vanillin Market Revenue Share (%), by Country 2024 & 2032
- Figure 14: Asia Pacific Bio Vanillin Market Volume Share (%), by Country 2024 & 2032
- Figure 15: South America Bio Vanillin Market Revenue (Million), by Country 2024 & 2032
- Figure 16: South America Bio Vanillin Market Volume (K Units), by Country 2024 & 2032
- Figure 17: South America Bio Vanillin Market Revenue Share (%), by Country 2024 & 2032
- Figure 18: South America Bio Vanillin Market Volume Share (%), by Country 2024 & 2032
- Figure 19: MEA Bio Vanillin Market Revenue (Million), by Country 2024 & 2032
- Figure 20: MEA Bio Vanillin Market Volume (K Units), by Country 2024 & 2032
- Figure 21: MEA Bio Vanillin Market Revenue Share (%), by Country 2024 & 2032
- Figure 22: MEA Bio Vanillin Market Volume Share (%), by Country 2024 & 2032
- Figure 23: North America Bio Vanillin Market Revenue (Million), by Application 2024 & 2032
- Figure 24: North America Bio Vanillin Market Volume (K Units), by Application 2024 & 2032
- Figure 25: North America Bio Vanillin Market Revenue Share (%), by Application 2024 & 2032
- Figure 26: North America Bio Vanillin Market Volume Share (%), by Application 2024 & 2032
- Figure 27: North America Bio Vanillin Market Revenue (Million), by Country 2024 & 2032
- Figure 28: North America Bio Vanillin Market Volume (K Units), by Country 2024 & 2032
- Figure 29: North America Bio Vanillin Market Revenue Share (%), by Country 2024 & 2032
- Figure 30: North America Bio Vanillin Market Volume Share (%), by Country 2024 & 2032
- Figure 31: Europe Bio Vanillin Market Revenue (Million), by Application 2024 & 2032
- Figure 32: Europe Bio Vanillin Market Volume (K Units), by Application 2024 & 2032
- Figure 33: Europe Bio Vanillin Market Revenue Share (%), by Application 2024 & 2032
- Figure 34: Europe Bio Vanillin Market Volume Share (%), by Application 2024 & 2032
- Figure 35: Europe Bio Vanillin Market Revenue (Million), by Country 2024 & 2032
- Figure 36: Europe Bio Vanillin Market Volume (K Units), by Country 2024 & 2032
- Figure 37: Europe Bio Vanillin Market Revenue Share (%), by Country 2024 & 2032
- Figure 38: Europe Bio Vanillin Market Volume Share (%), by Country 2024 & 2032
- Figure 39: Asia Pacific Bio Vanillin Market Revenue (Million), by Application 2024 & 2032
- Figure 40: Asia Pacific Bio Vanillin Market Volume (K Units), by Application 2024 & 2032
- Figure 41: Asia Pacific Bio Vanillin Market Revenue Share (%), by Application 2024 & 2032
- Figure 42: Asia Pacific Bio Vanillin Market Volume Share (%), by Application 2024 & 2032
- Figure 43: Asia Pacific Bio Vanillin Market Revenue (Million), by Country 2024 & 2032
- Figure 44: Asia Pacific Bio Vanillin Market Volume (K Units), by Country 2024 & 2032
- Figure 45: Asia Pacific Bio Vanillin Market Revenue Share (%), by Country 2024 & 2032
- Figure 46: Asia Pacific Bio Vanillin Market Volume Share (%), by Country 2024 & 2032
- Figure 47: Rest of the World Bio Vanillin Market Revenue (Million), by Application 2024 & 2032
- Figure 48: Rest of the World Bio Vanillin Market Volume (K Units), by Application 2024 & 2032
- Figure 49: Rest of the World Bio Vanillin Market Revenue Share (%), by Application 2024 & 2032
- Figure 50: Rest of the World Bio Vanillin Market Volume Share (%), by Application 2024 & 2032
- Figure 51: Rest of the World Bio Vanillin Market Revenue (Million), by Country 2024 & 2032
- Figure 52: Rest of the World Bio Vanillin Market Volume (K Units), by Country 2024 & 2032
- Figure 53: Rest of the World Bio Vanillin Market Revenue Share (%), by Country 2024 & 2032
- Figure 54: Rest of the World Bio Vanillin Market Volume Share (%), by Country 2024 & 2032
List of Tables
- Table 1: Global Bio Vanillin Market Revenue Million Forecast, by Region 2019 & 2032
- Table 2: Global Bio Vanillin Market Volume K Units Forecast, by Region 2019 & 2032
- Table 3: Global Bio Vanillin Market Revenue Million Forecast, by Application 2019 & 2032
- Table 4: Global Bio Vanillin Market Volume K Units Forecast, by Application 2019 & 2032
- Table 5: Global Bio Vanillin Market Revenue Million Forecast, by Region 2019 & 2032
- Table 6: Global Bio Vanillin Market Volume K Units Forecast, by Region 2019 & 2032
- Table 7: Global Bio Vanillin Market Revenue Million Forecast, by Country 2019 & 2032
- Table 8: Global Bio Vanillin Market Volume K Units Forecast, by Country 2019 & 2032
- Table 9: United States Bio Vanillin Market Revenue (Million) Forecast, by Application 2019 & 2032
- Table 10: United States Bio Vanillin Market Volume (K Units) Forecast, by Application 2019 & 2032
- Table 11: Canada Bio Vanillin Market Revenue (Million) Forecast, by Application 2019 & 2032
- Table 12: Canada Bio Vanillin Market Volume (K Units) Forecast, by Application 2019 & 2032
- Table 13: Mexico Bio Vanillin Market Revenue (Million) Forecast, by Application 2019 & 2032
- Table 14: Mexico Bio Vanillin Market Volume (K Units) Forecast, by Application 2019 & 2032
- Table 15: Global Bio Vanillin Market Revenue Million Forecast, by Country 2019 & 2032
- Table 16: Global Bio Vanillin Market Volume K Units Forecast, by Country 2019 & 2032
- Table 17: Germany Bio Vanillin Market Revenue (Million) Forecast, by Application 2019 & 2032
- Table 18: Germany Bio Vanillin Market Volume (K Units) Forecast, by Application 2019 & 2032
- Table 19: United Kingdom Bio Vanillin Market Revenue (Million) Forecast, by Application 2019 & 2032
- Table 20: United Kingdom Bio Vanillin Market Volume (K Units) Forecast, by Application 2019 & 2032
- Table 21: France Bio Vanillin Market Revenue (Million) Forecast, by Application 2019 & 2032
- Table 22: France Bio Vanillin Market Volume (K Units) Forecast, by Application 2019 & 2032
- Table 23: Spain Bio Vanillin Market Revenue (Million) Forecast, by Application 2019 & 2032
- Table 24: Spain Bio Vanillin Market Volume (K Units) Forecast, by Application 2019 & 2032
- Table 25: Italy Bio Vanillin Market Revenue (Million) Forecast, by Application 2019 & 2032
- Table 26: Italy Bio Vanillin Market Volume (K Units) Forecast, by Application 2019 & 2032
- Table 27: Spain Bio Vanillin Market Revenue (Million) Forecast, by Application 2019 & 2032
- Table 28: Spain Bio Vanillin Market Volume (K Units) Forecast, by Application 2019 & 2032
- Table 29: Belgium Bio Vanillin Market Revenue (Million) Forecast, by Application 2019 & 2032
- Table 30: Belgium Bio Vanillin Market Volume (K Units) Forecast, by Application 2019 & 2032
- Table 31: Netherland Bio Vanillin Market Revenue (Million) Forecast, by Application 2019 & 2032
- Table 32: Netherland Bio Vanillin Market Volume (K Units) Forecast, by Application 2019 & 2032
- Table 33: Nordics Bio Vanillin Market Revenue (Million) Forecast, by Application 2019 & 2032
- Table 34: Nordics Bio Vanillin Market Volume (K Units) Forecast, by Application 2019 & 2032
- Table 35: Rest of Europe Bio Vanillin Market Revenue (Million) Forecast, by Application 2019 & 2032
- Table 36: Rest of Europe Bio Vanillin Market Volume (K Units) Forecast, by Application 2019 & 2032
- Table 37: Global Bio Vanillin Market Revenue Million Forecast, by Country 2019 & 2032
- Table 38: Global Bio Vanillin Market Volume K Units Forecast, by Country 2019 & 2032
- Table 39: China Bio Vanillin Market Revenue (Million) Forecast, by Application 2019 & 2032
- Table 40: China Bio Vanillin Market Volume (K Units) Forecast, by Application 2019 & 2032
- Table 41: Japan Bio Vanillin Market Revenue (Million) Forecast, by Application 2019 & 2032
- Table 42: Japan Bio Vanillin Market Volume (K Units) Forecast, by Application 2019 & 2032
- Table 43: India Bio Vanillin Market Revenue (Million) Forecast, by Application 2019 & 2032
- Table 44: India Bio Vanillin Market Volume (K Units) Forecast, by Application 2019 & 2032
- Table 45: South Korea Bio Vanillin Market Revenue (Million) Forecast, by Application 2019 & 2032
- Table 46: South Korea Bio Vanillin Market Volume (K Units) Forecast, by Application 2019 & 2032
- Table 47: Southeast Asia Bio Vanillin Market Revenue (Million) Forecast, by Application 2019 & 2032
- Table 48: Southeast Asia Bio Vanillin Market Volume (K Units) Forecast, by Application 2019 & 2032
- Table 49: Australia Bio Vanillin Market Revenue (Million) Forecast, by Application 2019 & 2032
- Table 50: Australia Bio Vanillin Market Volume (K Units) Forecast, by Application 2019 & 2032
- Table 51: Indonesia Bio Vanillin Market Revenue (Million) Forecast, by Application 2019 & 2032
- Table 52: Indonesia Bio Vanillin Market Volume (K Units) Forecast, by Application 2019 & 2032
- Table 53: Phillipes Bio Vanillin Market Revenue (Million) Forecast, by Application 2019 & 2032
- Table 54: Phillipes Bio Vanillin Market Volume (K Units) Forecast, by Application 2019 & 2032
- Table 55: Singapore Bio Vanillin Market Revenue (Million) Forecast, by Application 2019 & 2032
- Table 56: Singapore Bio Vanillin Market Volume (K Units) Forecast, by Application 2019 & 2032
- Table 57: Thailandc Bio Vanillin Market Revenue (Million) Forecast, by Application 2019 & 2032
- Table 58: Thailandc Bio Vanillin Market Volume (K Units) Forecast, by Application 2019 & 2032
- Table 59: Rest of Asia Pacific Bio Vanillin Market Revenue (Million) Forecast, by Application 2019 & 2032
- Table 60: Rest of Asia Pacific Bio Vanillin Market Volume (K Units) Forecast, by Application 2019 & 2032
- Table 61: Global Bio Vanillin Market Revenue Million Forecast, by Country 2019 & 2032
- Table 62: Global Bio Vanillin Market Volume K Units Forecast, by Country 2019 & 2032
- Table 63: Brazil Bio Vanillin Market Revenue (Million) Forecast, by Application 2019 & 2032
- Table 64: Brazil Bio Vanillin Market Volume (K Units) Forecast, by Application 2019 & 2032
- Table 65: Argentina Bio Vanillin Market Revenue (Million) Forecast, by Application 2019 & 2032
- Table 66: Argentina Bio Vanillin Market Volume (K Units) Forecast, by Application 2019 & 2032
- Table 67: Peru Bio Vanillin Market Revenue (Million) Forecast, by Application 2019 & 2032
- Table 68: Peru Bio Vanillin Market Volume (K Units) Forecast, by Application 2019 & 2032
- Table 69: Chile Bio Vanillin Market Revenue (Million) Forecast, by Application 2019 & 2032
- Table 70: Chile Bio Vanillin Market Volume (K Units) Forecast, by Application 2019 & 2032
- Table 71: Colombia Bio Vanillin Market Revenue (Million) Forecast, by Application 2019 & 2032
- Table 72: Colombia Bio Vanillin Market Volume (K Units) Forecast, by Application 2019 & 2032
- Table 73: Ecuador Bio Vanillin Market Revenue (Million) Forecast, by Application 2019 & 2032
- Table 74: Ecuador Bio Vanillin Market Volume (K Units) Forecast, by Application 2019 & 2032
- Table 75: Venezuela Bio Vanillin Market Revenue (Million) Forecast, by Application 2019 & 2032
- Table 76: Venezuela Bio Vanillin Market Volume (K Units) Forecast, by Application 2019 & 2032
- Table 77: Rest of South America Bio Vanillin Market Revenue (Million) Forecast, by Application 2019 & 2032
- Table 78: Rest of South America Bio Vanillin Market Volume (K Units) Forecast, by Application 2019 & 2032
- Table 79: Global Bio Vanillin Market Revenue Million Forecast, by Country 2019 & 2032
- Table 80: Global Bio Vanillin Market Volume K Units Forecast, by Country 2019 & 2032
- Table 81: United Arab Emirates Bio Vanillin Market Revenue (Million) Forecast, by Application 2019 & 2032
- Table 82: United Arab Emirates Bio Vanillin Market Volume (K Units) Forecast, by Application 2019 & 2032
- Table 83: Saudi Arabia Bio Vanillin Market Revenue (Million) Forecast, by Application 2019 & 2032
- Table 84: Saudi Arabia Bio Vanillin Market Volume (K Units) Forecast, by Application 2019 & 2032
- Table 85: South Africa Bio Vanillin Market Revenue (Million) Forecast, by Application 2019 & 2032
- Table 86: South Africa Bio Vanillin Market Volume (K Units) Forecast, by Application 2019 & 2032
- Table 87: Rest of Middle East and Africa Bio Vanillin Market Revenue (Million) Forecast, by Application 2019 & 2032
- Table 88: Rest of Middle East and Africa Bio Vanillin Market Volume (K Units) Forecast, by Application 2019 & 2032
- Table 89: Global Bio Vanillin Market Revenue Million Forecast, by Application 2019 & 2032
- Table 90: Global Bio Vanillin Market Volume K Units Forecast, by Application 2019 & 2032
- Table 91: Global Bio Vanillin Market Revenue Million Forecast, by Country 2019 & 2032
- Table 92: Global Bio Vanillin Market Volume K Units Forecast, by Country 2019 & 2032
- Table 93: United States Bio Vanillin Market Revenue (Million) Forecast, by Application 2019 & 2032
- Table 94: United States Bio Vanillin Market Volume (K Units) Forecast, by Application 2019 & 2032
- Table 95: Canada Bio Vanillin Market Revenue (Million) Forecast, by Application 2019 & 2032
- Table 96: Canada Bio Vanillin Market Volume (K Units) Forecast, by Application 2019 & 2032
- Table 97: Mexico Bio Vanillin Market Revenue (Million) Forecast, by Application 2019 & 2032
- Table 98: Mexico Bio Vanillin Market Volume (K Units) Forecast, by Application 2019 & 2032
- Table 99: Rest of North America Bio Vanillin Market Revenue (Million) Forecast, by Application 2019 & 2032
- Table 100: Rest of North America Bio Vanillin Market Volume (K Units) Forecast, by Application 2019 & 2032
- Table 101: Global Bio Vanillin Market Revenue Million Forecast, by Application 2019 & 2032
- Table 102: Global Bio Vanillin Market Volume K Units Forecast, by Application 2019 & 2032
- Table 103: Global Bio Vanillin Market Revenue Million Forecast, by Country 2019 & 2032
- Table 104: Global Bio Vanillin Market Volume K Units Forecast, by Country 2019 & 2032
- Table 105: United Kingdom Bio Vanillin Market Revenue (Million) Forecast, by Application 2019 & 2032
- Table 106: United Kingdom Bio Vanillin Market Volume (K Units) Forecast, by Application 2019 & 2032
- Table 107: Germany Bio Vanillin Market Revenue (Million) Forecast, by Application 2019 & 2032
- Table 108: Germany Bio Vanillin Market Volume (K Units) Forecast, by Application 2019 & 2032
- Table 109: France Bio Vanillin Market Revenue (Million) Forecast, by Application 2019 & 2032
- Table 110: France Bio Vanillin Market Volume (K Units) Forecast, by Application 2019 & 2032
- Table 111: Russia Bio Vanillin Market Revenue (Million) Forecast, by Application 2019 & 2032
- Table 112: Russia Bio Vanillin Market Volume (K Units) Forecast, by Application 2019 & 2032
- Table 113: Italy Bio Vanillin Market Revenue (Million) Forecast, by Application 2019 & 2032
- Table 114: Italy Bio Vanillin Market Volume (K Units) Forecast, by Application 2019 & 2032
- Table 115: Rest of Europe Bio Vanillin Market Revenue (Million) Forecast, by Application 2019 & 2032
- Table 116: Rest of Europe Bio Vanillin Market Volume (K Units) Forecast, by Application 2019 & 2032
- Table 117: Global Bio Vanillin Market Revenue Million Forecast, by Application 2019 & 2032
- Table 118: Global Bio Vanillin Market Volume K Units Forecast, by Application 2019 & 2032
- Table 119: Global Bio Vanillin Market Revenue Million Forecast, by Country 2019 & 2032
- Table 120: Global Bio Vanillin Market Volume K Units Forecast, by Country 2019 & 2032
- Table 121: India Bio Vanillin Market Revenue (Million) Forecast, by Application 2019 & 2032
- Table 122: India Bio Vanillin Market Volume (K Units) Forecast, by Application 2019 & 2032
- Table 123: China Bio Vanillin Market Revenue (Million) Forecast, by Application 2019 & 2032
- Table 124: China Bio Vanillin Market Volume (K Units) Forecast, by Application 2019 & 2032
- Table 125: Japan Bio Vanillin Market Revenue (Million) Forecast, by Application 2019 & 2032
- Table 126: Japan Bio Vanillin Market Volume (K Units) Forecast, by Application 2019 & 2032
- Table 127: Australia Bio Vanillin Market Revenue (Million) Forecast, by Application 2019 & 2032
- Table 128: Australia Bio Vanillin Market Volume (K Units) Forecast, by Application 2019 & 2032
- Table 129: Rest of Asia Pacific Bio Vanillin Market Revenue (Million) Forecast, by Application 2019 & 2032
- Table 130: Rest of Asia Pacific Bio Vanillin Market Volume (K Units) Forecast, by Application 2019 & 2032
- Table 131: Global Bio Vanillin Market Revenue Million Forecast, by Application 2019 & 2032
- Table 132: Global Bio Vanillin Market Volume K Units Forecast, by Application 2019 & 2032
- Table 133: Global Bio Vanillin Market Revenue Million Forecast, by Country 2019 & 2032
- Table 134: Global Bio Vanillin Market Volume K Units Forecast, by Country 2019 & 2032
- Table 135: South America Bio Vanillin Market Revenue (Million) Forecast, by Application 2019 & 2032
- Table 136: South America Bio Vanillin Market Volume (K Units) Forecast, by Application 2019 & 2032
- Table 137: Middle East Bio Vanillin Market Revenue (Million) Forecast, by Application 2019 & 2032
- Table 138: Middle East Bio Vanillin Market Volume (K Units) Forecast, by Application 2019 & 2032
Frequently Asked Questions
1. What is the projected Compound Annual Growth Rate (CAGR) of the Bio Vanillin Market?
The projected CAGR is approximately 7.30%.
2. Which companies are prominent players in the Bio Vanillin Market?
Key companies in the market include Firmenich SA, Givaudan, Evolva Holding SA, Archer Daniels Midland Company, Lesaffre, Advanced Biotech, AUROCHEMICAL, Apple Flavor & Fragrance Group Co Ltd.
3. What are the main segments of the Bio Vanillin Market?
The market segments include Application.
4. Can you provide details about the market size?
The market size is estimated to be USD 277.69 Million as of 2022.
5. What are some drivers contributing to market growth?
Surge in Demand for 'Free-from' Food Products; Demand For Convenient And Healthy On-the-go Snacking Options.
6. What are the notable trends driving market growth?
Growing Demand for Bio Vanillin in the Food and Beverage Industry.
7. Are there any restraints impacting market growth?
Health Risk Associated with Certain Ingredients.
8. Can you provide examples of recent developments in the market?
N/A
9. What pricing options are available for accessing the report?
Pricing options include single-user, multi-user, and enterprise licenses priced at USD 4750, USD 5250, and USD 8750 respectively.
10. Is the market size provided in terms of value or volume?
The market size is provided in terms of value, measured in Million and volume, measured in K Units.
11. Are there any specific market keywords associated with the report?
Yes, the market keyword associated with the report is "Bio Vanillin Market," which aids in identifying and referencing the specific market segment covered.
12. How do I determine which pricing option suits my needs best?
The pricing options vary based on user requirements and access needs. Individual users may opt for single-user licenses, while businesses requiring broader access may choose multi-user or enterprise licenses for cost-effective access to the report.
13. Are there any additional resources or data provided in the Bio Vanillin Market report?
While the report offers comprehensive insights, it's advisable to review the specific contents or supplementary materials provided to ascertain if additional resources or data are available.
14. How can I stay updated on further developments or reports in the Bio Vanillin Market?
To stay informed about further developments, trends, and reports in the Bio Vanillin Market, consider subscribing to industry newsletters, following relevant companies and organizations, or regularly checking reputable industry news sources and publications.
Methodology
Step 1 - Identification of Relevant Samples Size from Population Database


Step 2 - Approaches for Defining Global Market Size (Value, Volume* & Price*)

Note*: In applicable scenarios
Step 3 - Data Sources
Primary Research
- Web Analytics
- Survey Reports
- Research Institute
- Latest Research Reports
- Opinion Leaders
Secondary Research
- Annual Reports
- White Paper
- Latest Press Release
- Industry Association
- Paid Database
- Investor Presentations

Step 4 - Data Triangulation
Involves using different sources of information in order to increase the validity of a study
These sources are likely to be stakeholders in a program - participants, other researchers, program staff, other community members, and so on.
Then we put all data in single framework & apply various statistical tools to find out the dynamic on the market.
During the analysis stage, feedback from the stakeholder groups would be compared to determine areas of agreement as well as areas of divergence
