

Key Insights
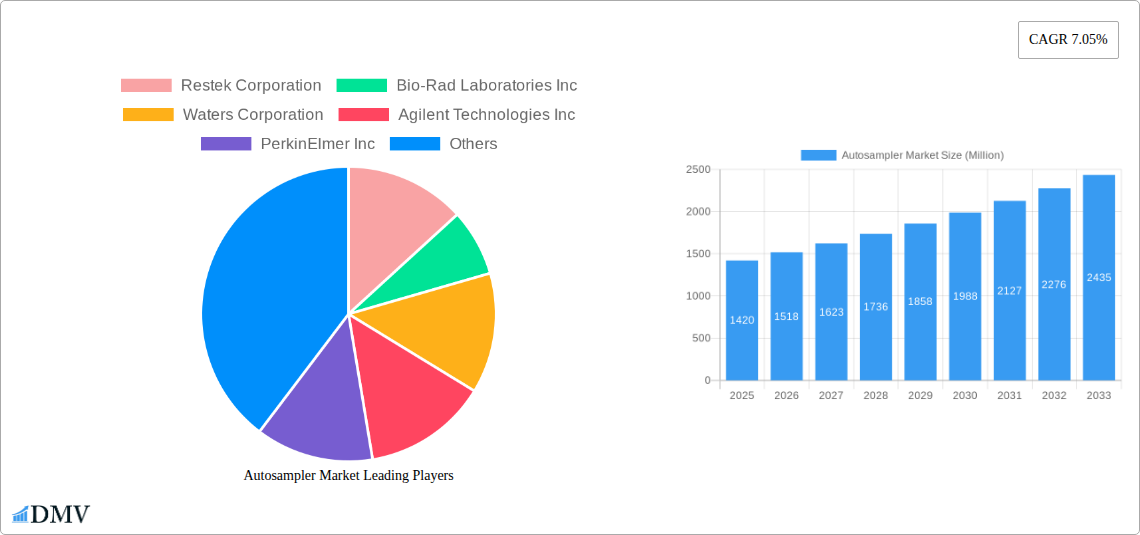
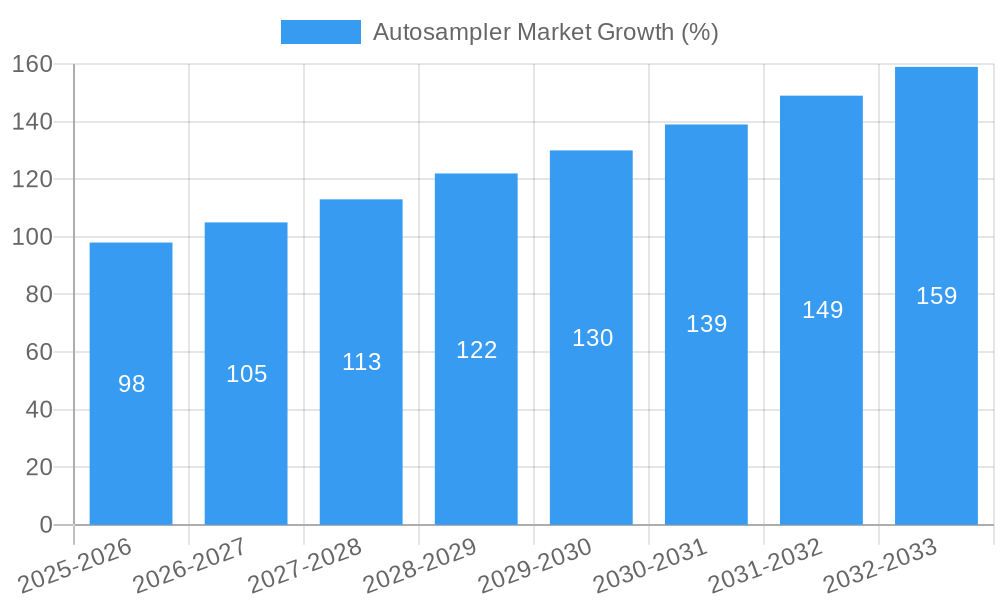
The global autosampler market, valued at $1.42 billion in 2025, is projected to experience robust growth, driven by a compound annual growth rate (CAGR) of 7.05% from 2025 to 2033. This expansion is fueled by several key factors. The pharmaceutical and biopharmaceutical industries, major consumers of autosamplers for high-throughput screening and analysis, are investing heavily in automation and efficiency improvements, directly boosting demand. Furthermore, the increasing focus on food safety and environmental monitoring is creating a significant need for precise and reliable analytical techniques, driving adoption across the food and beverage and environmental testing sectors. Advancements in autosampler technology, such as improved precision, increased sample capacity, and integration with other analytical instruments, are also contributing to market growth. The market is segmented by product type (systems, accessories, and gas chromatography autosamplers) and end-user industry. Systems currently dominate the market share, followed by accessories, reflecting the substantial investment in complete analytical workflows. While the pharmaceutical and biopharmaceutical sector holds the largest market share, growth in the food and beverage and environmental testing industries is expected to contribute significantly to overall market expansion in the coming years. Competition is intense, with key players including Restek Corporation, Bio-Rad Laboratories Inc., Waters Corporation, Agilent Technologies Inc., PerkinElmer Inc., Scion Instruments, Gilson Inc., Thermo Fisher Scientific, and Shimadzu Corporation continuously innovating to maintain their market positions.
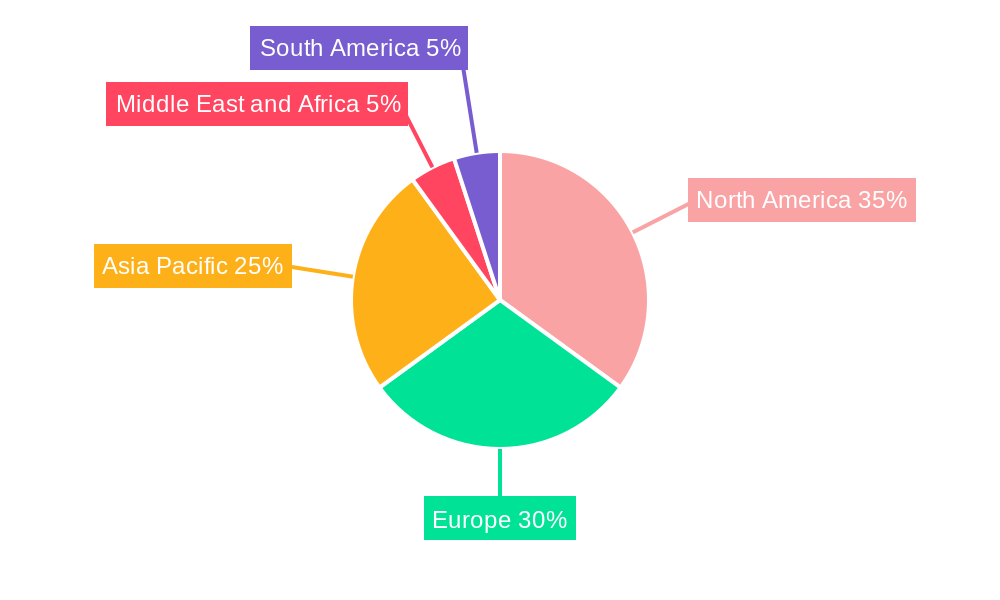
Geographical distribution reveals strong presence in North America and Europe, driven by established research infrastructure and stringent regulatory environments. However, the Asia-Pacific region is poised for significant growth, fueled by expanding economies, increasing healthcare investments, and growing awareness of environmental regulations. The market's future growth hinges on continued technological advancements, expanding regulatory frameworks mandating improved analytical capabilities, and increasing adoption across emerging economies. The continued emphasis on automation and high-throughput analysis in various industries is expected to significantly contribute to the market's sustained growth throughout the forecast period.
Autosampler Market: A Comprehensive Report (2019-2033)
This insightful report provides a detailed analysis of the global Autosampler Market, projecting a robust growth trajectory throughout the forecast period (2025-2033). The study encompasses a comprehensive overview of market dynamics, competitive landscapes, technological advancements, and future opportunities, equipping stakeholders with critical insights for strategic decision-making. With a base year of 2025 and a study period spanning 2019-2033, this report leverages extensive primary and secondary research to deliver accurate and actionable intelligence. The market is expected to reach xx Million by 2033.
Autosampler Market Composition & Trends
This section delves into the intricate composition of the autosampler market, examining market concentration, innovation drivers, regulatory landscapes, substitute products, end-user profiles, and mergers & acquisitions (M&A) activities. The report analyzes the market share distribution among key players like Restek Corporation, Bio-Rad Laboratories Inc, Waters Corporation, Agilent Technologies Inc, PerkinElmer Inc, Scion Instruments, Gilson Inc, Thermo Fisher Scientific, and Shimadzu Corporation, revealing a moderately concentrated market with ongoing consolidation.
- Market Concentration: The market exhibits moderate concentration, with the top five players holding an estimated xx% market share in 2025.
- Innovation Catalysts: Miniaturization, automation, and integration with advanced analytical techniques drive innovation.
- Regulatory Landscape: Stringent regulatory frameworks, particularly in the pharmaceutical and environmental sectors, influence market growth.
- Substitute Products: Manual sample handling remains a substitute, but its limitations fuel the demand for autosamplers.
- End-User Profiles: Pharmaceutical and biopharmaceutical companies, followed by the food and beverage and environmental testing industries, represent the primary end-users.
- M&A Activities: The report details recent M&A activities, including deal values and their impact on market dynamics. For instance, the acquisition of Prolab Instruments GmbH by Bruker Corporation in January 2022 strengthened Bruker's position in high-precision liquid chromatography. Total M&A deal value in the historical period (2019-2024) is estimated at xx Million.
Autosampler Market Industry Evolution
This section provides a comprehensive analysis of the autosampler market's evolutionary path, charting its growth trajectories, technological advancements, and evolving consumer demands from 2019 to 2033. The market is driven by the increasing demand for high-throughput screening in various industries, coupled with the adoption of advanced analytical techniques like LC-MS. Technological innovations such as improved injection precision, increased sample capacity, and enhanced automation capabilities contribute significantly to market expansion. The report also examines shifting consumer demands towards higher efficiency, reduced operational costs, and improved data quality. The market is projected to register a CAGR of xx% during the forecast period.
Leading Regions, Countries, or Segments in Autosampler Market
This section identifies the dominant regions, countries, and segments within the autosampler market. Based on our analysis, North America and Europe currently hold the largest market shares, driven by factors detailed below:
- Key Drivers (North America): High adoption rates in pharmaceutical and biopharmaceutical companies, robust research and development investments, and a strong regulatory framework.
- Key Drivers (Europe): Similar factors to North America, coupled with stringent environmental regulations driving demand in environmental testing labs.
- Dominant Segments:
- Product: Systems segment dominates due to its comprehensive functionality and integration capabilities.
- Gas Chromatography Autosamplers: Growing popularity in environmental and food safety testing.
- Accessories: A significant market segment, driven by the need for consumables and maintenance components.
- End-User: The pharmaceutical and biopharmaceutical industry leads due to high sample throughput demands.
Autosampler Market Product Innovations
Recent product innovations focus on enhanced precision, increased throughput, and improved user experience. Manufacturers are introducing autosamplers with advanced features such as automated sample preparation, integrated software for data analysis, and compatibility with a wide range of analytical instruments. These advancements are improving efficiency and reducing operational costs, driving market growth. Unique selling propositions include minimized sample carryover, improved injection accuracy, and increased sample capacity.
Propelling Factors for Autosampler Market Growth
Several factors contribute to the market's growth. Technological advancements like miniaturization and automation increase efficiency and throughput. The rising demand for high-throughput screening across various industries fuels market expansion. Stringent regulatory requirements in sectors such as pharmaceuticals and environmental testing mandate the use of accurate and reliable autosamplers. Furthermore, increasing research and development investments across various sectors further bolster market growth.
Obstacles in the Autosampler Market
The autosampler market faces challenges like high initial investment costs, the complexity of operation and maintenance, and the risk of sample contamination. Supply chain disruptions, particularly for specialized components, can impact production and delivery times. Intense competition among established players and emerging companies also poses a challenge. These factors can collectively influence market growth by an estimated xx% by 2033.
Future Opportunities in Autosampler Market
Future opportunities lie in developing autosamplers with advanced features such as artificial intelligence (AI)-powered sample analysis, integrated data management systems, and increased compatibility with various analytical platforms. Expanding into emerging markets in Asia-Pacific and Latin America presents significant growth potential. The development of autosamplers tailored to specific applications, such as environmental monitoring and food safety testing, presents another avenue for expansion.
Major Players in the Autosampler Market Ecosystem
- Restek Corporation
- Bio-Rad Laboratories Inc
- Waters Corporation
- Agilent Technologies Inc
- PerkinElmer Inc
- Scion Instruments
- Gilson Inc
- Thermo Fisher Scientific
- Shimadzu Corporation
Key Developments in Autosampler Market Industry
- May 2022: Agilent Technologies Inc. collaborated with APC Ltd. to integrate technologies for automated process analysis via liquid chromatography (LC).
- February 2022: Thermo Scientific launched the SureStart consumables portfolio, compatible with various chromatography autosamplers.
- January 2022: Bruker Corporation acquired Prolab Instruments GmbH, enhancing its capabilities in liquid chromatography.
Strategic Autosampler Market Forecast
The autosampler market is poised for significant growth, fueled by continuous technological advancements, increasing demand from diverse industries, and expanding applications. The market's future trajectory is positive, with substantial opportunities for players to capitalize on emerging trends and expand into new markets. This forecast considers various factors, including technological breakthroughs, regulatory changes, and economic growth, to predict a continued upward trend in market value and adoption rates.
Autosampler Market Segmentation
-
1. Product
-
1.1. Systems
- 1.1.1. Liquid Chromatography Autosamplers
- 1.1.2. Gas Chromatography Autosamplers
- 1.2. Accessories
-
1.1. Systems
-
2. End-User
- 2.1. Pharmaceutical and Biopharmaceutical Companies
- 2.2. Food and Beverage Industry
- 2.3. Environmental Testing Industry
- 2.4. Others
Autosampler Market Segmentation By Geography
-
1. North America
- 1.1. United States
- 1.2. Canada
- 1.3. Mexico
-
2. Europe
- 2.1. Germany
- 2.2. United Kingdom
- 2.3. France
- 2.4. Italy
- 2.5. Spain
- 2.6. Rest of Europe
-
3. Asia Pacific
- 3.1. China
- 3.2. Japan
- 3.3. India
- 3.4. Australia
- 3.5. South Korea
- 3.6. Rest of Asia Pacific
-
4. Middle East and Africa
- 4.1. GCC
- 4.2. South Africa
- 4.3. Rest of Middle East and Africa
-
5. South America
- 5.1. Brazil
- 5.2. Argentina
- 5.3. Rest of South America
Autosampler Market REPORT HIGHLIGHTS
| Aspects | Details |
|---|---|
| Study Period | 2019-2033 |
| Base Year | 2024 |
| Estimated Year | 2025 |
| Forecast Period | 2025-2033 |
| Historical Period | 2019-2024 |
| Growth Rate | CAGR of 7.05% from 2019-2033 |
| Segmentation |
|
Table of Contents
- 1. Introduction
- 1.1. Research Scope
- 1.2. Market Segmentation
- 1.3. Research Methodology
- 1.4. Definitions and Assumptions
- 2. Executive Summary
- 2.1. Introduction
- 3. Market Dynamics
- 3.1. Introduction
- 3.2. Market Drivers
- 3.2.1. Various Advantages of Autosamplers Coupled with Growing Importance of Chromatography in Drug Approval; Increasing Food Safety Concerns
- 3.3. Market Restrains
- 3.3.1. Lack of Skilled Professionals; Limitations in Budget of Small and Mid-Size Market Players
- 3.4. Market Trends
- 3.4.1. Pharmaceutical and Biotechnology Companies are Expected to Witness High Growth Over the Forecast Period
- 4. Market Factor Analysis
- 4.1. Porters Five Forces
- 4.2. Supply/Value Chain
- 4.3. PESTEL analysis
- 4.4. Market Entropy
- 4.5. Patent/Trademark Analysis
- 5. Global Autosampler Market Analysis, Insights and Forecast, 2019-2031
- 5.1. Market Analysis, Insights and Forecast - by Product
- 5.1.1. Systems
- 5.1.1.1. Liquid Chromatography Autosamplers
- 5.1.1.2. Gas Chromatography Autosamplers
- 5.1.2. Accessories
- 5.1.1. Systems
- 5.2. Market Analysis, Insights and Forecast - by End-User
- 5.2.1. Pharmaceutical and Biopharmaceutical Companies
- 5.2.2. Food and Beverage Industry
- 5.2.3. Environmental Testing Industry
- 5.2.4. Others
- 5.3. Market Analysis, Insights and Forecast - by Region
- 5.3.1. North America
- 5.3.2. Europe
- 5.3.3. Asia Pacific
- 5.3.4. Middle East and Africa
- 5.3.5. South America
- 5.1. Market Analysis, Insights and Forecast - by Product
- 6. North America Autosampler Market Analysis, Insights and Forecast, 2019-2031
- 6.1. Market Analysis, Insights and Forecast - by Product
- 6.1.1. Systems
- 6.1.1.1. Liquid Chromatography Autosamplers
- 6.1.1.2. Gas Chromatography Autosamplers
- 6.1.2. Accessories
- 6.1.1. Systems
- 6.2. Market Analysis, Insights and Forecast - by End-User
- 6.2.1. Pharmaceutical and Biopharmaceutical Companies
- 6.2.2. Food and Beverage Industry
- 6.2.3. Environmental Testing Industry
- 6.2.4. Others
- 6.1. Market Analysis, Insights and Forecast - by Product
- 7. Europe Autosampler Market Analysis, Insights and Forecast, 2019-2031
- 7.1. Market Analysis, Insights and Forecast - by Product
- 7.1.1. Systems
- 7.1.1.1. Liquid Chromatography Autosamplers
- 7.1.1.2. Gas Chromatography Autosamplers
- 7.1.2. Accessories
- 7.1.1. Systems
- 7.2. Market Analysis, Insights and Forecast - by End-User
- 7.2.1. Pharmaceutical and Biopharmaceutical Companies
- 7.2.2. Food and Beverage Industry
- 7.2.3. Environmental Testing Industry
- 7.2.4. Others
- 7.1. Market Analysis, Insights and Forecast - by Product
- 8. Asia Pacific Autosampler Market Analysis, Insights and Forecast, 2019-2031
- 8.1. Market Analysis, Insights and Forecast - by Product
- 8.1.1. Systems
- 8.1.1.1. Liquid Chromatography Autosamplers
- 8.1.1.2. Gas Chromatography Autosamplers
- 8.1.2. Accessories
- 8.1.1. Systems
- 8.2. Market Analysis, Insights and Forecast - by End-User
- 8.2.1. Pharmaceutical and Biopharmaceutical Companies
- 8.2.2. Food and Beverage Industry
- 8.2.3. Environmental Testing Industry
- 8.2.4. Others
- 8.1. Market Analysis, Insights and Forecast - by Product
- 9. Middle East and Africa Autosampler Market Analysis, Insights and Forecast, 2019-2031
- 9.1. Market Analysis, Insights and Forecast - by Product
- 9.1.1. Systems
- 9.1.1.1. Liquid Chromatography Autosamplers
- 9.1.1.2. Gas Chromatography Autosamplers
- 9.1.2. Accessories
- 9.1.1. Systems
- 9.2. Market Analysis, Insights and Forecast - by End-User
- 9.2.1. Pharmaceutical and Biopharmaceutical Companies
- 9.2.2. Food and Beverage Industry
- 9.2.3. Environmental Testing Industry
- 9.2.4. Others
- 9.1. Market Analysis, Insights and Forecast - by Product
- 10. South America Autosampler Market Analysis, Insights and Forecast, 2019-2031
- 10.1. Market Analysis, Insights and Forecast - by Product
- 10.1.1. Systems
- 10.1.1.1. Liquid Chromatography Autosamplers
- 10.1.1.2. Gas Chromatography Autosamplers
- 10.1.2. Accessories
- 10.1.1. Systems
- 10.2. Market Analysis, Insights and Forecast - by End-User
- 10.2.1. Pharmaceutical and Biopharmaceutical Companies
- 10.2.2. Food and Beverage Industry
- 10.2.3. Environmental Testing Industry
- 10.2.4. Others
- 10.1. Market Analysis, Insights and Forecast - by Product
- 11. North America Autosampler Market Analysis, Insights and Forecast, 2019-2031
- 11.1. Market Analysis, Insights and Forecast - By Country/Sub-region
- 11.1.1 United States
- 11.1.2 Canada
- 11.1.3 Mexico
- 12. Europe Autosampler Market Analysis, Insights and Forecast, 2019-2031
- 12.1. Market Analysis, Insights and Forecast - By Country/Sub-region
- 12.1.1 Germany
- 12.1.2 United Kingdom
- 12.1.3 France
- 12.1.4 Italy
- 12.1.5 Spain
- 12.1.6 Rest of Europe
- 13. Asia Pacific Autosampler Market Analysis, Insights and Forecast, 2019-2031
- 13.1. Market Analysis, Insights and Forecast - By Country/Sub-region
- 13.1.1 China
- 13.1.2 Japan
- 13.1.3 India
- 13.1.4 Australia
- 13.1.5 South Korea
- 13.1.6 Rest of Asia Pacific
- 14. Middle East and Africa Autosampler Market Analysis, Insights and Forecast, 2019-2031
- 14.1. Market Analysis, Insights and Forecast - By Country/Sub-region
- 14.1.1 GCC
- 14.1.2 South Africa
- 14.1.3 Rest of Middle East and Africa
- 15. South America Autosampler Market Analysis, Insights and Forecast, 2019-2031
- 15.1. Market Analysis, Insights and Forecast - By Country/Sub-region
- 15.1.1 Brazil
- 15.1.2 Argentina
- 15.1.3 Rest of South America
- 16. Competitive Analysis
- 16.1. Global Market Share Analysis 2024
- 16.2. Company Profiles
- 16.2.1 Restek Corporation
- 16.2.1.1. Overview
- 16.2.1.2. Products
- 16.2.1.3. SWOT Analysis
- 16.2.1.4. Recent Developments
- 16.2.1.5. Financials (Based on Availability)
- 16.2.2 Bio-Rad Laboratories Inc
- 16.2.2.1. Overview
- 16.2.2.2. Products
- 16.2.2.3. SWOT Analysis
- 16.2.2.4. Recent Developments
- 16.2.2.5. Financials (Based on Availability)
- 16.2.3 Waters Corporation
- 16.2.3.1. Overview
- 16.2.3.2. Products
- 16.2.3.3. SWOT Analysis
- 16.2.3.4. Recent Developments
- 16.2.3.5. Financials (Based on Availability)
- 16.2.4 Agilent Technologies Inc
- 16.2.4.1. Overview
- 16.2.4.2. Products
- 16.2.4.3. SWOT Analysis
- 16.2.4.4. Recent Developments
- 16.2.4.5. Financials (Based on Availability)
- 16.2.5 PerkinElmer Inc
- 16.2.5.1. Overview
- 16.2.5.2. Products
- 16.2.5.3. SWOT Analysis
- 16.2.5.4. Recent Developments
- 16.2.5.5. Financials (Based on Availability)
- 16.2.6 Scion Instruments
- 16.2.6.1. Overview
- 16.2.6.2. Products
- 16.2.6.3. SWOT Analysis
- 16.2.6.4. Recent Developments
- 16.2.6.5. Financials (Based on Availability)
- 16.2.7 Gilson Inc
- 16.2.7.1. Overview
- 16.2.7.2. Products
- 16.2.7.3. SWOT Analysis
- 16.2.7.4. Recent Developments
- 16.2.7.5. Financials (Based on Availability)
- 16.2.8 Thermo Fisher Scientific
- 16.2.8.1. Overview
- 16.2.8.2. Products
- 16.2.8.3. SWOT Analysis
- 16.2.8.4. Recent Developments
- 16.2.8.5. Financials (Based on Availability)
- 16.2.9 Shimadzu Corporation
- 16.2.9.1. Overview
- 16.2.9.2. Products
- 16.2.9.3. SWOT Analysis
- 16.2.9.4. Recent Developments
- 16.2.9.5. Financials (Based on Availability)
- 16.2.1 Restek Corporation
List of Figures
- Figure 1: Global Autosampler Market Revenue Breakdown (Million, %) by Region 2024 & 2032
- Figure 2: Global Autosampler Market Volume Breakdown (K Unit, %) by Region 2024 & 2032
- Figure 3: North America Autosampler Market Revenue (Million), by Country 2024 & 2032
- Figure 4: North America Autosampler Market Volume (K Unit), by Country 2024 & 2032
- Figure 5: North America Autosampler Market Revenue Share (%), by Country 2024 & 2032
- Figure 6: North America Autosampler Market Volume Share (%), by Country 2024 & 2032
- Figure 7: Europe Autosampler Market Revenue (Million), by Country 2024 & 2032
- Figure 8: Europe Autosampler Market Volume (K Unit), by Country 2024 & 2032
- Figure 9: Europe Autosampler Market Revenue Share (%), by Country 2024 & 2032
- Figure 10: Europe Autosampler Market Volume Share (%), by Country 2024 & 2032
- Figure 11: Asia Pacific Autosampler Market Revenue (Million), by Country 2024 & 2032
- Figure 12: Asia Pacific Autosampler Market Volume (K Unit), by Country 2024 & 2032
- Figure 13: Asia Pacific Autosampler Market Revenue Share (%), by Country 2024 & 2032
- Figure 14: Asia Pacific Autosampler Market Volume Share (%), by Country 2024 & 2032
- Figure 15: Middle East and Africa Autosampler Market Revenue (Million), by Country 2024 & 2032
- Figure 16: Middle East and Africa Autosampler Market Volume (K Unit), by Country 2024 & 2032
- Figure 17: Middle East and Africa Autosampler Market Revenue Share (%), by Country 2024 & 2032
- Figure 18: Middle East and Africa Autosampler Market Volume Share (%), by Country 2024 & 2032
- Figure 19: South America Autosampler Market Revenue (Million), by Country 2024 & 2032
- Figure 20: South America Autosampler Market Volume (K Unit), by Country 2024 & 2032
- Figure 21: South America Autosampler Market Revenue Share (%), by Country 2024 & 2032
- Figure 22: South America Autosampler Market Volume Share (%), by Country 2024 & 2032
- Figure 23: North America Autosampler Market Revenue (Million), by Product 2024 & 2032
- Figure 24: North America Autosampler Market Volume (K Unit), by Product 2024 & 2032
- Figure 25: North America Autosampler Market Revenue Share (%), by Product 2024 & 2032
- Figure 26: North America Autosampler Market Volume Share (%), by Product 2024 & 2032
- Figure 27: North America Autosampler Market Revenue (Million), by End-User 2024 & 2032
- Figure 28: North America Autosampler Market Volume (K Unit), by End-User 2024 & 2032
- Figure 29: North America Autosampler Market Revenue Share (%), by End-User 2024 & 2032
- Figure 30: North America Autosampler Market Volume Share (%), by End-User 2024 & 2032
- Figure 31: North America Autosampler Market Revenue (Million), by Country 2024 & 2032
- Figure 32: North America Autosampler Market Volume (K Unit), by Country 2024 & 2032
- Figure 33: North America Autosampler Market Revenue Share (%), by Country 2024 & 2032
- Figure 34: North America Autosampler Market Volume Share (%), by Country 2024 & 2032
- Figure 35: Europe Autosampler Market Revenue (Million), by Product 2024 & 2032
- Figure 36: Europe Autosampler Market Volume (K Unit), by Product 2024 & 2032
- Figure 37: Europe Autosampler Market Revenue Share (%), by Product 2024 & 2032
- Figure 38: Europe Autosampler Market Volume Share (%), by Product 2024 & 2032
- Figure 39: Europe Autosampler Market Revenue (Million), by End-User 2024 & 2032
- Figure 40: Europe Autosampler Market Volume (K Unit), by End-User 2024 & 2032
- Figure 41: Europe Autosampler Market Revenue Share (%), by End-User 2024 & 2032
- Figure 42: Europe Autosampler Market Volume Share (%), by End-User 2024 & 2032
- Figure 43: Europe Autosampler Market Revenue (Million), by Country 2024 & 2032
- Figure 44: Europe Autosampler Market Volume (K Unit), by Country 2024 & 2032
- Figure 45: Europe Autosampler Market Revenue Share (%), by Country 2024 & 2032
- Figure 46: Europe Autosampler Market Volume Share (%), by Country 2024 & 2032
- Figure 47: Asia Pacific Autosampler Market Revenue (Million), by Product 2024 & 2032
- Figure 48: Asia Pacific Autosampler Market Volume (K Unit), by Product 2024 & 2032
- Figure 49: Asia Pacific Autosampler Market Revenue Share (%), by Product 2024 & 2032
- Figure 50: Asia Pacific Autosampler Market Volume Share (%), by Product 2024 & 2032
- Figure 51: Asia Pacific Autosampler Market Revenue (Million), by End-User 2024 & 2032
- Figure 52: Asia Pacific Autosampler Market Volume (K Unit), by End-User 2024 & 2032
- Figure 53: Asia Pacific Autosampler Market Revenue Share (%), by End-User 2024 & 2032
- Figure 54: Asia Pacific Autosampler Market Volume Share (%), by End-User 2024 & 2032
- Figure 55: Asia Pacific Autosampler Market Revenue (Million), by Country 2024 & 2032
- Figure 56: Asia Pacific Autosampler Market Volume (K Unit), by Country 2024 & 2032
- Figure 57: Asia Pacific Autosampler Market Revenue Share (%), by Country 2024 & 2032
- Figure 58: Asia Pacific Autosampler Market Volume Share (%), by Country 2024 & 2032
- Figure 59: Middle East and Africa Autosampler Market Revenue (Million), by Product 2024 & 2032
- Figure 60: Middle East and Africa Autosampler Market Volume (K Unit), by Product 2024 & 2032
- Figure 61: Middle East and Africa Autosampler Market Revenue Share (%), by Product 2024 & 2032
- Figure 62: Middle East and Africa Autosampler Market Volume Share (%), by Product 2024 & 2032
- Figure 63: Middle East and Africa Autosampler Market Revenue (Million), by End-User 2024 & 2032
- Figure 64: Middle East and Africa Autosampler Market Volume (K Unit), by End-User 2024 & 2032
- Figure 65: Middle East and Africa Autosampler Market Revenue Share (%), by End-User 2024 & 2032
- Figure 66: Middle East and Africa Autosampler Market Volume Share (%), by End-User 2024 & 2032
- Figure 67: Middle East and Africa Autosampler Market Revenue (Million), by Country 2024 & 2032
- Figure 68: Middle East and Africa Autosampler Market Volume (K Unit), by Country 2024 & 2032
- Figure 69: Middle East and Africa Autosampler Market Revenue Share (%), by Country 2024 & 2032
- Figure 70: Middle East and Africa Autosampler Market Volume Share (%), by Country 2024 & 2032
- Figure 71: South America Autosampler Market Revenue (Million), by Product 2024 & 2032
- Figure 72: South America Autosampler Market Volume (K Unit), by Product 2024 & 2032
- Figure 73: South America Autosampler Market Revenue Share (%), by Product 2024 & 2032
- Figure 74: South America Autosampler Market Volume Share (%), by Product 2024 & 2032
- Figure 75: South America Autosampler Market Revenue (Million), by End-User 2024 & 2032
- Figure 76: South America Autosampler Market Volume (K Unit), by End-User 2024 & 2032
- Figure 77: South America Autosampler Market Revenue Share (%), by End-User 2024 & 2032
- Figure 78: South America Autosampler Market Volume Share (%), by End-User 2024 & 2032
- Figure 79: South America Autosampler Market Revenue (Million), by Country 2024 & 2032
- Figure 80: South America Autosampler Market Volume (K Unit), by Country 2024 & 2032
- Figure 81: South America Autosampler Market Revenue Share (%), by Country 2024 & 2032
- Figure 82: South America Autosampler Market Volume Share (%), by Country 2024 & 2032
List of Tables
- Table 1: Global Autosampler Market Revenue Million Forecast, by Region 2019 & 2032
- Table 2: Global Autosampler Market Volume K Unit Forecast, by Region 2019 & 2032
- Table 3: Global Autosampler Market Revenue Million Forecast, by Product 2019 & 2032
- Table 4: Global Autosampler Market Volume K Unit Forecast, by Product 2019 & 2032
- Table 5: Global Autosampler Market Revenue Million Forecast, by End-User 2019 & 2032
- Table 6: Global Autosampler Market Volume K Unit Forecast, by End-User 2019 & 2032
- Table 7: Global Autosampler Market Revenue Million Forecast, by Region 2019 & 2032
- Table 8: Global Autosampler Market Volume K Unit Forecast, by Region 2019 & 2032
- Table 9: Global Autosampler Market Revenue Million Forecast, by Country 2019 & 2032
- Table 10: Global Autosampler Market Volume K Unit Forecast, by Country 2019 & 2032
- Table 11: United States Autosampler Market Revenue (Million) Forecast, by Application 2019 & 2032
- Table 12: United States Autosampler Market Volume (K Unit) Forecast, by Application 2019 & 2032
- Table 13: Canada Autosampler Market Revenue (Million) Forecast, by Application 2019 & 2032
- Table 14: Canada Autosampler Market Volume (K Unit) Forecast, by Application 2019 & 2032
- Table 15: Mexico Autosampler Market Revenue (Million) Forecast, by Application 2019 & 2032
- Table 16: Mexico Autosampler Market Volume (K Unit) Forecast, by Application 2019 & 2032
- Table 17: Global Autosampler Market Revenue Million Forecast, by Country 2019 & 2032
- Table 18: Global Autosampler Market Volume K Unit Forecast, by Country 2019 & 2032
- Table 19: Germany Autosampler Market Revenue (Million) Forecast, by Application 2019 & 2032
- Table 20: Germany Autosampler Market Volume (K Unit) Forecast, by Application 2019 & 2032
- Table 21: United Kingdom Autosampler Market Revenue (Million) Forecast, by Application 2019 & 2032
- Table 22: United Kingdom Autosampler Market Volume (K Unit) Forecast, by Application 2019 & 2032
- Table 23: France Autosampler Market Revenue (Million) Forecast, by Application 2019 & 2032
- Table 24: France Autosampler Market Volume (K Unit) Forecast, by Application 2019 & 2032
- Table 25: Italy Autosampler Market Revenue (Million) Forecast, by Application 2019 & 2032
- Table 26: Italy Autosampler Market Volume (K Unit) Forecast, by Application 2019 & 2032
- Table 27: Spain Autosampler Market Revenue (Million) Forecast, by Application 2019 & 2032
- Table 28: Spain Autosampler Market Volume (K Unit) Forecast, by Application 2019 & 2032
- Table 29: Rest of Europe Autosampler Market Revenue (Million) Forecast, by Application 2019 & 2032
- Table 30: Rest of Europe Autosampler Market Volume (K Unit) Forecast, by Application 2019 & 2032
- Table 31: Global Autosampler Market Revenue Million Forecast, by Country 2019 & 2032
- Table 32: Global Autosampler Market Volume K Unit Forecast, by Country 2019 & 2032
- Table 33: China Autosampler Market Revenue (Million) Forecast, by Application 2019 & 2032
- Table 34: China Autosampler Market Volume (K Unit) Forecast, by Application 2019 & 2032
- Table 35: Japan Autosampler Market Revenue (Million) Forecast, by Application 2019 & 2032
- Table 36: Japan Autosampler Market Volume (K Unit) Forecast, by Application 2019 & 2032
- Table 37: India Autosampler Market Revenue (Million) Forecast, by Application 2019 & 2032
- Table 38: India Autosampler Market Volume (K Unit) Forecast, by Application 2019 & 2032
- Table 39: Australia Autosampler Market Revenue (Million) Forecast, by Application 2019 & 2032
- Table 40: Australia Autosampler Market Volume (K Unit) Forecast, by Application 2019 & 2032
- Table 41: South Korea Autosampler Market Revenue (Million) Forecast, by Application 2019 & 2032
- Table 42: South Korea Autosampler Market Volume (K Unit) Forecast, by Application 2019 & 2032
- Table 43: Rest of Asia Pacific Autosampler Market Revenue (Million) Forecast, by Application 2019 & 2032
- Table 44: Rest of Asia Pacific Autosampler Market Volume (K Unit) Forecast, by Application 2019 & 2032
- Table 45: Global Autosampler Market Revenue Million Forecast, by Country 2019 & 2032
- Table 46: Global Autosampler Market Volume K Unit Forecast, by Country 2019 & 2032
- Table 47: GCC Autosampler Market Revenue (Million) Forecast, by Application 2019 & 2032
- Table 48: GCC Autosampler Market Volume (K Unit) Forecast, by Application 2019 & 2032
- Table 49: South Africa Autosampler Market Revenue (Million) Forecast, by Application 2019 & 2032
- Table 50: South Africa Autosampler Market Volume (K Unit) Forecast, by Application 2019 & 2032
- Table 51: Rest of Middle East and Africa Autosampler Market Revenue (Million) Forecast, by Application 2019 & 2032
- Table 52: Rest of Middle East and Africa Autosampler Market Volume (K Unit) Forecast, by Application 2019 & 2032
- Table 53: Global Autosampler Market Revenue Million Forecast, by Country 2019 & 2032
- Table 54: Global Autosampler Market Volume K Unit Forecast, by Country 2019 & 2032
- Table 55: Brazil Autosampler Market Revenue (Million) Forecast, by Application 2019 & 2032
- Table 56: Brazil Autosampler Market Volume (K Unit) Forecast, by Application 2019 & 2032
- Table 57: Argentina Autosampler Market Revenue (Million) Forecast, by Application 2019 & 2032
- Table 58: Argentina Autosampler Market Volume (K Unit) Forecast, by Application 2019 & 2032
- Table 59: Rest of South America Autosampler Market Revenue (Million) Forecast, by Application 2019 & 2032
- Table 60: Rest of South America Autosampler Market Volume (K Unit) Forecast, by Application 2019 & 2032
- Table 61: Global Autosampler Market Revenue Million Forecast, by Product 2019 & 2032
- Table 62: Global Autosampler Market Volume K Unit Forecast, by Product 2019 & 2032
- Table 63: Global Autosampler Market Revenue Million Forecast, by End-User 2019 & 2032
- Table 64: Global Autosampler Market Volume K Unit Forecast, by End-User 2019 & 2032
- Table 65: Global Autosampler Market Revenue Million Forecast, by Country 2019 & 2032
- Table 66: Global Autosampler Market Volume K Unit Forecast, by Country 2019 & 2032
- Table 67: United States Autosampler Market Revenue (Million) Forecast, by Application 2019 & 2032
- Table 68: United States Autosampler Market Volume (K Unit) Forecast, by Application 2019 & 2032
- Table 69: Canada Autosampler Market Revenue (Million) Forecast, by Application 2019 & 2032
- Table 70: Canada Autosampler Market Volume (K Unit) Forecast, by Application 2019 & 2032
- Table 71: Mexico Autosampler Market Revenue (Million) Forecast, by Application 2019 & 2032
- Table 72: Mexico Autosampler Market Volume (K Unit) Forecast, by Application 2019 & 2032
- Table 73: Global Autosampler Market Revenue Million Forecast, by Product 2019 & 2032
- Table 74: Global Autosampler Market Volume K Unit Forecast, by Product 2019 & 2032
- Table 75: Global Autosampler Market Revenue Million Forecast, by End-User 2019 & 2032
- Table 76: Global Autosampler Market Volume K Unit Forecast, by End-User 2019 & 2032
- Table 77: Global Autosampler Market Revenue Million Forecast, by Country 2019 & 2032
- Table 78: Global Autosampler Market Volume K Unit Forecast, by Country 2019 & 2032
- Table 79: Germany Autosampler Market Revenue (Million) Forecast, by Application 2019 & 2032
- Table 80: Germany Autosampler Market Volume (K Unit) Forecast, by Application 2019 & 2032
- Table 81: United Kingdom Autosampler Market Revenue (Million) Forecast, by Application 2019 & 2032
- Table 82: United Kingdom Autosampler Market Volume (K Unit) Forecast, by Application 2019 & 2032
- Table 83: France Autosampler Market Revenue (Million) Forecast, by Application 2019 & 2032
- Table 84: France Autosampler Market Volume (K Unit) Forecast, by Application 2019 & 2032
- Table 85: Italy Autosampler Market Revenue (Million) Forecast, by Application 2019 & 2032
- Table 86: Italy Autosampler Market Volume (K Unit) Forecast, by Application 2019 & 2032
- Table 87: Spain Autosampler Market Revenue (Million) Forecast, by Application 2019 & 2032
- Table 88: Spain Autosampler Market Volume (K Unit) Forecast, by Application 2019 & 2032
- Table 89: Rest of Europe Autosampler Market Revenue (Million) Forecast, by Application 2019 & 2032
- Table 90: Rest of Europe Autosampler Market Volume (K Unit) Forecast, by Application 2019 & 2032
- Table 91: Global Autosampler Market Revenue Million Forecast, by Product 2019 & 2032
- Table 92: Global Autosampler Market Volume K Unit Forecast, by Product 2019 & 2032
- Table 93: Global Autosampler Market Revenue Million Forecast, by End-User 2019 & 2032
- Table 94: Global Autosampler Market Volume K Unit Forecast, by End-User 2019 & 2032
- Table 95: Global Autosampler Market Revenue Million Forecast, by Country 2019 & 2032
- Table 96: Global Autosampler Market Volume K Unit Forecast, by Country 2019 & 2032
- Table 97: China Autosampler Market Revenue (Million) Forecast, by Application 2019 & 2032
- Table 98: China Autosampler Market Volume (K Unit) Forecast, by Application 2019 & 2032
- Table 99: Japan Autosampler Market Revenue (Million) Forecast, by Application 2019 & 2032
- Table 100: Japan Autosampler Market Volume (K Unit) Forecast, by Application 2019 & 2032
- Table 101: India Autosampler Market Revenue (Million) Forecast, by Application 2019 & 2032
- Table 102: India Autosampler Market Volume (K Unit) Forecast, by Application 2019 & 2032
- Table 103: Australia Autosampler Market Revenue (Million) Forecast, by Application 2019 & 2032
- Table 104: Australia Autosampler Market Volume (K Unit) Forecast, by Application 2019 & 2032
- Table 105: South Korea Autosampler Market Revenue (Million) Forecast, by Application 2019 & 2032
- Table 106: South Korea Autosampler Market Volume (K Unit) Forecast, by Application 2019 & 2032
- Table 107: Rest of Asia Pacific Autosampler Market Revenue (Million) Forecast, by Application 2019 & 2032
- Table 108: Rest of Asia Pacific Autosampler Market Volume (K Unit) Forecast, by Application 2019 & 2032
- Table 109: Global Autosampler Market Revenue Million Forecast, by Product 2019 & 2032
- Table 110: Global Autosampler Market Volume K Unit Forecast, by Product 2019 & 2032
- Table 111: Global Autosampler Market Revenue Million Forecast, by End-User 2019 & 2032
- Table 112: Global Autosampler Market Volume K Unit Forecast, by End-User 2019 & 2032
- Table 113: Global Autosampler Market Revenue Million Forecast, by Country 2019 & 2032
- Table 114: Global Autosampler Market Volume K Unit Forecast, by Country 2019 & 2032
- Table 115: GCC Autosampler Market Revenue (Million) Forecast, by Application 2019 & 2032
- Table 116: GCC Autosampler Market Volume (K Unit) Forecast, by Application 2019 & 2032
- Table 117: South Africa Autosampler Market Revenue (Million) Forecast, by Application 2019 & 2032
- Table 118: South Africa Autosampler Market Volume (K Unit) Forecast, by Application 2019 & 2032
- Table 119: Rest of Middle East and Africa Autosampler Market Revenue (Million) Forecast, by Application 2019 & 2032
- Table 120: Rest of Middle East and Africa Autosampler Market Volume (K Unit) Forecast, by Application 2019 & 2032
- Table 121: Global Autosampler Market Revenue Million Forecast, by Product 2019 & 2032
- Table 122: Global Autosampler Market Volume K Unit Forecast, by Product 2019 & 2032
- Table 123: Global Autosampler Market Revenue Million Forecast, by End-User 2019 & 2032
- Table 124: Global Autosampler Market Volume K Unit Forecast, by End-User 2019 & 2032
- Table 125: Global Autosampler Market Revenue Million Forecast, by Country 2019 & 2032
- Table 126: Global Autosampler Market Volume K Unit Forecast, by Country 2019 & 2032
- Table 127: Brazil Autosampler Market Revenue (Million) Forecast, by Application 2019 & 2032
- Table 128: Brazil Autosampler Market Volume (K Unit) Forecast, by Application 2019 & 2032
- Table 129: Argentina Autosampler Market Revenue (Million) Forecast, by Application 2019 & 2032
- Table 130: Argentina Autosampler Market Volume (K Unit) Forecast, by Application 2019 & 2032
- Table 131: Rest of South America Autosampler Market Revenue (Million) Forecast, by Application 2019 & 2032
- Table 132: Rest of South America Autosampler Market Volume (K Unit) Forecast, by Application 2019 & 2032
Frequently Asked Questions
1. What is the projected Compound Annual Growth Rate (CAGR) of the Autosampler Market?
The projected CAGR is approximately 7.05%.
2. Which companies are prominent players in the Autosampler Market?
Key companies in the market include Restek Corporation, Bio-Rad Laboratories Inc, Waters Corporation, Agilent Technologies Inc, PerkinElmer Inc, Scion Instruments, Gilson Inc, Thermo Fisher Scientific, Shimadzu Corporation.
3. What are the main segments of the Autosampler Market?
The market segments include Product, End-User.
4. Can you provide details about the market size?
The market size is estimated to be USD 1.42 Million as of 2022.
5. What are some drivers contributing to market growth?
Various Advantages of Autosamplers Coupled with Growing Importance of Chromatography in Drug Approval; Increasing Food Safety Concerns.
6. What are the notable trends driving market growth?
Pharmaceutical and Biotechnology Companies are Expected to Witness High Growth Over the Forecast Period.
7. Are there any restraints impacting market growth?
Lack of Skilled Professionals; Limitations in Budget of Small and Mid-Size Market Players.
8. Can you provide examples of recent developments in the market?
In May 2022, Agilent Technologies Inc. collaborated with APC Ltd., committing to work towards combining their technologies to provide unique workflows to customers that support automated process analysis via liquid chromatography (LC).
9. What pricing options are available for accessing the report?
Pricing options include single-user, multi-user, and enterprise licenses priced at USD 4750, USD 5250, and USD 8750 respectively.
10. Is the market size provided in terms of value or volume?
The market size is provided in terms of value, measured in Million and volume, measured in K Unit.
11. Are there any specific market keywords associated with the report?
Yes, the market keyword associated with the report is "Autosampler Market," which aids in identifying and referencing the specific market segment covered.
12. How do I determine which pricing option suits my needs best?
The pricing options vary based on user requirements and access needs. Individual users may opt for single-user licenses, while businesses requiring broader access may choose multi-user or enterprise licenses for cost-effective access to the report.
13. Are there any additional resources or data provided in the Autosampler Market report?
While the report offers comprehensive insights, it's advisable to review the specific contents or supplementary materials provided to ascertain if additional resources or data are available.
14. How can I stay updated on further developments or reports in the Autosampler Market?
To stay informed about further developments, trends, and reports in the Autosampler Market, consider subscribing to industry newsletters, following relevant companies and organizations, or regularly checking reputable industry news sources and publications.
Methodology
Step 1 - Identification of Relevant Samples Size from Population Database


Step 2 - Approaches for Defining Global Market Size (Value, Volume* & Price*)

Note*: In applicable scenarios
Step 3 - Data Sources
Primary Research
- Web Analytics
- Survey Reports
- Research Institute
- Latest Research Reports
- Opinion Leaders
Secondary Research
- Annual Reports
- White Paper
- Latest Press Release
- Industry Association
- Paid Database
- Investor Presentations

Step 4 - Data Triangulation
Involves using different sources of information in order to increase the validity of a study
These sources are likely to be stakeholders in a program - participants, other researchers, program staff, other community members, and so on.
Then we put all data in single framework & apply various statistical tools to find out the dynamic on the market.
During the analysis stage, feedback from the stakeholder groups would be compared to determine areas of agreement as well as areas of divergence
