

Key Insights
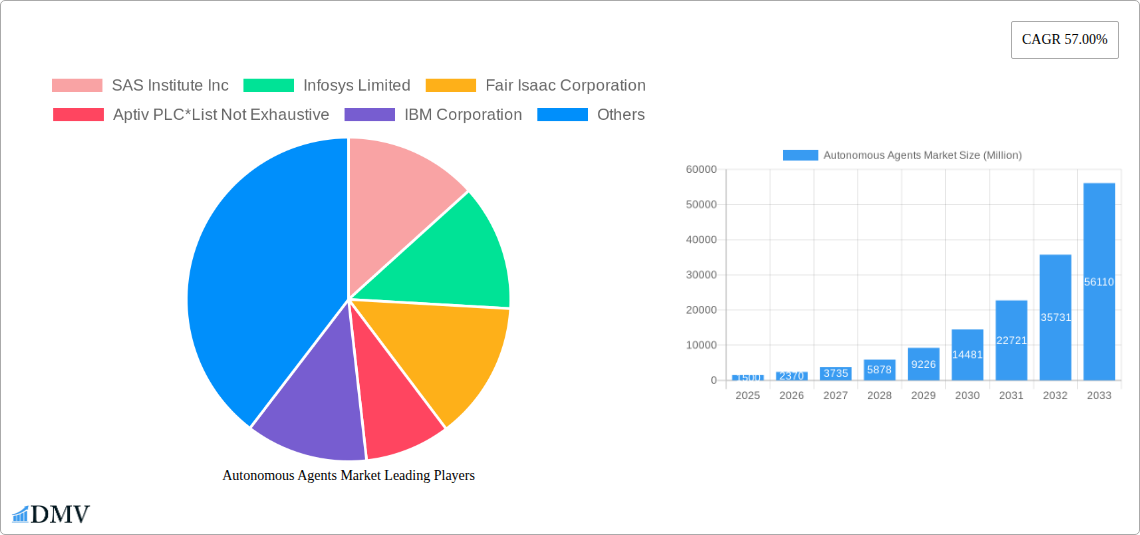
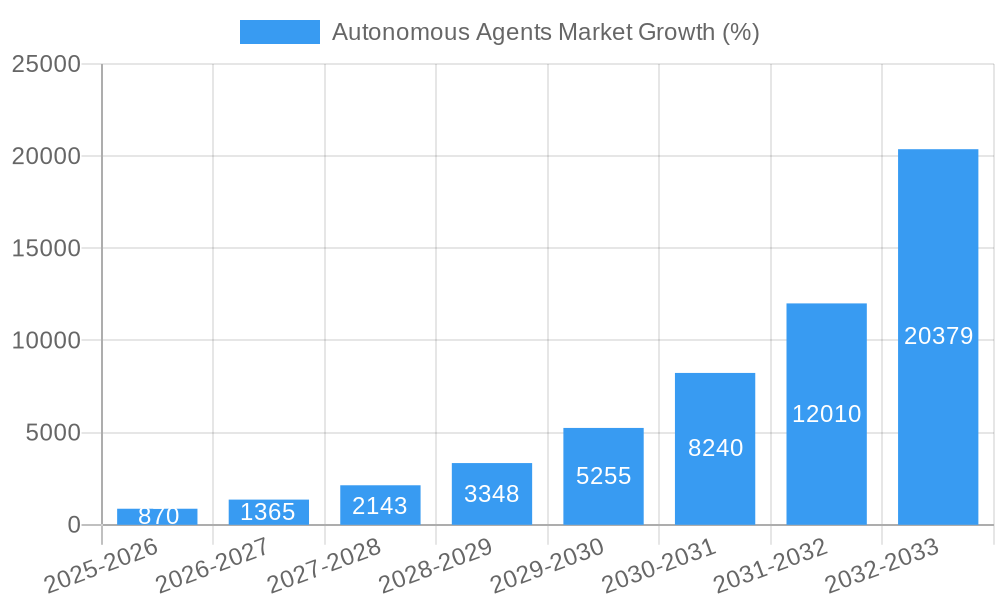
The Autonomous Agents market is experiencing explosive growth, projected to reach a substantial size with a remarkable Compound Annual Growth Rate (CAGR) of 57% between 2025 and 2033. This rapid expansion is driven by several key factors. The increasing adoption of cloud computing offers scalable and cost-effective solutions for deploying and managing autonomous agents. Simultaneously, the burgeoning need for automation across diverse sectors, including BFSI (Banking, Financial Services, and Insurance), IT & Telecom, Healthcare, Manufacturing, and Transportation & Mobility, is fueling demand. Large enterprises are leading the adoption, leveraging autonomous agents to optimize operations, improve decision-making, and enhance customer experiences. However, concerns surrounding data security, the need for robust regulatory frameworks, and the complexity of integrating these agents into existing systems present challenges that need to be addressed for sustained market growth.
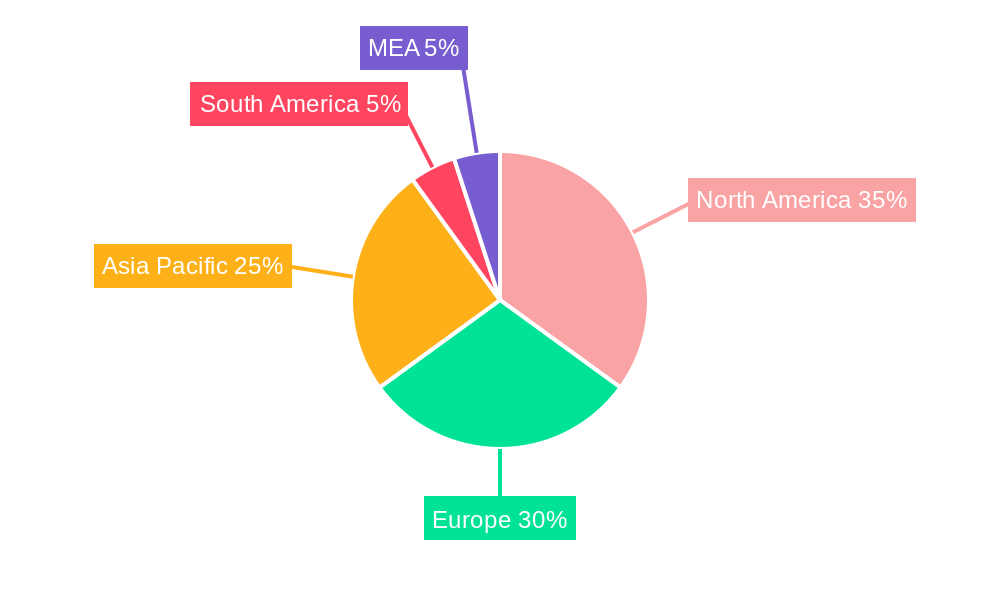
The market segmentation reveals interesting dynamics. While cloud deployment is currently dominant, the on-premises segment is expected to witness growth driven by specific industry needs for data security and control. Large enterprises are investing heavily in autonomous agent technologies, but the SME segment is poised for significant expansion as the technology becomes more accessible and cost-effective. Geographically, North America and Europe are currently leading the market, but the Asia-Pacific region is anticipated to demonstrate the fastest growth due to increasing technological adoption and investments in digital transformation. Key players like SAS Institute, Infosys, Fair Isaac, IBM, Google, and others are actively shaping the market landscape through innovation and strategic partnerships, further accelerating the adoption of this transformative technology. The continuous development of advanced algorithms and machine learning capabilities will be crucial in overcoming existing limitations and unlocking the full potential of autonomous agents across a wider range of applications.
Autonomous Agents Market: A Comprehensive Report (2019-2033)
This insightful report provides a detailed analysis of the Autonomous Agents Market, offering a comprehensive overview of its current state, future trajectory, and key players. With a study period spanning 2019-2033, a base year of 2025, and an estimated year of 2025, this report offers crucial insights for stakeholders seeking to understand and capitalize on this rapidly evolving market, projected to reach xx Million by 2033.
Autonomous Agents Market Market Composition & Trends
This section delves into the competitive landscape of the Autonomous Agents market, evaluating market concentration, innovation drivers, regulatory hurdles, substitute products, end-user preferences, and mergers and acquisitions (M&A) activity. We analyze market share distribution amongst key players, revealing a moderately concentrated market with several dominant players holding significant shares. M&A activity is analyzed, with estimated deal values reaching xx Million in the past five years, showcasing strategic consolidation within the industry. Innovation is driven primarily by advancements in AI, machine learning, and natural language processing. Regulatory landscapes vary across regions, impacting adoption rates and market growth. Substitute products, such as rule-based systems, pose a competitive threat, though the advantages of autonomous agents in terms of adaptability and efficiency are significant. Finally, the report profiles end-users across various industry verticals, highlighting their specific needs and adoption patterns.
- Market Concentration: Moderately concentrated, with top 5 players holding xx% market share (2024).
- M&A Deal Value (2019-2024): Approximately xx Million.
- Key Innovation Drivers: AI, Machine Learning, Natural Language Processing.
- Major Regulatory Influences: GDPR, CCPA, other regional regulations.
Autonomous Agents Market Industry Evolution
This section analyzes the historical and projected growth trajectories of the Autonomous Agents market (2019-2033). The market has experienced substantial growth, driven by increasing adoption across various sectors. Technological advancements, particularly in AI and machine learning, have significantly enhanced the capabilities and applicability of autonomous agents. Shifting consumer demands for personalized and automated services are further fueling market expansion. We project a Compound Annual Growth Rate (CAGR) of xx% during the forecast period (2025-2033), with significant growth in specific segments like cloud-based deployments and large enterprise adoption. The report also details the evolving technological landscape, including the emergence of new architectures and functionalities that are transforming the market. The increasing availability of large datasets for training and the development of more robust and explainable AI models are driving significant growth and improving accuracy. The growing demand for automation across various industries, coupled with decreasing implementation costs, is significantly contributing to this expansion.
Leading Regions, Countries, or Segments in Autonomous Agents Market
This section identifies the dominant regions, countries, and segments within the Autonomous Agents market. North America currently holds the largest market share, followed by Europe and Asia-Pacific. The cloud deployment model is experiencing the fastest growth, driven by scalability and cost-effectiveness. Large enterprises are the primary adopters, owing to their greater resources and technological capabilities. The BFSI (Banking, Financial Services, and Insurance) and IT & Telecom sectors are currently leading in adoption, followed by Healthcare and Manufacturing.
- Dominant Region: North America
- Fastest-Growing Segment (Deployment): Cloud
- Primary Adopting Organization Size: Large Enterprises
- Leading Industry Vertical: BFSI
Key Drivers:
- North America: High technological advancements, robust IT infrastructure, early adoption of AI technologies.
- Cloud Deployment: Scalability, cost-effectiveness, ease of access.
- Large Enterprises: Greater resources, established IT departments, higher tolerance for risk.
- BFSI: High demand for automation in processes like fraud detection, customer service, and risk management.
Autonomous Agents Market Product Innovations
Recent innovations in autonomous agents include the development of more sophisticated algorithms enabling improved decision-making, enhanced natural language processing capabilities for more seamless human-agent interaction, and the integration of advanced analytics for deeper insights. These advancements have led to the creation of more efficient and effective agents capable of handling complex tasks across a wider array of applications. Unique selling propositions include improved accuracy, reduced error rates, increased efficiency, and enhanced scalability.
Propelling Factors for Autonomous Agents Market Growth
The growth of the Autonomous Agents market is driven by several factors. Technological advancements, specifically in AI and machine learning, are continuously improving the capabilities and efficiency of these agents. The increasing demand for automation across industries to improve productivity and reduce operational costs further fuels market expansion. Supportive government regulations and policies promoting AI adoption are also contributing to growth. Furthermore, the decreasing cost of implementation makes the technology accessible to a wider range of businesses.
Obstacles in the Autonomous Agents Market Market
Despite the significant growth potential, several factors hinder market expansion. Regulatory uncertainties and concerns surrounding data privacy and security pose challenges. Supply chain disruptions can impact the availability of components crucial for autonomous agent development and deployment. Intense competition among existing players and the emergence of new entrants create a dynamic and potentially volatile market. These factors, if not addressed appropriately, could significantly slow market growth.
Future Opportunities in Autonomous Agents Market
Future opportunities abound in the Autonomous Agents market. Expansion into new and emerging markets, particularly in developing economies, presents significant potential. Technological advancements, such as the integration of quantum computing and blockchain technology, will further enhance capabilities. Moreover, emerging consumer trends, such as the demand for personalized services and enhanced user experiences, will drive innovation and adoption.
Major Players in the Autonomous Agents Market Ecosystem
- SAS Institute Inc
- Infosys Limited
- Fair Isaac Corporation
- Aptiv PLC
- IBM Corporation
- Google LLC
- Nuance Communications
- Salesforce com Inc
- Microsoft Corporation
- Affectiva Inc
- Amazon Web Services Inc
- Fetch ai
- Oracle Corporation
- Intel Corporation
- SAP SE
Key Developments in Autonomous Agents Market Industry
- 2024 Q4: Microsoft announces significant investment in AI agent development.
- 2023 Q3: Google launches a new platform for building and deploying autonomous agents.
- 2022 Q2: A major merger between two leading autonomous agent providers. (Further details on the merger would be included in the full report)
Strategic Autonomous Agents Market Market Forecast
The Autonomous Agents market is poised for continued robust growth, driven by technological innovation, increasing demand for automation, and expanding applications across various industry verticals. Future opportunities lie in leveraging emerging technologies like quantum computing and blockchain to further enhance the capabilities and security of autonomous agents. The market is expected to witness significant consolidation through mergers and acquisitions as companies compete for market share. The overall outlook for the Autonomous Agents market remains exceptionally positive, with considerable potential for expansion and innovation in the years to come.
Autonomous Agents Market Segmentation
-
1. Deployment Type
- 1.1. Cloud
- 1.2. On-Premises
-
2. Organization Size
- 2.1. Small & Medium-Sized Enterprises (SMEs)
- 2.2. Large Enterprises
-
3. Industry Vertical
- 3.1. BFSI
- 3.2. IT &Telecom
- 3.3. Healthcare
- 3.4. Manufacturing
- 3.5. Transportation & Mobility
- 3.6. Other Industry Verticals
Autonomous Agents Market Segmentation By Geography
- 1. North America
- 2. Europe
- 3. Asia Pacific
- 4. Latin America
- 5. Middle East
Autonomous Agents Market REPORT HIGHLIGHTS
| Aspects | Details |
|---|---|
| Study Period | 2019-2033 |
| Base Year | 2024 |
| Estimated Year | 2025 |
| Forecast Period | 2025-2033 |
| Historical Period | 2019-2024 |
| Growth Rate | CAGR of 57.00% from 2019-2033 |
| Segmentation |
|
Table of Contents
- 1. Introduction
- 1.1. Research Scope
- 1.2. Market Segmentation
- 1.3. Research Methodology
- 1.4. Definitions and Assumptions
- 2. Executive Summary
- 2.1. Introduction
- 3. Market Dynamics
- 3.1. Introduction
- 3.2. Market Drivers
- 3.2.1. ; Rising Number of AI Applications; Growing Presence of Parallel Computational Resources
- 3.3. Market Restrains
- 3.3.1. Maintaining the Privacy and Integrity of Patient Data
- 3.4. Market Trends
- 3.4.1. Transportation and Mobility Segments to Dominate the Market
- 4. Market Factor Analysis
- 4.1. Porters Five Forces
- 4.2. Supply/Value Chain
- 4.3. PESTEL analysis
- 4.4. Market Entropy
- 4.5. Patent/Trademark Analysis
- 5. Global Autonomous Agents Market Analysis, Insights and Forecast, 2019-2031
- 5.1. Market Analysis, Insights and Forecast - by Deployment Type
- 5.1.1. Cloud
- 5.1.2. On-Premises
- 5.2. Market Analysis, Insights and Forecast - by Organization Size
- 5.2.1. Small & Medium-Sized Enterprises (SMEs)
- 5.2.2. Large Enterprises
- 5.3. Market Analysis, Insights and Forecast - by Industry Vertical
- 5.3.1. BFSI
- 5.3.2. IT &Telecom
- 5.3.3. Healthcare
- 5.3.4. Manufacturing
- 5.3.5. Transportation & Mobility
- 5.3.6. Other Industry Verticals
- 5.4. Market Analysis, Insights and Forecast - by Region
- 5.4.1. North America
- 5.4.2. Europe
- 5.4.3. Asia Pacific
- 5.4.4. Latin America
- 5.4.5. Middle East
- 5.1. Market Analysis, Insights and Forecast - by Deployment Type
- 6. North America Autonomous Agents Market Analysis, Insights and Forecast, 2019-2031
- 6.1. Market Analysis, Insights and Forecast - by Deployment Type
- 6.1.1. Cloud
- 6.1.2. On-Premises
- 6.2. Market Analysis, Insights and Forecast - by Organization Size
- 6.2.1. Small & Medium-Sized Enterprises (SMEs)
- 6.2.2. Large Enterprises
- 6.3. Market Analysis, Insights and Forecast - by Industry Vertical
- 6.3.1. BFSI
- 6.3.2. IT &Telecom
- 6.3.3. Healthcare
- 6.3.4. Manufacturing
- 6.3.5. Transportation & Mobility
- 6.3.6. Other Industry Verticals
- 6.1. Market Analysis, Insights and Forecast - by Deployment Type
- 7. Europe Autonomous Agents Market Analysis, Insights and Forecast, 2019-2031
- 7.1. Market Analysis, Insights and Forecast - by Deployment Type
- 7.1.1. Cloud
- 7.1.2. On-Premises
- 7.2. Market Analysis, Insights and Forecast - by Organization Size
- 7.2.1. Small & Medium-Sized Enterprises (SMEs)
- 7.2.2. Large Enterprises
- 7.3. Market Analysis, Insights and Forecast - by Industry Vertical
- 7.3.1. BFSI
- 7.3.2. IT &Telecom
- 7.3.3. Healthcare
- 7.3.4. Manufacturing
- 7.3.5. Transportation & Mobility
- 7.3.6. Other Industry Verticals
- 7.1. Market Analysis, Insights and Forecast - by Deployment Type
- 8. Asia Pacific Autonomous Agents Market Analysis, Insights and Forecast, 2019-2031
- 8.1. Market Analysis, Insights and Forecast - by Deployment Type
- 8.1.1. Cloud
- 8.1.2. On-Premises
- 8.2. Market Analysis, Insights and Forecast - by Organization Size
- 8.2.1. Small & Medium-Sized Enterprises (SMEs)
- 8.2.2. Large Enterprises
- 8.3. Market Analysis, Insights and Forecast - by Industry Vertical
- 8.3.1. BFSI
- 8.3.2. IT &Telecom
- 8.3.3. Healthcare
- 8.3.4. Manufacturing
- 8.3.5. Transportation & Mobility
- 8.3.6. Other Industry Verticals
- 8.1. Market Analysis, Insights and Forecast - by Deployment Type
- 9. Latin America Autonomous Agents Market Analysis, Insights and Forecast, 2019-2031
- 9.1. Market Analysis, Insights and Forecast - by Deployment Type
- 9.1.1. Cloud
- 9.1.2. On-Premises
- 9.2. Market Analysis, Insights and Forecast - by Organization Size
- 9.2.1. Small & Medium-Sized Enterprises (SMEs)
- 9.2.2. Large Enterprises
- 9.3. Market Analysis, Insights and Forecast - by Industry Vertical
- 9.3.1. BFSI
- 9.3.2. IT &Telecom
- 9.3.3. Healthcare
- 9.3.4. Manufacturing
- 9.3.5. Transportation & Mobility
- 9.3.6. Other Industry Verticals
- 9.1. Market Analysis, Insights and Forecast - by Deployment Type
- 10. Middle East Autonomous Agents Market Analysis, Insights and Forecast, 2019-2031
- 10.1. Market Analysis, Insights and Forecast - by Deployment Type
- 10.1.1. Cloud
- 10.1.2. On-Premises
- 10.2. Market Analysis, Insights and Forecast - by Organization Size
- 10.2.1. Small & Medium-Sized Enterprises (SMEs)
- 10.2.2. Large Enterprises
- 10.3. Market Analysis, Insights and Forecast - by Industry Vertical
- 10.3.1. BFSI
- 10.3.2. IT &Telecom
- 10.3.3. Healthcare
- 10.3.4. Manufacturing
- 10.3.5. Transportation & Mobility
- 10.3.6. Other Industry Verticals
- 10.1. Market Analysis, Insights and Forecast - by Deployment Type
- 11. North America Autonomous Agents Market Analysis, Insights and Forecast, 2019-2031
- 11.1. Market Analysis, Insights and Forecast - By Country/Sub-region
- 11.1.1 United States
- 11.1.2 Canada
- 11.1.3 Mexico
- 12. Europe Autonomous Agents Market Analysis, Insights and Forecast, 2019-2031
- 12.1. Market Analysis, Insights and Forecast - By Country/Sub-region
- 12.1.1 Germany
- 12.1.2 United Kingdom
- 12.1.3 France
- 12.1.4 Spain
- 12.1.5 Italy
- 12.1.6 Spain
- 12.1.7 Belgium
- 12.1.8 Netherland
- 12.1.9 Nordics
- 12.1.10 Rest of Europe
- 13. Asia Pacific Autonomous Agents Market Analysis, Insights and Forecast, 2019-2031
- 13.1. Market Analysis, Insights and Forecast - By Country/Sub-region
- 13.1.1 China
- 13.1.2 Japan
- 13.1.3 India
- 13.1.4 South Korea
- 13.1.5 Southeast Asia
- 13.1.6 Australia
- 13.1.7 Indonesia
- 13.1.8 Phillipes
- 13.1.9 Singapore
- 13.1.10 Thailandc
- 13.1.11 Rest of Asia Pacific
- 14. South America Autonomous Agents Market Analysis, Insights and Forecast, 2019-2031
- 14.1. Market Analysis, Insights and Forecast - By Country/Sub-region
- 14.1.1 Brazil
- 14.1.2 Argentina
- 14.1.3 Peru
- 14.1.4 Chile
- 14.1.5 Colombia
- 14.1.6 Ecuador
- 14.1.7 Venezuela
- 14.1.8 Rest of South America
- 15. North America Autonomous Agents Market Analysis, Insights and Forecast, 2019-2031
- 15.1. Market Analysis, Insights and Forecast - By Country/Sub-region
- 15.1.1 United States
- 15.1.2 Canada
- 15.1.3 Mexico
- 16. MEA Autonomous Agents Market Analysis, Insights and Forecast, 2019-2031
- 16.1. Market Analysis, Insights and Forecast - By Country/Sub-region
- 16.1.1 United Arab Emirates
- 16.1.2 Saudi Arabia
- 16.1.3 South Africa
- 16.1.4 Rest of Middle East and Africa
- 17. Competitive Analysis
- 17.1. Global Market Share Analysis 2024
- 17.2. Company Profiles
- 17.2.1 SAS Institute Inc
- 17.2.1.1. Overview
- 17.2.1.2. Products
- 17.2.1.3. SWOT Analysis
- 17.2.1.4. Recent Developments
- 17.2.1.5. Financials (Based on Availability)
- 17.2.2 Infosys Limited
- 17.2.2.1. Overview
- 17.2.2.2. Products
- 17.2.2.3. SWOT Analysis
- 17.2.2.4. Recent Developments
- 17.2.2.5. Financials (Based on Availability)
- 17.2.3 Fair Isaac Corporation
- 17.2.3.1. Overview
- 17.2.3.2. Products
- 17.2.3.3. SWOT Analysis
- 17.2.3.4. Recent Developments
- 17.2.3.5. Financials (Based on Availability)
- 17.2.4 Aptiv PLC*List Not Exhaustive
- 17.2.4.1. Overview
- 17.2.4.2. Products
- 17.2.4.3. SWOT Analysis
- 17.2.4.4. Recent Developments
- 17.2.4.5. Financials (Based on Availability)
- 17.2.5 IBM Corporation
- 17.2.5.1. Overview
- 17.2.5.2. Products
- 17.2.5.3. SWOT Analysis
- 17.2.5.4. Recent Developments
- 17.2.5.5. Financials (Based on Availability)
- 17.2.6 Google LLC
- 17.2.6.1. Overview
- 17.2.6.2. Products
- 17.2.6.3. SWOT Analysis
- 17.2.6.4. Recent Developments
- 17.2.6.5. Financials (Based on Availability)
- 17.2.7 Nuance Communications
- 17.2.7.1. Overview
- 17.2.7.2. Products
- 17.2.7.3. SWOT Analysis
- 17.2.7.4. Recent Developments
- 17.2.7.5. Financials (Based on Availability)
- 17.2.8 Salesforce com Inc
- 17.2.8.1. Overview
- 17.2.8.2. Products
- 17.2.8.3. SWOT Analysis
- 17.2.8.4. Recent Developments
- 17.2.8.5. Financials (Based on Availability)
- 17.2.9 Microsoft Corporation
- 17.2.9.1. Overview
- 17.2.9.2. Products
- 17.2.9.3. SWOT Analysis
- 17.2.9.4. Recent Developments
- 17.2.9.5. Financials (Based on Availability)
- 17.2.10 Affectiva Inc
- 17.2.10.1. Overview
- 17.2.10.2. Products
- 17.2.10.3. SWOT Analysis
- 17.2.10.4. Recent Developments
- 17.2.10.5. Financials (Based on Availability)
- 17.2.11 Amazon Web Services Inc
- 17.2.11.1. Overview
- 17.2.11.2. Products
- 17.2.11.3. SWOT Analysis
- 17.2.11.4. Recent Developments
- 17.2.11.5. Financials (Based on Availability)
- 17.2.12 Fetch ai
- 17.2.12.1. Overview
- 17.2.12.2. Products
- 17.2.12.3. SWOT Analysis
- 17.2.12.4. Recent Developments
- 17.2.12.5. Financials (Based on Availability)
- 17.2.13 Oracle Corporation
- 17.2.13.1. Overview
- 17.2.13.2. Products
- 17.2.13.3. SWOT Analysis
- 17.2.13.4. Recent Developments
- 17.2.13.5. Financials (Based on Availability)
- 17.2.14 Intel Corporation
- 17.2.14.1. Overview
- 17.2.14.2. Products
- 17.2.14.3. SWOT Analysis
- 17.2.14.4. Recent Developments
- 17.2.14.5. Financials (Based on Availability)
- 17.2.15 SAP SE
- 17.2.15.1. Overview
- 17.2.15.2. Products
- 17.2.15.3. SWOT Analysis
- 17.2.15.4. Recent Developments
- 17.2.15.5. Financials (Based on Availability)
- 17.2.1 SAS Institute Inc
List of Figures
- Figure 1: Global Autonomous Agents Market Revenue Breakdown (Million, %) by Region 2024 & 2032
- Figure 2: North America Autonomous Agents Market Revenue (Million), by Country 2024 & 2032
- Figure 3: North America Autonomous Agents Market Revenue Share (%), by Country 2024 & 2032
- Figure 4: Europe Autonomous Agents Market Revenue (Million), by Country 2024 & 2032
- Figure 5: Europe Autonomous Agents Market Revenue Share (%), by Country 2024 & 2032
- Figure 6: Asia Pacific Autonomous Agents Market Revenue (Million), by Country 2024 & 2032
- Figure 7: Asia Pacific Autonomous Agents Market Revenue Share (%), by Country 2024 & 2032
- Figure 8: South America Autonomous Agents Market Revenue (Million), by Country 2024 & 2032
- Figure 9: South America Autonomous Agents Market Revenue Share (%), by Country 2024 & 2032
- Figure 10: North America Autonomous Agents Market Revenue (Million), by Country 2024 & 2032
- Figure 11: North America Autonomous Agents Market Revenue Share (%), by Country 2024 & 2032
- Figure 12: MEA Autonomous Agents Market Revenue (Million), by Country 2024 & 2032
- Figure 13: MEA Autonomous Agents Market Revenue Share (%), by Country 2024 & 2032
- Figure 14: North America Autonomous Agents Market Revenue (Million), by Deployment Type 2024 & 2032
- Figure 15: North America Autonomous Agents Market Revenue Share (%), by Deployment Type 2024 & 2032
- Figure 16: North America Autonomous Agents Market Revenue (Million), by Organization Size 2024 & 2032
- Figure 17: North America Autonomous Agents Market Revenue Share (%), by Organization Size 2024 & 2032
- Figure 18: North America Autonomous Agents Market Revenue (Million), by Industry Vertical 2024 & 2032
- Figure 19: North America Autonomous Agents Market Revenue Share (%), by Industry Vertical 2024 & 2032
- Figure 20: North America Autonomous Agents Market Revenue (Million), by Country 2024 & 2032
- Figure 21: North America Autonomous Agents Market Revenue Share (%), by Country 2024 & 2032
- Figure 22: Europe Autonomous Agents Market Revenue (Million), by Deployment Type 2024 & 2032
- Figure 23: Europe Autonomous Agents Market Revenue Share (%), by Deployment Type 2024 & 2032
- Figure 24: Europe Autonomous Agents Market Revenue (Million), by Organization Size 2024 & 2032
- Figure 25: Europe Autonomous Agents Market Revenue Share (%), by Organization Size 2024 & 2032
- Figure 26: Europe Autonomous Agents Market Revenue (Million), by Industry Vertical 2024 & 2032
- Figure 27: Europe Autonomous Agents Market Revenue Share (%), by Industry Vertical 2024 & 2032
- Figure 28: Europe Autonomous Agents Market Revenue (Million), by Country 2024 & 2032
- Figure 29: Europe Autonomous Agents Market Revenue Share (%), by Country 2024 & 2032
- Figure 30: Asia Pacific Autonomous Agents Market Revenue (Million), by Deployment Type 2024 & 2032
- Figure 31: Asia Pacific Autonomous Agents Market Revenue Share (%), by Deployment Type 2024 & 2032
- Figure 32: Asia Pacific Autonomous Agents Market Revenue (Million), by Organization Size 2024 & 2032
- Figure 33: Asia Pacific Autonomous Agents Market Revenue Share (%), by Organization Size 2024 & 2032
- Figure 34: Asia Pacific Autonomous Agents Market Revenue (Million), by Industry Vertical 2024 & 2032
- Figure 35: Asia Pacific Autonomous Agents Market Revenue Share (%), by Industry Vertical 2024 & 2032
- Figure 36: Asia Pacific Autonomous Agents Market Revenue (Million), by Country 2024 & 2032
- Figure 37: Asia Pacific Autonomous Agents Market Revenue Share (%), by Country 2024 & 2032
- Figure 38: Latin America Autonomous Agents Market Revenue (Million), by Deployment Type 2024 & 2032
- Figure 39: Latin America Autonomous Agents Market Revenue Share (%), by Deployment Type 2024 & 2032
- Figure 40: Latin America Autonomous Agents Market Revenue (Million), by Organization Size 2024 & 2032
- Figure 41: Latin America Autonomous Agents Market Revenue Share (%), by Organization Size 2024 & 2032
- Figure 42: Latin America Autonomous Agents Market Revenue (Million), by Industry Vertical 2024 & 2032
- Figure 43: Latin America Autonomous Agents Market Revenue Share (%), by Industry Vertical 2024 & 2032
- Figure 44: Latin America Autonomous Agents Market Revenue (Million), by Country 2024 & 2032
- Figure 45: Latin America Autonomous Agents Market Revenue Share (%), by Country 2024 & 2032
- Figure 46: Middle East Autonomous Agents Market Revenue (Million), by Deployment Type 2024 & 2032
- Figure 47: Middle East Autonomous Agents Market Revenue Share (%), by Deployment Type 2024 & 2032
- Figure 48: Middle East Autonomous Agents Market Revenue (Million), by Organization Size 2024 & 2032
- Figure 49: Middle East Autonomous Agents Market Revenue Share (%), by Organization Size 2024 & 2032
- Figure 50: Middle East Autonomous Agents Market Revenue (Million), by Industry Vertical 2024 & 2032
- Figure 51: Middle East Autonomous Agents Market Revenue Share (%), by Industry Vertical 2024 & 2032
- Figure 52: Middle East Autonomous Agents Market Revenue (Million), by Country 2024 & 2032
- Figure 53: Middle East Autonomous Agents Market Revenue Share (%), by Country 2024 & 2032
List of Tables
- Table 1: Global Autonomous Agents Market Revenue Million Forecast, by Region 2019 & 2032
- Table 2: Global Autonomous Agents Market Revenue Million Forecast, by Deployment Type 2019 & 2032
- Table 3: Global Autonomous Agents Market Revenue Million Forecast, by Organization Size 2019 & 2032
- Table 4: Global Autonomous Agents Market Revenue Million Forecast, by Industry Vertical 2019 & 2032
- Table 5: Global Autonomous Agents Market Revenue Million Forecast, by Region 2019 & 2032
- Table 6: Global Autonomous Agents Market Revenue Million Forecast, by Country 2019 & 2032
- Table 7: United States Autonomous Agents Market Revenue (Million) Forecast, by Application 2019 & 2032
- Table 8: Canada Autonomous Agents Market Revenue (Million) Forecast, by Application 2019 & 2032
- Table 9: Mexico Autonomous Agents Market Revenue (Million) Forecast, by Application 2019 & 2032
- Table 10: Global Autonomous Agents Market Revenue Million Forecast, by Country 2019 & 2032
- Table 11: Germany Autonomous Agents Market Revenue (Million) Forecast, by Application 2019 & 2032
- Table 12: United Kingdom Autonomous Agents Market Revenue (Million) Forecast, by Application 2019 & 2032
- Table 13: France Autonomous Agents Market Revenue (Million) Forecast, by Application 2019 & 2032
- Table 14: Spain Autonomous Agents Market Revenue (Million) Forecast, by Application 2019 & 2032
- Table 15: Italy Autonomous Agents Market Revenue (Million) Forecast, by Application 2019 & 2032
- Table 16: Spain Autonomous Agents Market Revenue (Million) Forecast, by Application 2019 & 2032
- Table 17: Belgium Autonomous Agents Market Revenue (Million) Forecast, by Application 2019 & 2032
- Table 18: Netherland Autonomous Agents Market Revenue (Million) Forecast, by Application 2019 & 2032
- Table 19: Nordics Autonomous Agents Market Revenue (Million) Forecast, by Application 2019 & 2032
- Table 20: Rest of Europe Autonomous Agents Market Revenue (Million) Forecast, by Application 2019 & 2032
- Table 21: Global Autonomous Agents Market Revenue Million Forecast, by Country 2019 & 2032
- Table 22: China Autonomous Agents Market Revenue (Million) Forecast, by Application 2019 & 2032
- Table 23: Japan Autonomous Agents Market Revenue (Million) Forecast, by Application 2019 & 2032
- Table 24: India Autonomous Agents Market Revenue (Million) Forecast, by Application 2019 & 2032
- Table 25: South Korea Autonomous Agents Market Revenue (Million) Forecast, by Application 2019 & 2032
- Table 26: Southeast Asia Autonomous Agents Market Revenue (Million) Forecast, by Application 2019 & 2032
- Table 27: Australia Autonomous Agents Market Revenue (Million) Forecast, by Application 2019 & 2032
- Table 28: Indonesia Autonomous Agents Market Revenue (Million) Forecast, by Application 2019 & 2032
- Table 29: Phillipes Autonomous Agents Market Revenue (Million) Forecast, by Application 2019 & 2032
- Table 30: Singapore Autonomous Agents Market Revenue (Million) Forecast, by Application 2019 & 2032
- Table 31: Thailandc Autonomous Agents Market Revenue (Million) Forecast, by Application 2019 & 2032
- Table 32: Rest of Asia Pacific Autonomous Agents Market Revenue (Million) Forecast, by Application 2019 & 2032
- Table 33: Global Autonomous Agents Market Revenue Million Forecast, by Country 2019 & 2032
- Table 34: Brazil Autonomous Agents Market Revenue (Million) Forecast, by Application 2019 & 2032
- Table 35: Argentina Autonomous Agents Market Revenue (Million) Forecast, by Application 2019 & 2032
- Table 36: Peru Autonomous Agents Market Revenue (Million) Forecast, by Application 2019 & 2032
- Table 37: Chile Autonomous Agents Market Revenue (Million) Forecast, by Application 2019 & 2032
- Table 38: Colombia Autonomous Agents Market Revenue (Million) Forecast, by Application 2019 & 2032
- Table 39: Ecuador Autonomous Agents Market Revenue (Million) Forecast, by Application 2019 & 2032
- Table 40: Venezuela Autonomous Agents Market Revenue (Million) Forecast, by Application 2019 & 2032
- Table 41: Rest of South America Autonomous Agents Market Revenue (Million) Forecast, by Application 2019 & 2032
- Table 42: Global Autonomous Agents Market Revenue Million Forecast, by Country 2019 & 2032
- Table 43: United States Autonomous Agents Market Revenue (Million) Forecast, by Application 2019 & 2032
- Table 44: Canada Autonomous Agents Market Revenue (Million) Forecast, by Application 2019 & 2032
- Table 45: Mexico Autonomous Agents Market Revenue (Million) Forecast, by Application 2019 & 2032
- Table 46: Global Autonomous Agents Market Revenue Million Forecast, by Country 2019 & 2032
- Table 47: United Arab Emirates Autonomous Agents Market Revenue (Million) Forecast, by Application 2019 & 2032
- Table 48: Saudi Arabia Autonomous Agents Market Revenue (Million) Forecast, by Application 2019 & 2032
- Table 49: South Africa Autonomous Agents Market Revenue (Million) Forecast, by Application 2019 & 2032
- Table 50: Rest of Middle East and Africa Autonomous Agents Market Revenue (Million) Forecast, by Application 2019 & 2032
- Table 51: Global Autonomous Agents Market Revenue Million Forecast, by Deployment Type 2019 & 2032
- Table 52: Global Autonomous Agents Market Revenue Million Forecast, by Organization Size 2019 & 2032
- Table 53: Global Autonomous Agents Market Revenue Million Forecast, by Industry Vertical 2019 & 2032
- Table 54: Global Autonomous Agents Market Revenue Million Forecast, by Country 2019 & 2032
- Table 55: Global Autonomous Agents Market Revenue Million Forecast, by Deployment Type 2019 & 2032
- Table 56: Global Autonomous Agents Market Revenue Million Forecast, by Organization Size 2019 & 2032
- Table 57: Global Autonomous Agents Market Revenue Million Forecast, by Industry Vertical 2019 & 2032
- Table 58: Global Autonomous Agents Market Revenue Million Forecast, by Country 2019 & 2032
- Table 59: Global Autonomous Agents Market Revenue Million Forecast, by Deployment Type 2019 & 2032
- Table 60: Global Autonomous Agents Market Revenue Million Forecast, by Organization Size 2019 & 2032
- Table 61: Global Autonomous Agents Market Revenue Million Forecast, by Industry Vertical 2019 & 2032
- Table 62: Global Autonomous Agents Market Revenue Million Forecast, by Country 2019 & 2032
- Table 63: Global Autonomous Agents Market Revenue Million Forecast, by Deployment Type 2019 & 2032
- Table 64: Global Autonomous Agents Market Revenue Million Forecast, by Organization Size 2019 & 2032
- Table 65: Global Autonomous Agents Market Revenue Million Forecast, by Industry Vertical 2019 & 2032
- Table 66: Global Autonomous Agents Market Revenue Million Forecast, by Country 2019 & 2032
- Table 67: Global Autonomous Agents Market Revenue Million Forecast, by Deployment Type 2019 & 2032
- Table 68: Global Autonomous Agents Market Revenue Million Forecast, by Organization Size 2019 & 2032
- Table 69: Global Autonomous Agents Market Revenue Million Forecast, by Industry Vertical 2019 & 2032
- Table 70: Global Autonomous Agents Market Revenue Million Forecast, by Country 2019 & 2032
Frequently Asked Questions
1. What is the projected Compound Annual Growth Rate (CAGR) of the Autonomous Agents Market?
The projected CAGR is approximately 57.00%.
2. Which companies are prominent players in the Autonomous Agents Market?
Key companies in the market include SAS Institute Inc, Infosys Limited, Fair Isaac Corporation, Aptiv PLC*List Not Exhaustive, IBM Corporation, Google LLC, Nuance Communications, Salesforce com Inc, Microsoft Corporation, Affectiva Inc, Amazon Web Services Inc, Fetch ai, Oracle Corporation, Intel Corporation, SAP SE.
3. What are the main segments of the Autonomous Agents Market?
The market segments include Deployment Type, Organization Size, Industry Vertical.
4. Can you provide details about the market size?
The market size is estimated to be USD XX Million as of 2022.
5. What are some drivers contributing to market growth?
; Rising Number of AI Applications; Growing Presence of Parallel Computational Resources.
6. What are the notable trends driving market growth?
Transportation and Mobility Segments to Dominate the Market.
7. Are there any restraints impacting market growth?
Maintaining the Privacy and Integrity of Patient Data.
8. Can you provide examples of recent developments in the market?
N/A
9. What pricing options are available for accessing the report?
Pricing options include single-user, multi-user, and enterprise licenses priced at USD 4750, USD 5250, and USD 8750 respectively.
10. Is the market size provided in terms of value or volume?
The market size is provided in terms of value, measured in Million.
11. Are there any specific market keywords associated with the report?
Yes, the market keyword associated with the report is "Autonomous Agents Market," which aids in identifying and referencing the specific market segment covered.
12. How do I determine which pricing option suits my needs best?
The pricing options vary based on user requirements and access needs. Individual users may opt for single-user licenses, while businesses requiring broader access may choose multi-user or enterprise licenses for cost-effective access to the report.
13. Are there any additional resources or data provided in the Autonomous Agents Market report?
While the report offers comprehensive insights, it's advisable to review the specific contents or supplementary materials provided to ascertain if additional resources or data are available.
14. How can I stay updated on further developments or reports in the Autonomous Agents Market?
To stay informed about further developments, trends, and reports in the Autonomous Agents Market, consider subscribing to industry newsletters, following relevant companies and organizations, or regularly checking reputable industry news sources and publications.
Methodology
Step 1 - Identification of Relevant Samples Size from Population Database


Step 2 - Approaches for Defining Global Market Size (Value, Volume* & Price*)

Note*: In applicable scenarios
Step 3 - Data Sources
Primary Research
- Web Analytics
- Survey Reports
- Research Institute
- Latest Research Reports
- Opinion Leaders
Secondary Research
- Annual Reports
- White Paper
- Latest Press Release
- Industry Association
- Paid Database
- Investor Presentations

Step 4 - Data Triangulation
Involves using different sources of information in order to increase the validity of a study
These sources are likely to be stakeholders in a program - participants, other researchers, program staff, other community members, and so on.
Then we put all data in single framework & apply various statistical tools to find out the dynamic on the market.
During the analysis stage, feedback from the stakeholder groups would be compared to determine areas of agreement as well as areas of divergence
