

Key Insights
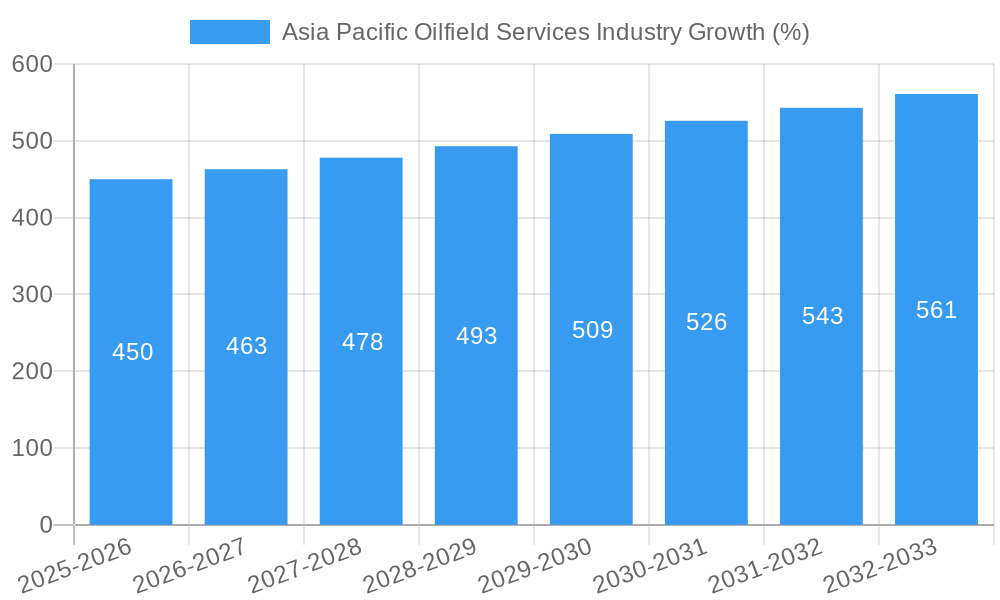
The Asia-Pacific oilfield services market, encompassing onshore and offshore operations across drilling, completion, and production services, is experiencing robust growth. Driven by increasing energy demand from rapidly developing economies like China, India, and South Korea, coupled with significant investments in exploration and production activities, the market exhibits a Compound Annual Growth Rate (CAGR) exceeding 3.00%. This growth is further fueled by technological advancements in drilling techniques, enhanced oil recovery methods, and the adoption of digital technologies to optimize operational efficiency. The market segmentation reveals a dynamic landscape; while onshore operations currently dominate, a substantial increase in offshore exploration and production, particularly in deepwater areas, is anticipated, driving considerable growth in offshore service segments. Key players like Superior Energy Services, Archer Limited, and Schlumberger are strategically investing in regional expansion and technological upgrades to capitalize on these opportunities.
However, the market faces certain restraints. Fluctuations in global oil prices significantly impact investment decisions within the industry. Environmental regulations and growing concerns regarding carbon emissions necessitate the adoption of sustainable practices, adding to operational costs and requiring significant technological investments. Furthermore, geopolitical instability in certain regions within Asia-Pacific can disrupt operational activities and introduce uncertainties into long-term investment plans. Nevertheless, the long-term outlook remains positive, projecting consistent growth throughout the forecast period (2025-2033) propelled by the region's burgeoning energy demand and ongoing investments in its energy infrastructure. The continued focus on technological innovation and sustainable practices will be critical for companies seeking success in this competitive yet promising market.

Asia Pacific Oilfield Services Industry: Market Forecast & Analysis (2019-2033)
This comprehensive report provides an in-depth analysis of the Asia Pacific oilfield services market, offering invaluable insights for stakeholders seeking to navigate this dynamic landscape. Covering the period from 2019 to 2033, with a base year of 2025 and a forecast period extending to 2033, this report dissects market trends, technological advancements, and key players shaping the industry's future. Expect detailed breakdowns of market segments, including onshore and offshore deployments and service types spanning drilling, completion, production, and other specialized services. The report's findings are supported by robust data analysis and informed projections, making it an essential resource for strategic decision-making.
Asia Pacific Oilfield Services Industry Market Composition & Trends
This section evaluates the competitive landscape of the Asia Pacific oilfield services market, encompassing market concentration, innovation drivers, regulatory frameworks, substitute products, end-user profiles, and mergers & acquisitions (M&A) activity. The report reveals a market valued at xx Million in 2024, projected to reach xx Million by 2033, exhibiting a Compound Annual Growth Rate (CAGR) of xx%.
- Market Concentration: The market exhibits a moderately concentrated structure, with a handful of multinational companies holding significant market share. Schlumberger Ltd, Halliburton Co, and Baker Hughes Co account for a combined xx% market share in 2024.
- Innovation Catalysts: The ongoing push for enhanced oil recovery (EOR) techniques, coupled with the adoption of digital technologies (e.g., AI and automation), are key innovation drivers.
- Regulatory Landscape: Varying regulatory environments across the Asia-Pacific region influence operational costs and investment decisions. Compliance and environmental regulations pose significant challenges.
- Substitute Products: Technological advancements in renewable energy sources pose a potential long-term threat, but oil and gas remain dominant energy sources in the region.
- End-User Profiles: The primary end-users are national oil companies (NOCs) and independent exploration and production (E&P) companies, varying across regions.
- M&A Activities: The report analyzes completed M&A transactions in the historical period (2019-2024), highlighting deal values totaling approximately xx Million. Future M&A activity is predicted to focus on enhancing technological capabilities and expanding geographical reach.
Asia Pacific Oilfield Services Industry Industry Evolution
This section analyzes the evolution of the Asia Pacific oilfield services market, highlighting growth trajectories, technological advancements, and evolving consumer demands. The industry has witnessed significant changes driven by fluctuating oil prices, increasing demand for energy, and technological innovations. The historical period (2019-2024) was marked by periods of growth and contraction, reflecting global economic conditions. However, the forecast period (2025-2033) is expected to witness a steady expansion, driven by increasing exploration and production activities in several key countries. Specific growth rates and technological adoption rates will be provided for individual segments and countries within the report. The shift towards integrated services like i-RDC contracts is also examined.
Leading Regions, Countries, or Segments in Asia Pacific Oilfield Services Industry
This section identifies the dominant regions, countries, and service types within the Asia Pacific oilfield services market. Detailed analysis explores factors driving dominance, including investment trends, policy support, and resource availability.
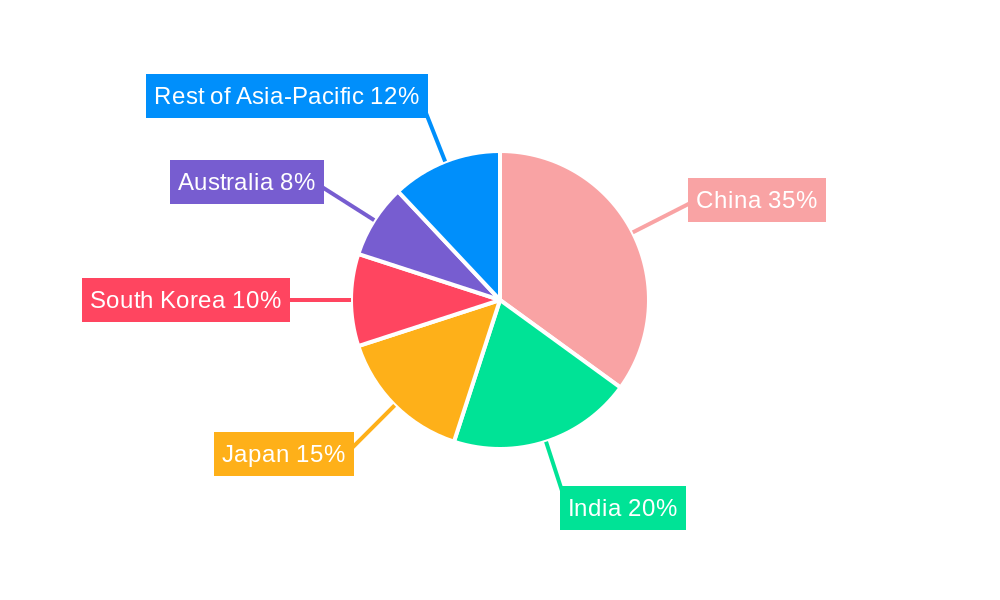
- Dominant Regions: Australia, China, and India are expected to be leading markets during the forecast period, driven by their robust oil and gas reserves and ongoing investment in energy infrastructure.
- Dominant Service Types: Drilling services hold a significant market share, driven by ongoing exploration and production projects. Completion and production services are expected to witness substantial growth, spurred by technological advancements and demand for efficient oil and gas extraction.
- Key Drivers:
- Increased Investment in Oil & Gas Exploration: Significant investments by both NOCs and international E&P companies are driving demand for oilfield services.
- Government Support and Policies: Favorable regulatory environments and supportive government policies in several key countries are fostering industry growth.
- Technological Advancements: The adoption of advanced technologies, such as automation, digitalization, and improved drilling techniques, are enhancing efficiency and productivity.
Asia Pacific Oilfield Services Industry Product Innovations
Recent years have seen notable advancements in oilfield services technology, including the development of automated drilling rigs, improved drilling fluids, and advanced completion techniques. These innovations enhance efficiency, reduce environmental impact, and improve the overall productivity of oil and gas extraction. This section will highlight specific products, their applications, and performance metrics, emphasizing their unique selling propositions and market impact.
Propelling Factors for Asia Pacific Oilfield Services Industry Growth
The growth of the Asia Pacific oilfield services market is driven by a confluence of factors. Increasing energy demand in the region necessitates expanded oil and gas production. Government initiatives promoting energy security and infrastructure development provide a supportive environment. Furthermore, technological advancements continually improve extraction efficiency and reduce costs, fueling further growth.
Obstacles in the Asia Pacific Oilfield Services Industry Market
Several challenges impede the growth of the Asia Pacific oilfield services market. Fluctuating oil prices create uncertainties in investment decisions. Geopolitical risks and regional conflicts can disrupt operations and supply chains. Competition among established players and new entrants intensifies pressure on pricing and profitability. Environmental regulations, while crucial, increase operational costs.
Future Opportunities in Asia Pacific Oilfield Services Industry
The Asia Pacific oilfield services market presents various future opportunities. The increasing adoption of digital technologies offers potential for improved efficiency and cost reduction. The development of new EOR techniques and unconventional resource extraction methods can unlock new revenue streams. Expansion into emerging markets and collaboration with technology providers can drive further growth and innovation.
Major Players in the Asia Pacific Oilfield Services Industry Ecosystem
- Superior Energy Services Inc
- Archer Limited
- National Oilwell Varco Inc
- Baker Hughes Co
- Schlumberger Ltd
- Petrofac Limited
- Expro Group
- Weatherford International PLC
- Halliburton Co
Key Developments in Asia Pacific Oilfield Services Industry Industry
- November 2022: Velesto Energy secured a USD 135 Million integrated rig, drilling, and completion services contract from Hess Corp., showcasing the growing adoption of i-RDC models. This development highlights the trend towards integrated services and the increasing demand for efficient and streamlined solutions in the oil and gas industry.
- October 2022: The collaboration between IIT Kharagpur and ONGC on R&D projects signifies a commitment to innovation and technological advancement within the industry, suggesting future improvements in drilling, fluid management, and completion techniques. This partnership fosters advancements in drilling technologies and improved efficiency.
Strategic Asia Pacific Oilfield Services Industry Market Forecast
The Asia Pacific oilfield services market is poised for sustained growth, driven by robust energy demand, technological advancements, and favorable government policies. Opportunities abound in emerging markets, particularly in Southeast Asia, and the ongoing development of new technologies will reshape the industry's landscape. Continued investment in infrastructure and exploration activities will further support market expansion throughout the forecast period.
Asia Pacific Oilfield Services Industry Segmentation
-
1. Location of Deployment
- 1.1. Onshore
- 1.2. Offshore
-
2. Service Type
- 2.1. Drilling
- 2.2. Completion
- 2.3. Production
- 2.4. Other Service Types
-
3. Geography
- 3.1. India
- 3.2. China
- 3.3. Indonesia
- 3.4. Rest of Asia-Pacifc
Asia Pacific Oilfield Services Industry Segmentation By Geography
- 1. India
- 2. China
- 3. Indonesia
- 4. Rest of Asia Pacifc
Asia Pacific Oilfield Services Industry REPORT HIGHLIGHTS
| Aspects | Details |
|---|---|
| Study Period | 2019-2033 |
| Base Year | 2024 |
| Estimated Year | 2025 |
| Forecast Period | 2025-2033 |
| Historical Period | 2019-2024 |
| Growth Rate | CAGR of > 3.00% from 2019-2033 |
| Segmentation |
|
Table of Contents
- 1. Introduction
- 1.1. Research Scope
- 1.2. Market Segmentation
- 1.3. Research Methodology
- 1.4. Definitions and Assumptions
- 2. Executive Summary
- 2.1. Introduction
- 3. Market Dynamics
- 3.1. Introduction
- 3.2. Market Drivers
- 3.2.1 4.; Increasing Development of Gas Reserves and Advanced Technology
- 3.2.2 Tools
- 3.2.3 and Equipment4.; Increasing Investment in the Oilfield Services across World
- 3.3. Market Restrains
- 3.3.1 4.; The Volatile Oil Prices Over the Recent Period
- 3.3.2 Owing to the Supply-Demand Gap
- 3.4. Market Trends
- 3.4.1. Drilling Services to Dominate the Market
- 4. Market Factor Analysis
- 4.1. Porters Five Forces
- 4.2. Supply/Value Chain
- 4.3. PESTEL analysis
- 4.4. Market Entropy
- 4.5. Patent/Trademark Analysis
- 5. Asia Pacific Oilfield Services Industry Analysis, Insights and Forecast, 2019-2031
- 5.1. Market Analysis, Insights and Forecast - by Location of Deployment
- 5.1.1. Onshore
- 5.1.2. Offshore
- 5.2. Market Analysis, Insights and Forecast - by Service Type
- 5.2.1. Drilling
- 5.2.2. Completion
- 5.2.3. Production
- 5.2.4. Other Service Types
- 5.3. Market Analysis, Insights and Forecast - by Geography
- 5.3.1. India
- 5.3.2. China
- 5.3.3. Indonesia
- 5.3.4. Rest of Asia-Pacifc
- 5.4. Market Analysis, Insights and Forecast - by Region
- 5.4.1. India
- 5.4.2. China
- 5.4.3. Indonesia
- 5.4.4. Rest of Asia Pacifc
- 5.1. Market Analysis, Insights and Forecast - by Location of Deployment
- 6. India Asia Pacific Oilfield Services Industry Analysis, Insights and Forecast, 2019-2031
- 6.1. Market Analysis, Insights and Forecast - by Location of Deployment
- 6.1.1. Onshore
- 6.1.2. Offshore
- 6.2. Market Analysis, Insights and Forecast - by Service Type
- 6.2.1. Drilling
- 6.2.2. Completion
- 6.2.3. Production
- 6.2.4. Other Service Types
- 6.3. Market Analysis, Insights and Forecast - by Geography
- 6.3.1. India
- 6.3.2. China
- 6.3.3. Indonesia
- 6.3.4. Rest of Asia-Pacifc
- 6.1. Market Analysis, Insights and Forecast - by Location of Deployment
- 7. China Asia Pacific Oilfield Services Industry Analysis, Insights and Forecast, 2019-2031
- 7.1. Market Analysis, Insights and Forecast - by Location of Deployment
- 7.1.1. Onshore
- 7.1.2. Offshore
- 7.2. Market Analysis, Insights and Forecast - by Service Type
- 7.2.1. Drilling
- 7.2.2. Completion
- 7.2.3. Production
- 7.2.4. Other Service Types
- 7.3. Market Analysis, Insights and Forecast - by Geography
- 7.3.1. India
- 7.3.2. China
- 7.3.3. Indonesia
- 7.3.4. Rest of Asia-Pacifc
- 7.1. Market Analysis, Insights and Forecast - by Location of Deployment
- 8. Indonesia Asia Pacific Oilfield Services Industry Analysis, Insights and Forecast, 2019-2031
- 8.1. Market Analysis, Insights and Forecast - by Location of Deployment
- 8.1.1. Onshore
- 8.1.2. Offshore
- 8.2. Market Analysis, Insights and Forecast - by Service Type
- 8.2.1. Drilling
- 8.2.2. Completion
- 8.2.3. Production
- 8.2.4. Other Service Types
- 8.3. Market Analysis, Insights and Forecast - by Geography
- 8.3.1. India
- 8.3.2. China
- 8.3.3. Indonesia
- 8.3.4. Rest of Asia-Pacifc
- 8.1. Market Analysis, Insights and Forecast - by Location of Deployment
- 9. Rest of Asia Pacifc Asia Pacific Oilfield Services Industry Analysis, Insights and Forecast, 2019-2031
- 9.1. Market Analysis, Insights and Forecast - by Location of Deployment
- 9.1.1. Onshore
- 9.1.2. Offshore
- 9.2. Market Analysis, Insights and Forecast - by Service Type
- 9.2.1. Drilling
- 9.2.2. Completion
- 9.2.3. Production
- 9.2.4. Other Service Types
- 9.3. Market Analysis, Insights and Forecast - by Geography
- 9.3.1. India
- 9.3.2. China
- 9.3.3. Indonesia
- 9.3.4. Rest of Asia-Pacifc
- 9.1. Market Analysis, Insights and Forecast - by Location of Deployment
- 10. China Asia Pacific Oilfield Services Industry Analysis, Insights and Forecast, 2019-2031
- 11. Japan Asia Pacific Oilfield Services Industry Analysis, Insights and Forecast, 2019-2031
- 12. India Asia Pacific Oilfield Services Industry Analysis, Insights and Forecast, 2019-2031
- 13. South Korea Asia Pacific Oilfield Services Industry Analysis, Insights and Forecast, 2019-2031
- 14. Taiwan Asia Pacific Oilfield Services Industry Analysis, Insights and Forecast, 2019-2031
- 15. Australia Asia Pacific Oilfield Services Industry Analysis, Insights and Forecast, 2019-2031
- 16. Rest of Asia-Pacific Asia Pacific Oilfield Services Industry Analysis, Insights and Forecast, 2019-2031
- 17. Competitive Analysis
- 17.1. Market Share Analysis 2024
- 17.2. Company Profiles
- 17.2.1 Superior Energy Services Inc
- 17.2.1.1. Overview
- 17.2.1.2. Products
- 17.2.1.3. SWOT Analysis
- 17.2.1.4. Recent Developments
- 17.2.1.5. Financials (Based on Availability)
- 17.2.2 Archer Limited
- 17.2.2.1. Overview
- 17.2.2.2. Products
- 17.2.2.3. SWOT Analysis
- 17.2.2.4. Recent Developments
- 17.2.2.5. Financials (Based on Availability)
- 17.2.3 National Oilwell Varco Inc
- 17.2.3.1. Overview
- 17.2.3.2. Products
- 17.2.3.3. SWOT Analysis
- 17.2.3.4. Recent Developments
- 17.2.3.5. Financials (Based on Availability)
- 17.2.4 Baker Hughes Co
- 17.2.4.1. Overview
- 17.2.4.2. Products
- 17.2.4.3. SWOT Analysis
- 17.2.4.4. Recent Developments
- 17.2.4.5. Financials (Based on Availability)
- 17.2.5 Schlumberger Ltd
- 17.2.5.1. Overview
- 17.2.5.2. Products
- 17.2.5.3. SWOT Analysis
- 17.2.5.4. Recent Developments
- 17.2.5.5. Financials (Based on Availability)
- 17.2.6 Petrofac Limited
- 17.2.6.1. Overview
- 17.2.6.2. Products
- 17.2.6.3. SWOT Analysis
- 17.2.6.4. Recent Developments
- 17.2.6.5. Financials (Based on Availability)
- 17.2.7 Expro Group
- 17.2.7.1. Overview
- 17.2.7.2. Products
- 17.2.7.3. SWOT Analysis
- 17.2.7.4. Recent Developments
- 17.2.7.5. Financials (Based on Availability)
- 17.2.8 Weatherford International PLC
- 17.2.8.1. Overview
- 17.2.8.2. Products
- 17.2.8.3. SWOT Analysis
- 17.2.8.4. Recent Developments
- 17.2.8.5. Financials (Based on Availability)
- 17.2.9 Halliburton Co
- 17.2.9.1. Overview
- 17.2.9.2. Products
- 17.2.9.3. SWOT Analysis
- 17.2.9.4. Recent Developments
- 17.2.9.5. Financials (Based on Availability)
- 17.2.1 Superior Energy Services Inc
List of Figures
- Figure 1: Asia Pacific Oilfield Services Industry Revenue Breakdown (Million, %) by Product 2024 & 2032
- Figure 2: Asia Pacific Oilfield Services Industry Share (%) by Company 2024
List of Tables
- Table 1: Asia Pacific Oilfield Services Industry Revenue Million Forecast, by Region 2019 & 2032
- Table 2: Asia Pacific Oilfield Services Industry Revenue Million Forecast, by Location of Deployment 2019 & 2032
- Table 3: Asia Pacific Oilfield Services Industry Revenue Million Forecast, by Service Type 2019 & 2032
- Table 4: Asia Pacific Oilfield Services Industry Revenue Million Forecast, by Geography 2019 & 2032
- Table 5: Asia Pacific Oilfield Services Industry Revenue Million Forecast, by Region 2019 & 2032
- Table 6: Asia Pacific Oilfield Services Industry Revenue Million Forecast, by Country 2019 & 2032
- Table 7: China Asia Pacific Oilfield Services Industry Revenue (Million) Forecast, by Application 2019 & 2032
- Table 8: Japan Asia Pacific Oilfield Services Industry Revenue (Million) Forecast, by Application 2019 & 2032
- Table 9: India Asia Pacific Oilfield Services Industry Revenue (Million) Forecast, by Application 2019 & 2032
- Table 10: South Korea Asia Pacific Oilfield Services Industry Revenue (Million) Forecast, by Application 2019 & 2032
- Table 11: Taiwan Asia Pacific Oilfield Services Industry Revenue (Million) Forecast, by Application 2019 & 2032
- Table 12: Australia Asia Pacific Oilfield Services Industry Revenue (Million) Forecast, by Application 2019 & 2032
- Table 13: Rest of Asia-Pacific Asia Pacific Oilfield Services Industry Revenue (Million) Forecast, by Application 2019 & 2032
- Table 14: Asia Pacific Oilfield Services Industry Revenue Million Forecast, by Location of Deployment 2019 & 2032
- Table 15: Asia Pacific Oilfield Services Industry Revenue Million Forecast, by Service Type 2019 & 2032
- Table 16: Asia Pacific Oilfield Services Industry Revenue Million Forecast, by Geography 2019 & 2032
- Table 17: Asia Pacific Oilfield Services Industry Revenue Million Forecast, by Country 2019 & 2032
- Table 18: Asia Pacific Oilfield Services Industry Revenue Million Forecast, by Location of Deployment 2019 & 2032
- Table 19: Asia Pacific Oilfield Services Industry Revenue Million Forecast, by Service Type 2019 & 2032
- Table 20: Asia Pacific Oilfield Services Industry Revenue Million Forecast, by Geography 2019 & 2032
- Table 21: Asia Pacific Oilfield Services Industry Revenue Million Forecast, by Country 2019 & 2032
- Table 22: Asia Pacific Oilfield Services Industry Revenue Million Forecast, by Location of Deployment 2019 & 2032
- Table 23: Asia Pacific Oilfield Services Industry Revenue Million Forecast, by Service Type 2019 & 2032
- Table 24: Asia Pacific Oilfield Services Industry Revenue Million Forecast, by Geography 2019 & 2032
- Table 25: Asia Pacific Oilfield Services Industry Revenue Million Forecast, by Country 2019 & 2032
- Table 26: Asia Pacific Oilfield Services Industry Revenue Million Forecast, by Location of Deployment 2019 & 2032
- Table 27: Asia Pacific Oilfield Services Industry Revenue Million Forecast, by Service Type 2019 & 2032
- Table 28: Asia Pacific Oilfield Services Industry Revenue Million Forecast, by Geography 2019 & 2032
- Table 29: Asia Pacific Oilfield Services Industry Revenue Million Forecast, by Country 2019 & 2032
Frequently Asked Questions
1. What is the projected Compound Annual Growth Rate (CAGR) of the Asia Pacific Oilfield Services Industry?
The projected CAGR is approximately > 3.00%.
2. Which companies are prominent players in the Asia Pacific Oilfield Services Industry?
Key companies in the market include Superior Energy Services Inc, Archer Limited, National Oilwell Varco Inc, Baker Hughes Co, Schlumberger Ltd, Petrofac Limited, Expro Group, Weatherford International PLC, Halliburton Co.
3. What are the main segments of the Asia Pacific Oilfield Services Industry?
The market segments include Location of Deployment, Service Type, Geography.
4. Can you provide details about the market size?
The market size is estimated to be USD XX Million as of 2022.
5. What are some drivers contributing to market growth?
4.; Increasing Development of Gas Reserves and Advanced Technology. Tools. and Equipment4.; Increasing Investment in the Oilfield Services across World.
6. What are the notable trends driving market growth?
Drilling Services to Dominate the Market.
7. Are there any restraints impacting market growth?
4.; The Volatile Oil Prices Over the Recent Period. Owing to the Supply-Demand Gap.
8. Can you provide examples of recent developments in the market?
November 2022: Velesto Energy, a Malaysian company, signed an integrated rig, drilling, and completion services deal with Hess Corp. for USD 135 million. The i-RDC is a concept in which integration of drilling rig services, equipment, and in some cases, procurement of materials for drilling and completion services is covered under a single contract between the operator or oil company, as the owner of the project, and a service company, which serves as the i-RDC contractor.
9. What pricing options are available for accessing the report?
Pricing options include single-user, multi-user, and enterprise licenses priced at USD 4750, USD 5250, and USD 8750 respectively.
10. Is the market size provided in terms of value or volume?
The market size is provided in terms of value, measured in Million.
11. Are there any specific market keywords associated with the report?
Yes, the market keyword associated with the report is "Asia Pacific Oilfield Services Industry," which aids in identifying and referencing the specific market segment covered.
12. How do I determine which pricing option suits my needs best?
The pricing options vary based on user requirements and access needs. Individual users may opt for single-user licenses, while businesses requiring broader access may choose multi-user or enterprise licenses for cost-effective access to the report.
13. Are there any additional resources or data provided in the Asia Pacific Oilfield Services Industry report?
While the report offers comprehensive insights, it's advisable to review the specific contents or supplementary materials provided to ascertain if additional resources or data are available.
14. How can I stay updated on further developments or reports in the Asia Pacific Oilfield Services Industry?
To stay informed about further developments, trends, and reports in the Asia Pacific Oilfield Services Industry, consider subscribing to industry newsletters, following relevant companies and organizations, or regularly checking reputable industry news sources and publications.
Methodology
Step 1 - Identification of Relevant Samples Size from Population Database


Step 2 - Approaches for Defining Global Market Size (Value, Volume* & Price*)

Note*: In applicable scenarios
Step 3 - Data Sources
Primary Research
- Web Analytics
- Survey Reports
- Research Institute
- Latest Research Reports
- Opinion Leaders
Secondary Research
- Annual Reports
- White Paper
- Latest Press Release
- Industry Association
- Paid Database
- Investor Presentations

Step 4 - Data Triangulation
Involves using different sources of information in order to increase the validity of a study
These sources are likely to be stakeholders in a program - participants, other researchers, program staff, other community members, and so on.
Then we put all data in single framework & apply various statistical tools to find out the dynamic on the market.
During the analysis stage, feedback from the stakeholder groups would be compared to determine areas of agreement as well as areas of divergence
