

Key Insights
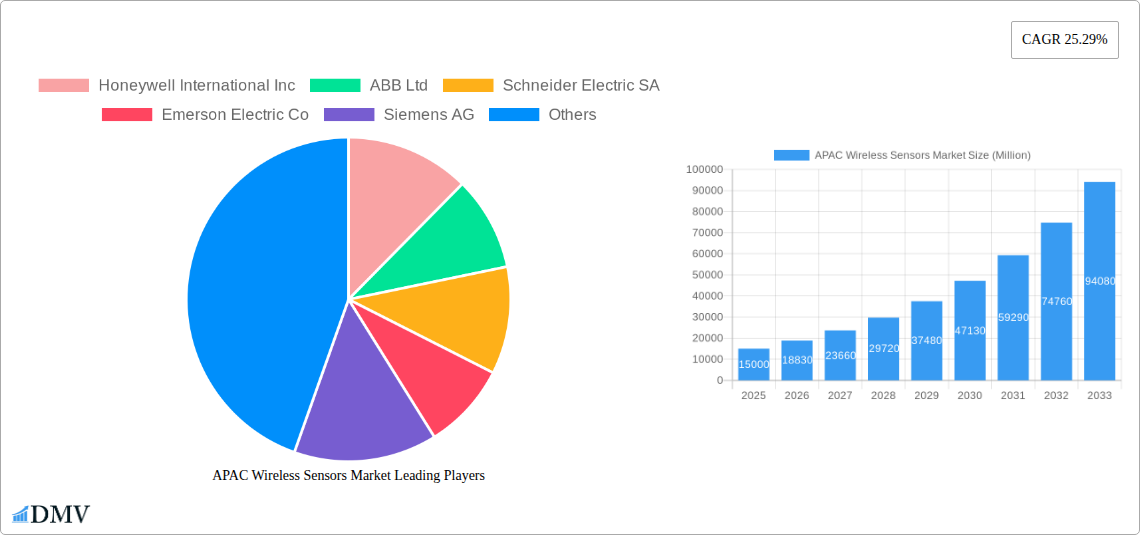
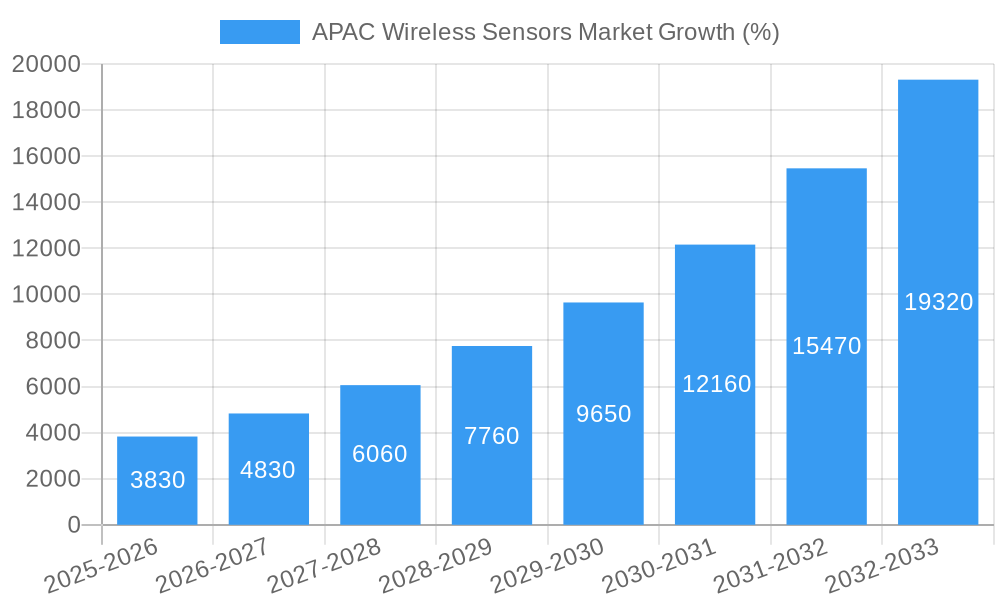
The Asia-Pacific (APAC) wireless sensor market is experiencing robust growth, driven by the increasing adoption of Industry 4.0 technologies and the burgeoning demand for smart infrastructure across various sectors. The region's diverse industrial landscape, coupled with significant investments in digital transformation initiatives, is fueling this expansion. The 25.29% CAGR indicates a substantial market expansion, exceeding global averages, and points to a large potential for further growth. Key drivers include the rising need for real-time data monitoring and analysis in manufacturing, healthcare, and energy sectors; the increasing demand for improved operational efficiency and reduced downtime; and the proliferation of smart cities and connected devices. Specific segments within the APAC wireless sensor market witnessing accelerated growth include those related to industrial automation, smart agriculture, and environmental monitoring. China, Japan, and India are the major contributors to this market growth, driven by their large industrial bases, expanding digital infrastructure, and supportive government policies. However, factors such as high initial investment costs, cybersecurity concerns, and the need for robust communication infrastructure could pose challenges to the market’s continued expansion.
Looking ahead, the APAC wireless sensor market is poised for significant expansion throughout the forecast period (2025-2033). While precise figures for individual country market shares and specific segment values are unavailable, the substantial CAGR and regional dynamics strongly suggest continued dominance of China, Japan, and India. The increasing integration of wireless sensors into Internet of Things (IoT) applications and the development of more energy-efficient and cost-effective sensor technologies will further propel market growth. The automotive and healthcare sectors will likely remain key application areas, with emerging applications in smart agriculture and environmental monitoring contributing to the overall growth trajectory. Companies should strategically focus on innovation, developing advanced sensor technologies, and establishing strong partnerships to capitalize on the considerable opportunities within this dynamic market.
APAC Wireless Sensors Market: A Comprehensive Market Report (2019-2033)
This insightful report provides a detailed analysis of the Asia-Pacific (APAC) wireless sensors market, offering a comprehensive overview of its current state, future trajectory, and key players. Covering the period from 2019 to 2033, with 2025 as the base year, this report is essential for stakeholders seeking to understand and capitalize on the growth opportunities within this dynamic market. The APAC region's burgeoning technological advancements and expanding industrial sectors are driving significant demand, creating a lucrative landscape ripe for investment and innovation. The market is projected to reach xx Million by 2033.
APAC Wireless Sensors Market Composition & Trends
This section delves into the competitive landscape of the APAC wireless sensors market, analyzing market concentration, innovation drivers, regulatory frameworks, substitute products, end-user profiles, and merger & acquisition (M&A) activities. The market is characterized by a moderately concentrated landscape with key players such as Honeywell International Inc, ABB Ltd, and Schneider Electric SA holding significant market share. However, the entry of several innovative startups is increasing competition and driving innovation.
- Market Share Distribution: Honeywell International Inc. holds an estimated xx% market share in 2025, followed by ABB Ltd. with xx% and Schneider Electric SA with xx%. Smaller players collectively account for the remaining xx%.
- M&A Activity: The APAC wireless sensors market has witnessed significant M&A activity in recent years, with deal values totaling approximately xx Million in the past five years. These activities have primarily focused on expanding product portfolios and geographical reach.
- Innovation Catalysts: The increasing adoption of IoT technologies, advancements in sensor miniaturization, and the demand for real-time data analytics are key drivers of innovation.
- Regulatory Landscape: Government regulations promoting industrial automation and smart city initiatives are positively impacting market growth. However, data privacy concerns and cybersecurity regulations represent potential challenges.
- Substitute Products: Wired sensors remain a viable alternative, but their limitations in terms of flexibility and scalability are driving the adoption of wireless alternatives.
- End-User Profiles: Key end-user industries include automotive, healthcare, aerospace and defense, energy and power, oil and gas, and food and beverage.
APAC Wireless Sensors Market Industry Evolution
This section provides a detailed analysis of the APAC wireless sensors market's growth trajectory, technological advancements, and evolving consumer demands from 2019 to 2033. The market has experienced significant growth driven by the increasing adoption of smart devices, the growth of the Internet of Things (IoT), and the rising demand for industrial automation. This is further fueled by technological advancements such as the development of low-power, long-range wireless communication technologies and the emergence of miniaturized, highly sensitive sensors.
The market is expected to maintain a Compound Annual Growth Rate (CAGR) of xx% during the forecast period (2025-2033), driven primarily by the increasing demand for wireless sensor solutions across various industries. Adoption rates are accelerating across all segments, with particularly strong growth in the automotive, healthcare, and energy sectors. The shift toward Industry 4.0 and the increasing need for real-time data monitoring and analysis are contributing significantly to the market's expansion. Furthermore, government initiatives promoting smart cities and industrial automation are boosting demand for wireless sensors in the region.
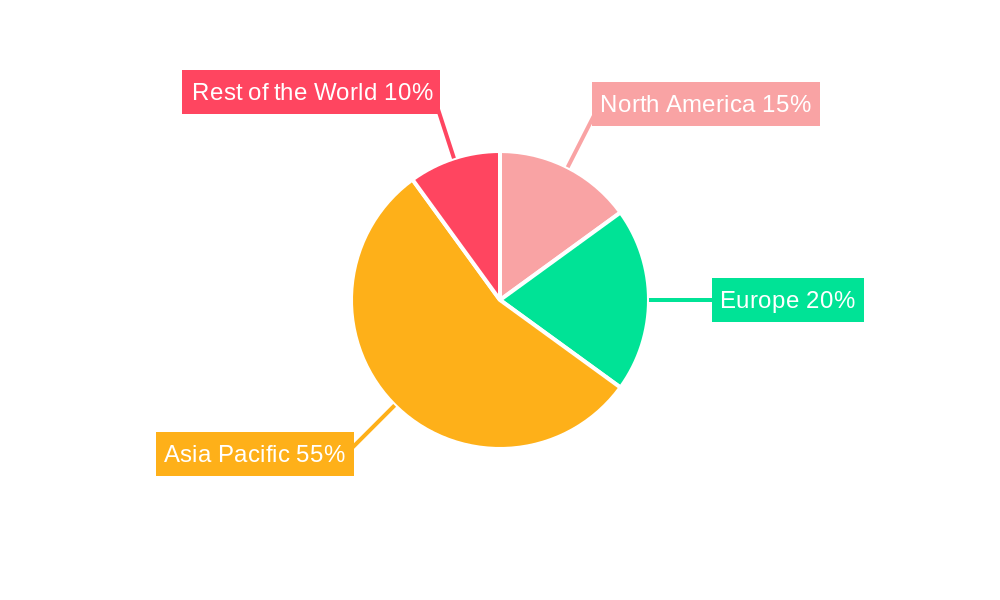
Leading Regions, Countries, or Segments in APAC Wireless Sensors Market
China dominates the APAC wireless sensors market, followed by Japan and India. This dominance is driven by factors including robust industrial growth, significant investments in infrastructure development, and supportive government policies.
Key Drivers:
- China: Massive investments in infrastructure, including smart cities and industrial automation projects, are driving exceptional growth. Government support for technological innovation further fuels market expansion.
- Japan: Strong technological capabilities and a high concentration of manufacturing industries create a significant demand for advanced wireless sensor technologies.
- India: The rapid growth of the manufacturing and IT sectors, coupled with increasing government investments in infrastructure and smart city initiatives, is fueling market expansion.
Dominance Factors:
- High industrial output and manufacturing activity: The manufacturing sector's dominance in these countries creates a huge demand for efficient monitoring and automation solutions, driving wireless sensor adoption.
- Government initiatives: Government support for technological advancements, including significant investments in smart city projects and digitalization initiatives, further boosts market growth.
- Technological advancements: These regions are at the forefront of technological innovation, fostering the development and adoption of cutting-edge wireless sensor technologies.
Segment Dominance:
Among sensor types, the pressure and temperature sensor segments currently hold the largest market share, driven by their widespread applications across diverse industries. However, the image sensor segment is experiencing the fastest growth due to the rising demand for advanced surveillance and automation systems. In terms of industry, the automotive, energy, and healthcare sectors show the highest demand for wireless sensors.
APAP Wireless Sensors Market Product Innovations
Recent innovations in wireless sensors include the development of battery-free sensors, leveraging energy harvesting technologies to eliminate the need for battery replacements. This reduces maintenance costs and expands deployment possibilities. Advancements in miniaturization and improved sensor accuracy are also enhancing performance metrics. Unique selling propositions focus on low power consumption, extended battery life, increased range and improved data security. Integration with cloud platforms for data analytics provides additional value.
Propelling Factors for APAC Wireless Sensors Market Growth
Several factors propel the growth of the APAC wireless sensors market. Technological advancements, particularly in low-power wide-area networks (LPWANs) and energy-harvesting technologies, are expanding the range and capabilities of wireless sensors. Economic growth in the region, particularly in emerging economies, is driving industrialization and urbanization, creating significant demand for wireless sensor-based solutions. Moreover, supportive government policies promoting smart cities and industrial automation are further boosting market growth. The increasing need for real-time monitoring and data analytics across various industries also plays a crucial role.
Obstacles in the APAC Wireless Sensors Market
Despite the significant growth potential, the APAC wireless sensors market faces several challenges. Interoperability issues between different wireless sensor networks can hinder seamless data integration. Supply chain disruptions and the increasing cost of raw materials can impact production costs and profitability. Furthermore, concerns around data security and privacy, coupled with stringent regulatory requirements, create hurdles for market expansion. Finally, intense competition from established players and the emergence of new entrants can exert pressure on pricing and profitability.
Future Opportunities in APAC Wireless Sensors Market
The APAC wireless sensors market presents numerous future opportunities. The expanding adoption of 5G technology will enable higher bandwidth and lower latency communication, creating opportunities for advanced sensor applications. The growth of IoT and Industry 4.0 will further fuel demand for wireless sensors across various sectors. Emerging applications in precision agriculture, smart healthcare, and environmental monitoring offer significant growth potential. Finally, the development of more energy-efficient and cost-effective wireless sensor technologies will further expand the market's reach.
Major Players in the APAC Wireless Sensors Market Ecosystem
- Honeywell International Inc
- ABB Ltd
- Schneider Electric SA
- Emerson Electric Co
- Siemens AG
- STMicroelectronics
- Texas Instruments Incorporated
- Rockwell Automation Inc
- Yokogawa Electric Corporation
- Endress+Hauser SA
- General Electric
Key Developments in APAC Wireless Sensors Market Industry
- July 2021: SoftBank Group Corp.'s Vision Fund 2 invested USD 200 Million in Wiliot Inc., accelerating the development and adoption of battery-free sensor tags for manufacturing and logistics. This significantly impacts the market by introducing cost-effective and easily deployable solutions, thereby broadening market reach.
- May 2021: Lutron Electronics launched the Vive wireless lighting control system in India, catering to diverse project types. This expansion into new markets and application areas demonstrates the growing demand for wireless control systems and underscores the market's potential for further growth.
Strategic APAC Wireless Sensors Market Forecast
The APAC wireless sensors market is poised for substantial growth over the next decade. Continued technological innovation, coupled with increasing government investments in smart infrastructure and industrial automation, will fuel market expansion. The rising adoption of IoT technologies across various sectors, including automotive, healthcare, and energy, will create significant demand for wireless sensor solutions. The market's future success hinges on overcoming challenges related to interoperability, data security, and supply chain resilience. However, the overall outlook for the APAC wireless sensors market remains highly positive, promising significant growth and opportunities for investors and industry players.
APAC Wireless Sensors Market Segmentation
-
1. Type of Sensor
- 1.1. Pressure
- 1.2. Temperature
- 1.3. Image
- 1.4. Flow
- 1.5. Chemical and Gas
- 1.6. Position and Proximity
- 1.7. Others
-
2. Industry
- 2.1. Automotive
- 2.2. Healthcare
- 2.3. Aerospace and Defense
- 2.4. Energy and Power
- 2.5. Oil and Gas
- 2.6. Food and Beverage
- 2.7. Others
APAC Wireless Sensors Market Segmentation By Geography
-
1. North America
- 1.1. United States
- 1.2. Canada
- 1.3. Mexico
-
2. South America
- 2.1. Brazil
- 2.2. Argentina
- 2.3. Rest of South America
-
3. Europe
- 3.1. United Kingdom
- 3.2. Germany
- 3.3. France
- 3.4. Italy
- 3.5. Spain
- 3.6. Russia
- 3.7. Benelux
- 3.8. Nordics
- 3.9. Rest of Europe
-
4. Middle East & Africa
- 4.1. Turkey
- 4.2. Israel
- 4.3. GCC
- 4.4. North Africa
- 4.5. South Africa
- 4.6. Rest of Middle East & Africa
-
5. Asia Pacific
- 5.1. China
- 5.2. India
- 5.3. Japan
- 5.4. South Korea
- 5.5. ASEAN
- 5.6. Oceania
- 5.7. Rest of Asia Pacific
APAC Wireless Sensors Market REPORT HIGHLIGHTS
| Aspects | Details |
|---|---|
| Study Period | 2019-2033 |
| Base Year | 2024 |
| Estimated Year | 2025 |
| Forecast Period | 2025-2033 |
| Historical Period | 2019-2024 |
| Growth Rate | CAGR of 25.29% from 2019-2033 |
| Segmentation |
|
Table of Contents
- 1. Introduction
- 1.1. Research Scope
- 1.2. Market Segmentation
- 1.3. Research Methodology
- 1.4. Definitions and Assumptions
- 2. Executive Summary
- 2.1. Introduction
- 3. Market Dynamics
- 3.1. Introduction
- 3.2. Market Drivers
- 3.2.1. Increasing Adoption of Wireless Technologies (especially in harsh environments); Emergence of Smart Factory Concepts (Industrial Automation)
- 3.3. Market Restrains
- 3.3.1. Bandwidth Contraints and Compatibility Issues due to Variety of Standards
- 3.4. Market Trends
- 3.4.1. Increasing Adoption of Smart Factories
- 4. Market Factor Analysis
- 4.1. Porters Five Forces
- 4.2. Supply/Value Chain
- 4.3. PESTEL analysis
- 4.4. Market Entropy
- 4.5. Patent/Trademark Analysis
- 5. Global APAC Wireless Sensors Market Analysis, Insights and Forecast, 2019-2031
- 5.1. Market Analysis, Insights and Forecast - by Type of Sensor
- 5.1.1. Pressure
- 5.1.2. Temperature
- 5.1.3. Image
- 5.1.4. Flow
- 5.1.5. Chemical and Gas
- 5.1.6. Position and Proximity
- 5.1.7. Others
- 5.2. Market Analysis, Insights and Forecast - by Industry
- 5.2.1. Automotive
- 5.2.2. Healthcare
- 5.2.3. Aerospace and Defense
- 5.2.4. Energy and Power
- 5.2.5. Oil and Gas
- 5.2.6. Food and Beverage
- 5.2.7. Others
- 5.3. Market Analysis, Insights and Forecast - by Region
- 5.3.1. North America
- 5.3.2. South America
- 5.3.3. Europe
- 5.3.4. Middle East & Africa
- 5.3.5. Asia Pacific
- 5.1. Market Analysis, Insights and Forecast - by Type of Sensor
- 6. North America APAC Wireless Sensors Market Analysis, Insights and Forecast, 2019-2031
- 6.1. Market Analysis, Insights and Forecast - by Type of Sensor
- 6.1.1. Pressure
- 6.1.2. Temperature
- 6.1.3. Image
- 6.1.4. Flow
- 6.1.5. Chemical and Gas
- 6.1.6. Position and Proximity
- 6.1.7. Others
- 6.2. Market Analysis, Insights and Forecast - by Industry
- 6.2.1. Automotive
- 6.2.2. Healthcare
- 6.2.3. Aerospace and Defense
- 6.2.4. Energy and Power
- 6.2.5. Oil and Gas
- 6.2.6. Food and Beverage
- 6.2.7. Others
- 6.1. Market Analysis, Insights and Forecast - by Type of Sensor
- 7. South America APAC Wireless Sensors Market Analysis, Insights and Forecast, 2019-2031
- 7.1. Market Analysis, Insights and Forecast - by Type of Sensor
- 7.1.1. Pressure
- 7.1.2. Temperature
- 7.1.3. Image
- 7.1.4. Flow
- 7.1.5. Chemical and Gas
- 7.1.6. Position and Proximity
- 7.1.7. Others
- 7.2. Market Analysis, Insights and Forecast - by Industry
- 7.2.1. Automotive
- 7.2.2. Healthcare
- 7.2.3. Aerospace and Defense
- 7.2.4. Energy and Power
- 7.2.5. Oil and Gas
- 7.2.6. Food and Beverage
- 7.2.7. Others
- 7.1. Market Analysis, Insights and Forecast - by Type of Sensor
- 8. Europe APAC Wireless Sensors Market Analysis, Insights and Forecast, 2019-2031
- 8.1. Market Analysis, Insights and Forecast - by Type of Sensor
- 8.1.1. Pressure
- 8.1.2. Temperature
- 8.1.3. Image
- 8.1.4. Flow
- 8.1.5. Chemical and Gas
- 8.1.6. Position and Proximity
- 8.1.7. Others
- 8.2. Market Analysis, Insights and Forecast - by Industry
- 8.2.1. Automotive
- 8.2.2. Healthcare
- 8.2.3. Aerospace and Defense
- 8.2.4. Energy and Power
- 8.2.5. Oil and Gas
- 8.2.6. Food and Beverage
- 8.2.7. Others
- 8.1. Market Analysis, Insights and Forecast - by Type of Sensor
- 9. Middle East & Africa APAC Wireless Sensors Market Analysis, Insights and Forecast, 2019-2031
- 9.1. Market Analysis, Insights and Forecast - by Type of Sensor
- 9.1.1. Pressure
- 9.1.2. Temperature
- 9.1.3. Image
- 9.1.4. Flow
- 9.1.5. Chemical and Gas
- 9.1.6. Position and Proximity
- 9.1.7. Others
- 9.2. Market Analysis, Insights and Forecast - by Industry
- 9.2.1. Automotive
- 9.2.2. Healthcare
- 9.2.3. Aerospace and Defense
- 9.2.4. Energy and Power
- 9.2.5. Oil and Gas
- 9.2.6. Food and Beverage
- 9.2.7. Others
- 9.1. Market Analysis, Insights and Forecast - by Type of Sensor
- 10. Asia Pacific APAC Wireless Sensors Market Analysis, Insights and Forecast, 2019-2031
- 10.1. Market Analysis, Insights and Forecast - by Type of Sensor
- 10.1.1. Pressure
- 10.1.2. Temperature
- 10.1.3. Image
- 10.1.4. Flow
- 10.1.5. Chemical and Gas
- 10.1.6. Position and Proximity
- 10.1.7. Others
- 10.2. Market Analysis, Insights and Forecast - by Industry
- 10.2.1. Automotive
- 10.2.2. Healthcare
- 10.2.3. Aerospace and Defense
- 10.2.4. Energy and Power
- 10.2.5. Oil and Gas
- 10.2.6. Food and Beverage
- 10.2.7. Others
- 10.1. Market Analysis, Insights and Forecast - by Type of Sensor
- 11. North America APAC Wireless Sensors Market Analysis, Insights and Forecast, 2019-2031
- 11.1. Market Analysis, Insights and Forecast - By Country/Sub-region
- 11.1.1 US
- 11.1.2 Canada
- 12. Europe APAC Wireless Sensors Market Analysis, Insights and Forecast, 2019-2031
- 12.1. Market Analysis, Insights and Forecast - By Country/Sub-region
- 12.1.1 Germany
- 12.1.2 UK
- 12.1.3 France
- 12.1.4 Rest of Europe
- 13. Asia Pacific APAC Wireless Sensors Market Analysis, Insights and Forecast, 2019-2031
- 13.1. Market Analysis, Insights and Forecast - By Country/Sub-region
- 13.1.1 China
- 13.1.2 Japan
- 13.1.3 India
- 13.1.4 Rest of Asia Pacific
- 14. Rest of the world APAC Wireless Sensors Market Analysis, Insights and Forecast, 2019-2031
- 14.1. Market Analysis, Insights and Forecast - By Country/Sub-region
- 14.1.1.
- 15. Competitive Analysis
- 15.1. Global Market Share Analysis 2024
- 15.2. Company Profiles
- 15.2.1 Honeywell International Inc
- 15.2.1.1. Overview
- 15.2.1.2. Products
- 15.2.1.3. SWOT Analysis
- 15.2.1.4. Recent Developments
- 15.2.1.5. Financials (Based on Availability)
- 15.2.2 ABB Ltd
- 15.2.2.1. Overview
- 15.2.2.2. Products
- 15.2.2.3. SWOT Analysis
- 15.2.2.4. Recent Developments
- 15.2.2.5. Financials (Based on Availability)
- 15.2.3 Schneider Electric SA
- 15.2.3.1. Overview
- 15.2.3.2. Products
- 15.2.3.3. SWOT Analysis
- 15.2.3.4. Recent Developments
- 15.2.3.5. Financials (Based on Availability)
- 15.2.4 Emerson Electric Co
- 15.2.4.1. Overview
- 15.2.4.2. Products
- 15.2.4.3. SWOT Analysis
- 15.2.4.4. Recent Developments
- 15.2.4.5. Financials (Based on Availability)
- 15.2.5 Siemens AG
- 15.2.5.1. Overview
- 15.2.5.2. Products
- 15.2.5.3. SWOT Analysis
- 15.2.5.4. Recent Developments
- 15.2.5.5. Financials (Based on Availability)
- 15.2.6 STMicroelectronics
- 15.2.6.1. Overview
- 15.2.6.2. Products
- 15.2.6.3. SWOT Analysis
- 15.2.6.4. Recent Developments
- 15.2.6.5. Financials (Based on Availability)
- 15.2.7 Texas Instruments Incorporated
- 15.2.7.1. Overview
- 15.2.7.2. Products
- 15.2.7.3. SWOT Analysis
- 15.2.7.4. Recent Developments
- 15.2.7.5. Financials (Based on Availability)
- 15.2.8 Rockwell Automation Inc
- 15.2.8.1. Overview
- 15.2.8.2. Products
- 15.2.8.3. SWOT Analysis
- 15.2.8.4. Recent Developments
- 15.2.8.5. Financials (Based on Availability)
- 15.2.9 Yokogawa Electric Corporation
- 15.2.9.1. Overview
- 15.2.9.2. Products
- 15.2.9.3. SWOT Analysis
- 15.2.9.4. Recent Developments
- 15.2.9.5. Financials (Based on Availability)
- 15.2.10 Endress+Hauser SA
- 15.2.10.1. Overview
- 15.2.10.2. Products
- 15.2.10.3. SWOT Analysis
- 15.2.10.4. Recent Developments
- 15.2.10.5. Financials (Based on Availability)
- 15.2.11 General Electric
- 15.2.11.1. Overview
- 15.2.11.2. Products
- 15.2.11.3. SWOT Analysis
- 15.2.11.4. Recent Developments
- 15.2.11.5. Financials (Based on Availability)
- 15.2.1 Honeywell International Inc
List of Figures
- Figure 1: Global APAC Wireless Sensors Market Revenue Breakdown (Million, %) by Region 2024 & 2032
- Figure 2: Global APAC Wireless Sensors Market Volume Breakdown (K Units, %) by Region 2024 & 2032
- Figure 3: North America APAC Wireless Sensors Market Revenue (Million), by Country 2024 & 2032
- Figure 4: North America APAC Wireless Sensors Market Volume (K Units), by Country 2024 & 2032
- Figure 5: North America APAC Wireless Sensors Market Revenue Share (%), by Country 2024 & 2032
- Figure 6: North America APAC Wireless Sensors Market Volume Share (%), by Country 2024 & 2032
- Figure 7: Europe APAC Wireless Sensors Market Revenue (Million), by Country 2024 & 2032
- Figure 8: Europe APAC Wireless Sensors Market Volume (K Units), by Country 2024 & 2032
- Figure 9: Europe APAC Wireless Sensors Market Revenue Share (%), by Country 2024 & 2032
- Figure 10: Europe APAC Wireless Sensors Market Volume Share (%), by Country 2024 & 2032
- Figure 11: Asia Pacific APAC Wireless Sensors Market Revenue (Million), by Country 2024 & 2032
- Figure 12: Asia Pacific APAC Wireless Sensors Market Volume (K Units), by Country 2024 & 2032
- Figure 13: Asia Pacific APAC Wireless Sensors Market Revenue Share (%), by Country 2024 & 2032
- Figure 14: Asia Pacific APAC Wireless Sensors Market Volume Share (%), by Country 2024 & 2032
- Figure 15: Rest of the world APAC Wireless Sensors Market Revenue (Million), by Country 2024 & 2032
- Figure 16: Rest of the world APAC Wireless Sensors Market Volume (K Units), by Country 2024 & 2032
- Figure 17: Rest of the world APAC Wireless Sensors Market Revenue Share (%), by Country 2024 & 2032
- Figure 18: Rest of the world APAC Wireless Sensors Market Volume Share (%), by Country 2024 & 2032
- Figure 19: North America APAC Wireless Sensors Market Revenue (Million), by Type of Sensor 2024 & 2032
- Figure 20: North America APAC Wireless Sensors Market Volume (K Units), by Type of Sensor 2024 & 2032
- Figure 21: North America APAC Wireless Sensors Market Revenue Share (%), by Type of Sensor 2024 & 2032
- Figure 22: North America APAC Wireless Sensors Market Volume Share (%), by Type of Sensor 2024 & 2032
- Figure 23: North America APAC Wireless Sensors Market Revenue (Million), by Industry 2024 & 2032
- Figure 24: North America APAC Wireless Sensors Market Volume (K Units), by Industry 2024 & 2032
- Figure 25: North America APAC Wireless Sensors Market Revenue Share (%), by Industry 2024 & 2032
- Figure 26: North America APAC Wireless Sensors Market Volume Share (%), by Industry 2024 & 2032
- Figure 27: North America APAC Wireless Sensors Market Revenue (Million), by Country 2024 & 2032
- Figure 28: North America APAC Wireless Sensors Market Volume (K Units), by Country 2024 & 2032
- Figure 29: North America APAC Wireless Sensors Market Revenue Share (%), by Country 2024 & 2032
- Figure 30: North America APAC Wireless Sensors Market Volume Share (%), by Country 2024 & 2032
- Figure 31: South America APAC Wireless Sensors Market Revenue (Million), by Type of Sensor 2024 & 2032
- Figure 32: South America APAC Wireless Sensors Market Volume (K Units), by Type of Sensor 2024 & 2032
- Figure 33: South America APAC Wireless Sensors Market Revenue Share (%), by Type of Sensor 2024 & 2032
- Figure 34: South America APAC Wireless Sensors Market Volume Share (%), by Type of Sensor 2024 & 2032
- Figure 35: South America APAC Wireless Sensors Market Revenue (Million), by Industry 2024 & 2032
- Figure 36: South America APAC Wireless Sensors Market Volume (K Units), by Industry 2024 & 2032
- Figure 37: South America APAC Wireless Sensors Market Revenue Share (%), by Industry 2024 & 2032
- Figure 38: South America APAC Wireless Sensors Market Volume Share (%), by Industry 2024 & 2032
- Figure 39: South America APAC Wireless Sensors Market Revenue (Million), by Country 2024 & 2032
- Figure 40: South America APAC Wireless Sensors Market Volume (K Units), by Country 2024 & 2032
- Figure 41: South America APAC Wireless Sensors Market Revenue Share (%), by Country 2024 & 2032
- Figure 42: South America APAC Wireless Sensors Market Volume Share (%), by Country 2024 & 2032
- Figure 43: Europe APAC Wireless Sensors Market Revenue (Million), by Type of Sensor 2024 & 2032
- Figure 44: Europe APAC Wireless Sensors Market Volume (K Units), by Type of Sensor 2024 & 2032
- Figure 45: Europe APAC Wireless Sensors Market Revenue Share (%), by Type of Sensor 2024 & 2032
- Figure 46: Europe APAC Wireless Sensors Market Volume Share (%), by Type of Sensor 2024 & 2032
- Figure 47: Europe APAC Wireless Sensors Market Revenue (Million), by Industry 2024 & 2032
- Figure 48: Europe APAC Wireless Sensors Market Volume (K Units), by Industry 2024 & 2032
- Figure 49: Europe APAC Wireless Sensors Market Revenue Share (%), by Industry 2024 & 2032
- Figure 50: Europe APAC Wireless Sensors Market Volume Share (%), by Industry 2024 & 2032
- Figure 51: Europe APAC Wireless Sensors Market Revenue (Million), by Country 2024 & 2032
- Figure 52: Europe APAC Wireless Sensors Market Volume (K Units), by Country 2024 & 2032
- Figure 53: Europe APAC Wireless Sensors Market Revenue Share (%), by Country 2024 & 2032
- Figure 54: Europe APAC Wireless Sensors Market Volume Share (%), by Country 2024 & 2032
- Figure 55: Middle East & Africa APAC Wireless Sensors Market Revenue (Million), by Type of Sensor 2024 & 2032
- Figure 56: Middle East & Africa APAC Wireless Sensors Market Volume (K Units), by Type of Sensor 2024 & 2032
- Figure 57: Middle East & Africa APAC Wireless Sensors Market Revenue Share (%), by Type of Sensor 2024 & 2032
- Figure 58: Middle East & Africa APAC Wireless Sensors Market Volume Share (%), by Type of Sensor 2024 & 2032
- Figure 59: Middle East & Africa APAC Wireless Sensors Market Revenue (Million), by Industry 2024 & 2032
- Figure 60: Middle East & Africa APAC Wireless Sensors Market Volume (K Units), by Industry 2024 & 2032
- Figure 61: Middle East & Africa APAC Wireless Sensors Market Revenue Share (%), by Industry 2024 & 2032
- Figure 62: Middle East & Africa APAC Wireless Sensors Market Volume Share (%), by Industry 2024 & 2032
- Figure 63: Middle East & Africa APAC Wireless Sensors Market Revenue (Million), by Country 2024 & 2032
- Figure 64: Middle East & Africa APAC Wireless Sensors Market Volume (K Units), by Country 2024 & 2032
- Figure 65: Middle East & Africa APAC Wireless Sensors Market Revenue Share (%), by Country 2024 & 2032
- Figure 66: Middle East & Africa APAC Wireless Sensors Market Volume Share (%), by Country 2024 & 2032
- Figure 67: Asia Pacific APAC Wireless Sensors Market Revenue (Million), by Type of Sensor 2024 & 2032
- Figure 68: Asia Pacific APAC Wireless Sensors Market Volume (K Units), by Type of Sensor 2024 & 2032
- Figure 69: Asia Pacific APAC Wireless Sensors Market Revenue Share (%), by Type of Sensor 2024 & 2032
- Figure 70: Asia Pacific APAC Wireless Sensors Market Volume Share (%), by Type of Sensor 2024 & 2032
- Figure 71: Asia Pacific APAC Wireless Sensors Market Revenue (Million), by Industry 2024 & 2032
- Figure 72: Asia Pacific APAC Wireless Sensors Market Volume (K Units), by Industry 2024 & 2032
- Figure 73: Asia Pacific APAC Wireless Sensors Market Revenue Share (%), by Industry 2024 & 2032
- Figure 74: Asia Pacific APAC Wireless Sensors Market Volume Share (%), by Industry 2024 & 2032
- Figure 75: Asia Pacific APAC Wireless Sensors Market Revenue (Million), by Country 2024 & 2032
- Figure 76: Asia Pacific APAC Wireless Sensors Market Volume (K Units), by Country 2024 & 2032
- Figure 77: Asia Pacific APAC Wireless Sensors Market Revenue Share (%), by Country 2024 & 2032
- Figure 78: Asia Pacific APAC Wireless Sensors Market Volume Share (%), by Country 2024 & 2032
List of Tables
- Table 1: Global APAC Wireless Sensors Market Revenue Million Forecast, by Region 2019 & 2032
- Table 2: Global APAC Wireless Sensors Market Volume K Units Forecast, by Region 2019 & 2032
- Table 3: Global APAC Wireless Sensors Market Revenue Million Forecast, by Type of Sensor 2019 & 2032
- Table 4: Global APAC Wireless Sensors Market Volume K Units Forecast, by Type of Sensor 2019 & 2032
- Table 5: Global APAC Wireless Sensors Market Revenue Million Forecast, by Industry 2019 & 2032
- Table 6: Global APAC Wireless Sensors Market Volume K Units Forecast, by Industry 2019 & 2032
- Table 7: Global APAC Wireless Sensors Market Revenue Million Forecast, by Region 2019 & 2032
- Table 8: Global APAC Wireless Sensors Market Volume K Units Forecast, by Region 2019 & 2032
- Table 9: Global APAC Wireless Sensors Market Revenue Million Forecast, by Country 2019 & 2032
- Table 10: Global APAC Wireless Sensors Market Volume K Units Forecast, by Country 2019 & 2032
- Table 11: US APAC Wireless Sensors Market Revenue (Million) Forecast, by Application 2019 & 2032
- Table 12: US APAC Wireless Sensors Market Volume (K Units) Forecast, by Application 2019 & 2032
- Table 13: Canada APAC Wireless Sensors Market Revenue (Million) Forecast, by Application 2019 & 2032
- Table 14: Canada APAC Wireless Sensors Market Volume (K Units) Forecast, by Application 2019 & 2032
- Table 15: Global APAC Wireless Sensors Market Revenue Million Forecast, by Country 2019 & 2032
- Table 16: Global APAC Wireless Sensors Market Volume K Units Forecast, by Country 2019 & 2032
- Table 17: Germany APAC Wireless Sensors Market Revenue (Million) Forecast, by Application 2019 & 2032
- Table 18: Germany APAC Wireless Sensors Market Volume (K Units) Forecast, by Application 2019 & 2032
- Table 19: UK APAC Wireless Sensors Market Revenue (Million) Forecast, by Application 2019 & 2032
- Table 20: UK APAC Wireless Sensors Market Volume (K Units) Forecast, by Application 2019 & 2032
- Table 21: France APAC Wireless Sensors Market Revenue (Million) Forecast, by Application 2019 & 2032
- Table 22: France APAC Wireless Sensors Market Volume (K Units) Forecast, by Application 2019 & 2032
- Table 23: Rest of Europe APAC Wireless Sensors Market Revenue (Million) Forecast, by Application 2019 & 2032
- Table 24: Rest of Europe APAC Wireless Sensors Market Volume (K Units) Forecast, by Application 2019 & 2032
- Table 25: Global APAC Wireless Sensors Market Revenue Million Forecast, by Country 2019 & 2032
- Table 26: Global APAC Wireless Sensors Market Volume K Units Forecast, by Country 2019 & 2032
- Table 27: China APAC Wireless Sensors Market Revenue (Million) Forecast, by Application 2019 & 2032
- Table 28: China APAC Wireless Sensors Market Volume (K Units) Forecast, by Application 2019 & 2032
- Table 29: Japan APAC Wireless Sensors Market Revenue (Million) Forecast, by Application 2019 & 2032
- Table 30: Japan APAC Wireless Sensors Market Volume (K Units) Forecast, by Application 2019 & 2032
- Table 31: India APAC Wireless Sensors Market Revenue (Million) Forecast, by Application 2019 & 2032
- Table 32: India APAC Wireless Sensors Market Volume (K Units) Forecast, by Application 2019 & 2032
- Table 33: Rest of Asia Pacific APAC Wireless Sensors Market Revenue (Million) Forecast, by Application 2019 & 2032
- Table 34: Rest of Asia Pacific APAC Wireless Sensors Market Volume (K Units) Forecast, by Application 2019 & 2032
- Table 35: Global APAC Wireless Sensors Market Revenue Million Forecast, by Country 2019 & 2032
- Table 36: Global APAC Wireless Sensors Market Volume K Units Forecast, by Country 2019 & 2032
- Table 37: APAC Wireless Sensors Market Revenue (Million) Forecast, by Application 2019 & 2032
- Table 38: APAC Wireless Sensors Market Volume (K Units) Forecast, by Application 2019 & 2032
- Table 39: Global APAC Wireless Sensors Market Revenue Million Forecast, by Type of Sensor 2019 & 2032
- Table 40: Global APAC Wireless Sensors Market Volume K Units Forecast, by Type of Sensor 2019 & 2032
- Table 41: Global APAC Wireless Sensors Market Revenue Million Forecast, by Industry 2019 & 2032
- Table 42: Global APAC Wireless Sensors Market Volume K Units Forecast, by Industry 2019 & 2032
- Table 43: Global APAC Wireless Sensors Market Revenue Million Forecast, by Country 2019 & 2032
- Table 44: Global APAC Wireless Sensors Market Volume K Units Forecast, by Country 2019 & 2032
- Table 45: United States APAC Wireless Sensors Market Revenue (Million) Forecast, by Application 2019 & 2032
- Table 46: United States APAC Wireless Sensors Market Volume (K Units) Forecast, by Application 2019 & 2032
- Table 47: Canada APAC Wireless Sensors Market Revenue (Million) Forecast, by Application 2019 & 2032
- Table 48: Canada APAC Wireless Sensors Market Volume (K Units) Forecast, by Application 2019 & 2032
- Table 49: Mexico APAC Wireless Sensors Market Revenue (Million) Forecast, by Application 2019 & 2032
- Table 50: Mexico APAC Wireless Sensors Market Volume (K Units) Forecast, by Application 2019 & 2032
- Table 51: Global APAC Wireless Sensors Market Revenue Million Forecast, by Type of Sensor 2019 & 2032
- Table 52: Global APAC Wireless Sensors Market Volume K Units Forecast, by Type of Sensor 2019 & 2032
- Table 53: Global APAC Wireless Sensors Market Revenue Million Forecast, by Industry 2019 & 2032
- Table 54: Global APAC Wireless Sensors Market Volume K Units Forecast, by Industry 2019 & 2032
- Table 55: Global APAC Wireless Sensors Market Revenue Million Forecast, by Country 2019 & 2032
- Table 56: Global APAC Wireless Sensors Market Volume K Units Forecast, by Country 2019 & 2032
- Table 57: Brazil APAC Wireless Sensors Market Revenue (Million) Forecast, by Application 2019 & 2032
- Table 58: Brazil APAC Wireless Sensors Market Volume (K Units) Forecast, by Application 2019 & 2032
- Table 59: Argentina APAC Wireless Sensors Market Revenue (Million) Forecast, by Application 2019 & 2032
- Table 60: Argentina APAC Wireless Sensors Market Volume (K Units) Forecast, by Application 2019 & 2032
- Table 61: Rest of South America APAC Wireless Sensors Market Revenue (Million) Forecast, by Application 2019 & 2032
- Table 62: Rest of South America APAC Wireless Sensors Market Volume (K Units) Forecast, by Application 2019 & 2032
- Table 63: Global APAC Wireless Sensors Market Revenue Million Forecast, by Type of Sensor 2019 & 2032
- Table 64: Global APAC Wireless Sensors Market Volume K Units Forecast, by Type of Sensor 2019 & 2032
- Table 65: Global APAC Wireless Sensors Market Revenue Million Forecast, by Industry 2019 & 2032
- Table 66: Global APAC Wireless Sensors Market Volume K Units Forecast, by Industry 2019 & 2032
- Table 67: Global APAC Wireless Sensors Market Revenue Million Forecast, by Country 2019 & 2032
- Table 68: Global APAC Wireless Sensors Market Volume K Units Forecast, by Country 2019 & 2032
- Table 69: United Kingdom APAC Wireless Sensors Market Revenue (Million) Forecast, by Application 2019 & 2032
- Table 70: United Kingdom APAC Wireless Sensors Market Volume (K Units) Forecast, by Application 2019 & 2032
- Table 71: Germany APAC Wireless Sensors Market Revenue (Million) Forecast, by Application 2019 & 2032
- Table 72: Germany APAC Wireless Sensors Market Volume (K Units) Forecast, by Application 2019 & 2032
- Table 73: France APAC Wireless Sensors Market Revenue (Million) Forecast, by Application 2019 & 2032
- Table 74: France APAC Wireless Sensors Market Volume (K Units) Forecast, by Application 2019 & 2032
- Table 75: Italy APAC Wireless Sensors Market Revenue (Million) Forecast, by Application 2019 & 2032
- Table 76: Italy APAC Wireless Sensors Market Volume (K Units) Forecast, by Application 2019 & 2032
- Table 77: Spain APAC Wireless Sensors Market Revenue (Million) Forecast, by Application 2019 & 2032
- Table 78: Spain APAC Wireless Sensors Market Volume (K Units) Forecast, by Application 2019 & 2032
- Table 79: Russia APAC Wireless Sensors Market Revenue (Million) Forecast, by Application 2019 & 2032
- Table 80: Russia APAC Wireless Sensors Market Volume (K Units) Forecast, by Application 2019 & 2032
- Table 81: Benelux APAC Wireless Sensors Market Revenue (Million) Forecast, by Application 2019 & 2032
- Table 82: Benelux APAC Wireless Sensors Market Volume (K Units) Forecast, by Application 2019 & 2032
- Table 83: Nordics APAC Wireless Sensors Market Revenue (Million) Forecast, by Application 2019 & 2032
- Table 84: Nordics APAC Wireless Sensors Market Volume (K Units) Forecast, by Application 2019 & 2032
- Table 85: Rest of Europe APAC Wireless Sensors Market Revenue (Million) Forecast, by Application 2019 & 2032
- Table 86: Rest of Europe APAC Wireless Sensors Market Volume (K Units) Forecast, by Application 2019 & 2032
- Table 87: Global APAC Wireless Sensors Market Revenue Million Forecast, by Type of Sensor 2019 & 2032
- Table 88: Global APAC Wireless Sensors Market Volume K Units Forecast, by Type of Sensor 2019 & 2032
- Table 89: Global APAC Wireless Sensors Market Revenue Million Forecast, by Industry 2019 & 2032
- Table 90: Global APAC Wireless Sensors Market Volume K Units Forecast, by Industry 2019 & 2032
- Table 91: Global APAC Wireless Sensors Market Revenue Million Forecast, by Country 2019 & 2032
- Table 92: Global APAC Wireless Sensors Market Volume K Units Forecast, by Country 2019 & 2032
- Table 93: Turkey APAC Wireless Sensors Market Revenue (Million) Forecast, by Application 2019 & 2032
- Table 94: Turkey APAC Wireless Sensors Market Volume (K Units) Forecast, by Application 2019 & 2032
- Table 95: Israel APAC Wireless Sensors Market Revenue (Million) Forecast, by Application 2019 & 2032
- Table 96: Israel APAC Wireless Sensors Market Volume (K Units) Forecast, by Application 2019 & 2032
- Table 97: GCC APAC Wireless Sensors Market Revenue (Million) Forecast, by Application 2019 & 2032
- Table 98: GCC APAC Wireless Sensors Market Volume (K Units) Forecast, by Application 2019 & 2032
- Table 99: North Africa APAC Wireless Sensors Market Revenue (Million) Forecast, by Application 2019 & 2032
- Table 100: North Africa APAC Wireless Sensors Market Volume (K Units) Forecast, by Application 2019 & 2032
- Table 101: South Africa APAC Wireless Sensors Market Revenue (Million) Forecast, by Application 2019 & 2032
- Table 102: South Africa APAC Wireless Sensors Market Volume (K Units) Forecast, by Application 2019 & 2032
- Table 103: Rest of Middle East & Africa APAC Wireless Sensors Market Revenue (Million) Forecast, by Application 2019 & 2032
- Table 104: Rest of Middle East & Africa APAC Wireless Sensors Market Volume (K Units) Forecast, by Application 2019 & 2032
- Table 105: Global APAC Wireless Sensors Market Revenue Million Forecast, by Type of Sensor 2019 & 2032
- Table 106: Global APAC Wireless Sensors Market Volume K Units Forecast, by Type of Sensor 2019 & 2032
- Table 107: Global APAC Wireless Sensors Market Revenue Million Forecast, by Industry 2019 & 2032
- Table 108: Global APAC Wireless Sensors Market Volume K Units Forecast, by Industry 2019 & 2032
- Table 109: Global APAC Wireless Sensors Market Revenue Million Forecast, by Country 2019 & 2032
- Table 110: Global APAC Wireless Sensors Market Volume K Units Forecast, by Country 2019 & 2032
- Table 111: China APAC Wireless Sensors Market Revenue (Million) Forecast, by Application 2019 & 2032
- Table 112: China APAC Wireless Sensors Market Volume (K Units) Forecast, by Application 2019 & 2032
- Table 113: India APAC Wireless Sensors Market Revenue (Million) Forecast, by Application 2019 & 2032
- Table 114: India APAC Wireless Sensors Market Volume (K Units) Forecast, by Application 2019 & 2032
- Table 115: Japan APAC Wireless Sensors Market Revenue (Million) Forecast, by Application 2019 & 2032
- Table 116: Japan APAC Wireless Sensors Market Volume (K Units) Forecast, by Application 2019 & 2032
- Table 117: South Korea APAC Wireless Sensors Market Revenue (Million) Forecast, by Application 2019 & 2032
- Table 118: South Korea APAC Wireless Sensors Market Volume (K Units) Forecast, by Application 2019 & 2032
- Table 119: ASEAN APAC Wireless Sensors Market Revenue (Million) Forecast, by Application 2019 & 2032
- Table 120: ASEAN APAC Wireless Sensors Market Volume (K Units) Forecast, by Application 2019 & 2032
- Table 121: Oceania APAC Wireless Sensors Market Revenue (Million) Forecast, by Application 2019 & 2032
- Table 122: Oceania APAC Wireless Sensors Market Volume (K Units) Forecast, by Application 2019 & 2032
- Table 123: Rest of Asia Pacific APAC Wireless Sensors Market Revenue (Million) Forecast, by Application 2019 & 2032
- Table 124: Rest of Asia Pacific APAC Wireless Sensors Market Volume (K Units) Forecast, by Application 2019 & 2032
Frequently Asked Questions
1. What is the projected Compound Annual Growth Rate (CAGR) of the APAC Wireless Sensors Market?
The projected CAGR is approximately 25.29%.
2. Which companies are prominent players in the APAC Wireless Sensors Market?
Key companies in the market include Honeywell International Inc, ABB Ltd, Schneider Electric SA, Emerson Electric Co, Siemens AG, STMicroelectronics, Texas Instruments Incorporated, Rockwell Automation Inc, Yokogawa Electric Corporation, Endress+Hauser SA, General Electric.
3. What are the main segments of the APAC Wireless Sensors Market?
The market segments include Type of Sensor, Industry.
4. Can you provide details about the market size?
The market size is estimated to be USD XX Million as of 2022.
5. What are some drivers contributing to market growth?
Increasing Adoption of Wireless Technologies (especially in harsh environments); Emergence of Smart Factory Concepts (Industrial Automation).
6. What are the notable trends driving market growth?
Increasing Adoption of Smart Factories.
7. Are there any restraints impacting market growth?
Bandwidth Contraints and Compatibility Issues due to Variety of Standards.
8. Can you provide examples of recent developments in the market?
July 2021: SoftBank Group Corp.'s Vision Fund 2 led a USD 200 million investment in Wiliot Inc., a semiconductor company that is developing ways to gather data in manufacturing and logistics using battery-free, stamp-sized sensor tags.
9. What pricing options are available for accessing the report?
Pricing options include single-user, multi-user, and enterprise licenses priced at USD 4750, USD 4950, and USD 6800 respectively.
10. Is the market size provided in terms of value or volume?
The market size is provided in terms of value, measured in Million and volume, measured in K Units.
11. Are there any specific market keywords associated with the report?
Yes, the market keyword associated with the report is "APAC Wireless Sensors Market," which aids in identifying and referencing the specific market segment covered.
12. How do I determine which pricing option suits my needs best?
The pricing options vary based on user requirements and access needs. Individual users may opt for single-user licenses, while businesses requiring broader access may choose multi-user or enterprise licenses for cost-effective access to the report.
13. Are there any additional resources or data provided in the APAC Wireless Sensors Market report?
While the report offers comprehensive insights, it's advisable to review the specific contents or supplementary materials provided to ascertain if additional resources or data are available.
14. How can I stay updated on further developments or reports in the APAC Wireless Sensors Market?
To stay informed about further developments, trends, and reports in the APAC Wireless Sensors Market, consider subscribing to industry newsletters, following relevant companies and organizations, or regularly checking reputable industry news sources and publications.
Methodology
Step 1 - Identification of Relevant Samples Size from Population Database


Step 2 - Approaches for Defining Global Market Size (Value, Volume* & Price*)

Note*: In applicable scenarios
Step 3 - Data Sources
Primary Research
- Web Analytics
- Survey Reports
- Research Institute
- Latest Research Reports
- Opinion Leaders
Secondary Research
- Annual Reports
- White Paper
- Latest Press Release
- Industry Association
- Paid Database
- Investor Presentations

Step 4 - Data Triangulation
Involves using different sources of information in order to increase the validity of a study
These sources are likely to be stakeholders in a program - participants, other researchers, program staff, other community members, and so on.
Then we put all data in single framework & apply various statistical tools to find out the dynamic on the market.
During the analysis stage, feedback from the stakeholder groups would be compared to determine areas of agreement as well as areas of divergence
