

Key Insights
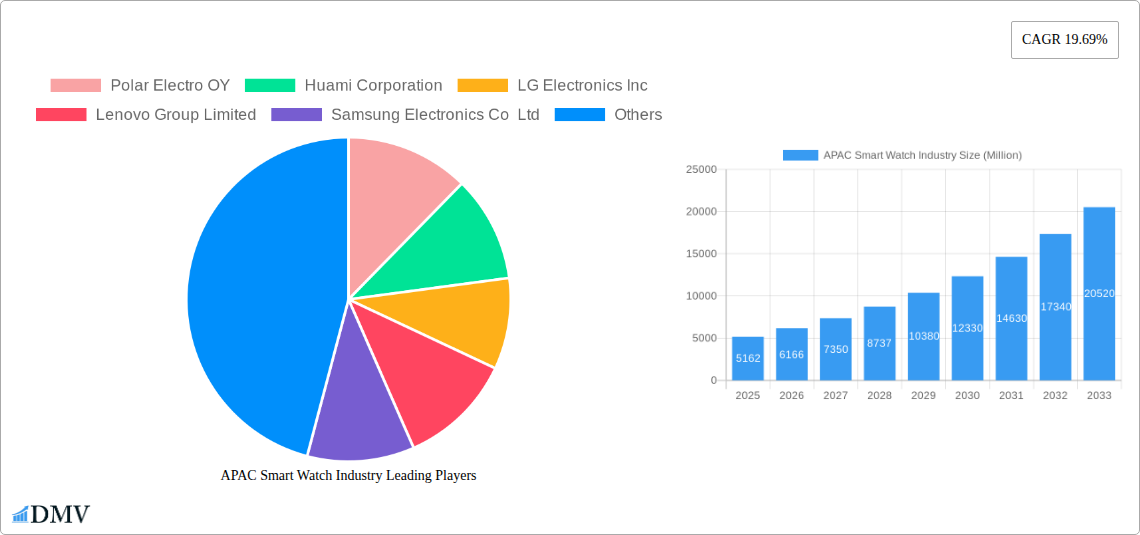
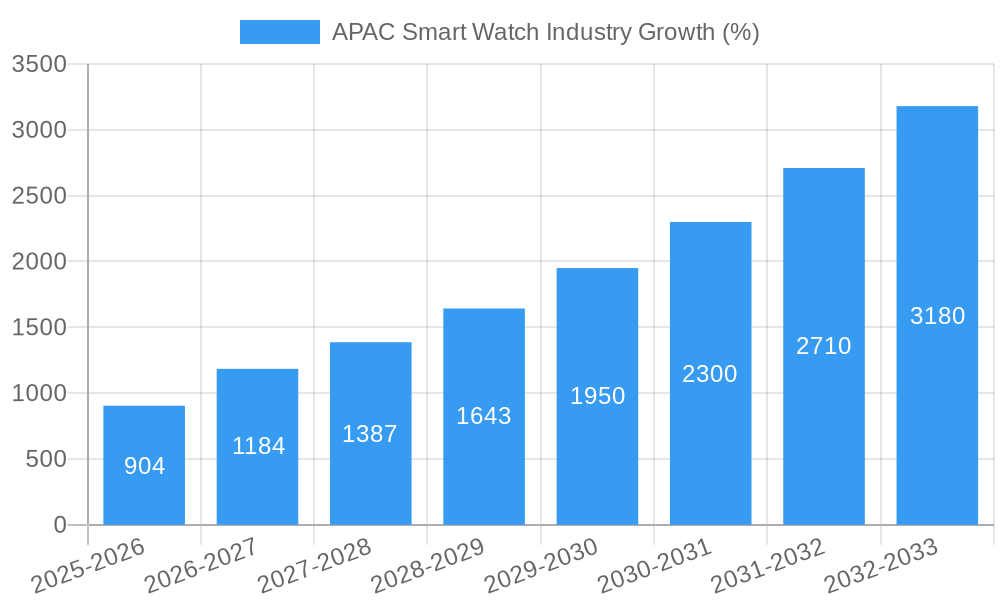
The Asia-Pacific (APAC) smartwatch market, a dynamic and rapidly expanding sector, is projected to experience significant growth throughout the forecast period (2025-2033). Driven by increasing disposable incomes, rising smartphone penetration, and a growing preference for wearable technology, the region is poised to become a key player in the global smartwatch market. The strong CAGR of 19.69% indicates a robust expansion, fueled by several factors. Firstly, the increasing adoption of health and fitness tracking features in smartwatches is attracting a wider consumer base. Secondly, the growing integration of smartwatches with various applications, including personal assistance, medical monitoring, and sports performance tracking, expands the market's potential. China, India, and Japan are expected to be the primary growth drivers within APAC, owing to their large populations, expanding middle classes, and increasing technological advancements. However, challenges remain; price sensitivity in certain market segments and competition from established players could impact growth. The market is segmented by operating systems (WatchOS, Wear OS, others), display types (AMOLED, PMOLED, TFT LCD), applications (personal assistance, medical, sports, others), and individual countries. This segmentation highlights the diverse nature of the market and the opportunities for targeted marketing strategies. The proliferation of affordable and feature-rich smartwatches from companies like Xiaomi and Huami is further bolstering market penetration.
The competitive landscape is highly dynamic, with both established international brands (Apple, Samsung, Garmin) and regional players (Xiaomi, Huami) vying for market share. Strategic partnerships, technological innovations, and aggressive pricing strategies are key competitive factors. The forecast period will likely see further consolidation within the industry, with major players investing heavily in research and development to enhance functionality and design. The focus on improving battery life, enhancing health monitoring capabilities, and integrating seamless connectivity with smartphones will remain critical for success. Furthermore, the growing adoption of 5G technology is expected to further accelerate the growth trajectory of the APAC smartwatch market by enabling faster data transfer and improved application performance. Ultimately, the APAC smartwatch market is projected to witness impressive growth, driven by favorable demographics, technological innovation, and increasing consumer demand.
APAC Smart Watch Industry Market Report: 2019-2033
This comprehensive report provides an in-depth analysis of the Asia-Pacific (APAC) smart watch industry, offering invaluable insights for stakeholders seeking to navigate this dynamic market. Covering the period 2019-2033, with a focus on 2025, this report unveils crucial trends, identifies key players, and forecasts future growth. The report's meticulous research incorporates data on market size, segmentation, and competitive landscape, providing a holistic view of this rapidly evolving sector. The total market value is projected to reach xx Million by 2033.
APAC Smart Watch Industry Market Composition & Trends
This section delves into the competitive landscape of the APAC smart watch market, examining market concentration, innovation drivers, regulatory frameworks, substitute products, end-user profiles, and mergers & acquisitions (M&A) activities. The market exhibits a moderately concentrated structure, with key players holding significant shares. Innovation is driven by advancements in sensor technology, improved battery life, and the integration of health and fitness features. Regulatory landscapes vary across APAC countries, impacting device approvals and data privacy. Substitute products include traditional wristwatches and fitness trackers, while the end-user profile encompasses diverse demographics, including fitness enthusiasts, professionals, and the elderly. M&A activity has been relatively moderate in recent years, with deal values averaging xx Million.
- Market Share Distribution (2024): Apple Inc. (xx%), Xiaomi Corporation (xx%), Samsung Electronics Co Ltd (xx%), Others (xx%).
- Average M&A Deal Value (2019-2024): xx Million
- Key Innovation Catalysts: Advanced sensor technology, AI-powered health analytics, improved battery technology.
- Regulatory Focus: Data privacy, device certification, health claims regulations.
APAC Smart Watch Industry Industry Evolution
The APAC smart watch industry has witnessed exponential growth over the past few years, driven by increasing smartphone penetration, rising health consciousness, and technological advancements. The market transitioned from basic fitness trackers to sophisticated devices integrating advanced health monitoring capabilities, contactless payment systems, and improved aesthetics. Consumer demand has shifted towards feature-rich, stylish devices offering seamless integration with smartphones and other smart devices. Growth is projected to continue at a Compound Annual Growth Rate (CAGR) of xx% during the forecast period (2025-2033), reaching xx Million by 2033. Adoption rates are highest in urban areas with high disposable incomes, reflecting the influence of socio-economic factors on market penetration.
Leading Regions, Countries, or Segments in APAC Smart Watch Industry
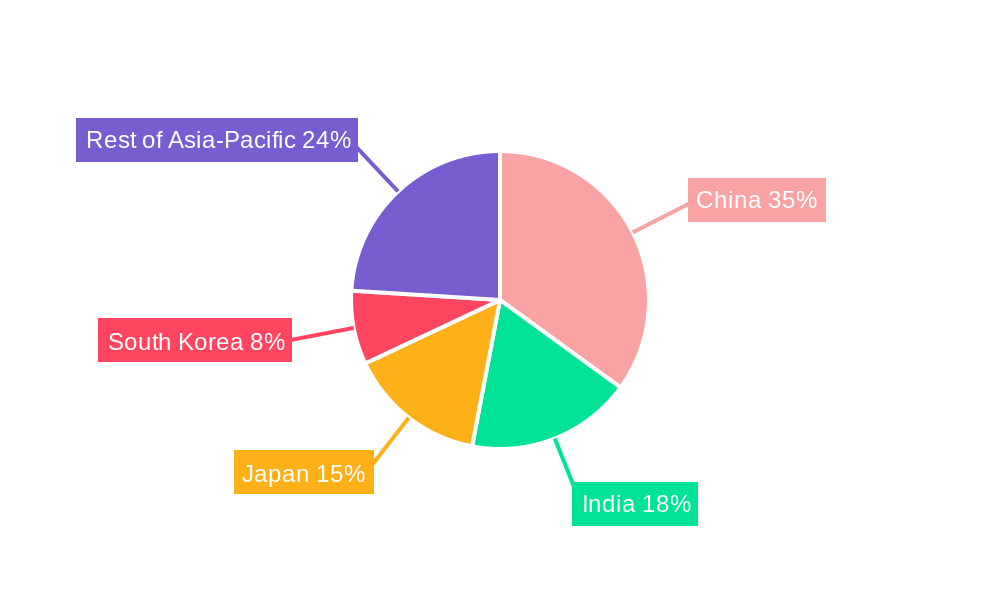
China remains the dominant market for smartwatches in APAC, driven by a large consumer base, robust domestic manufacturing, and high smartphone penetration. Other significant markets include India, South Korea, and Japan. Within segments, Android/Wear OS holds the largest market share by operating system, reflecting the broader adoption of Android smartphones. AMOLED displays are gaining popularity due to superior visual quality, while the personal assistance application segment continues to lead, although the medical and sports applications are growing rapidly.
- Key Drivers for China's Dominance: Large consumer base, strong domestic manufacturing, government support for tech innovation.
- Key Drivers for India's Growth: Rising smartphone penetration, increasing disposable incomes, young population.
- AMOLED Display Growth: Superior image quality, energy efficiency.
- Personal Assistance Application Dominance: Convenience, communication, notification management.
APAC Smart Watch Industry Product Innovations
Recent product innovations in the APAC smart watch market focus on enhanced health tracking features, longer battery life, and improved design aesthetics. Smartwatches are incorporating advanced sensors for ECG, SpO2, and sleep monitoring. Integration with various health and fitness applications through APIs has broadened the scope of applications. Unique selling propositions include personalized fitness coaching, AI-powered health analytics, and advanced customization options.
Propelling Factors for APAC Smart Watch Industry Growth
Growth in the APAC smart watch industry is fueled by several factors. Technological advancements like improved sensor technology and longer battery life enhance user experience. Rising disposable incomes and increasing health awareness among consumers drive demand. Government initiatives promoting digital health and technological innovation further support industry growth.
Obstacles in the APAP Smart Watch Industry Market
The APAC smart watch market faces challenges such as supply chain disruptions, intense competition, and concerns about data privacy. These disruptions have led to price volatility and reduced product availability. Stringent regulatory requirements for data security and device certification also pose a barrier to market entry for new players. The intense competition among established brands and new entrants puts downward pressure on profit margins.
Future Opportunities in APAC Smart Watch Industry
Future opportunities lie in the expansion of the market into underserved areas, the development of innovative applications in healthcare and wellness, and the integration of smartwatches with other IoT devices. New technologies such as advanced materials, flexible displays, and improved energy storage will drive product innovation. The focus on personalized healthcare solutions and integration with other wearable devices presents significant market expansion potential.
Major Players in the APAC Smart Watch Industry Ecosystem
- Polar Electro OY
- Huami Corporation
- LG Electronics Inc
- Lenovo Group Limited
- Samsung Electronics Co Ltd
- Garmin Ltd
- Fitbit Inc
- Huawei Technologies Co Ltd
- Xiaomi Corporation
- Fossil Group Inc
- Apple Inc
- Sony Corporation
Key Developments in APAC Smart Watch Industry Industry
- August 2022: Fitbit launched its Sense 2 and Versa 4 smartwatches, enhancing health monitoring capabilities.
- November 2022: Xiaomi launched its Watch S2 in China, showcasing its expansion in the premium segment.
Strategic APAC Smart Watch Industry Market Forecast
The APAC smart watch market is poised for sustained growth, driven by technological advancements, rising consumer demand, and expanding applications. The market's future trajectory is shaped by ongoing innovations in health monitoring, improved connectivity, and the integration of smartwatches into broader ecosystems. This positive outlook underscores the significant opportunities within the APAC smart watch industry for both established players and new entrants.
APAC Smart Watch Industry Segmentation
-
1. Operating Systems
- 1.1. Watch OS
- 1.2. Android/Wear OS
- 1.3. Other Operating Systems
-
2. Display Type
- 2.1. AMOLED
- 2.2. PMOLED
- 2.3. TFT LCD
-
3. Application
- 3.1. Personal Assistance
- 3.2. Medical
- 3.3. Sports
- 3.4. Other Applications
APAC Smart Watch Industry Segmentation By Geography
-
1. North America
- 1.1. United States
- 1.2. Canada
- 1.3. Mexico
-
2. South America
- 2.1. Brazil
- 2.2. Argentina
- 2.3. Rest of South America
-
3. Europe
- 3.1. United Kingdom
- 3.2. Germany
- 3.3. France
- 3.4. Italy
- 3.5. Spain
- 3.6. Russia
- 3.7. Benelux
- 3.8. Nordics
- 3.9. Rest of Europe
-
4. Middle East & Africa
- 4.1. Turkey
- 4.2. Israel
- 4.3. GCC
- 4.4. North Africa
- 4.5. South Africa
- 4.6. Rest of Middle East & Africa
-
5. Asia Pacific
- 5.1. China
- 5.2. India
- 5.3. Japan
- 5.4. South Korea
- 5.5. ASEAN
- 5.6. Oceania
- 5.7. Rest of Asia Pacific
APAC Smart Watch Industry REPORT HIGHLIGHTS
| Aspects | Details |
|---|---|
| Study Period | 2019-2033 |
| Base Year | 2024 |
| Estimated Year | 2025 |
| Forecast Period | 2025-2033 |
| Historical Period | 2019-2024 |
| Growth Rate | CAGR of 19.69% from 2019-2033 |
| Segmentation |
|
Table of Contents
- 1. Introduction
- 1.1. Research Scope
- 1.2. Market Segmentation
- 1.3. Research Methodology
- 1.4. Definitions and Assumptions
- 2. Executive Summary
- 2.1. Introduction
- 3. Market Dynamics
- 3.1. Introduction
- 3.2. Market Drivers
- 3.2.1. Increasing Technological Advancements in the Wearables Market; Increase in Health Awareness among the Consumer
- 3.3. Market Restrains
- 3.3.1 Growing Complexity of Wearable Devices and Limited Use of Features
- 3.3.2 Augmented With Security Risks
- 3.4. Market Trends
- 3.4.1. Increasing Internet Penetration in the Asia Pacific is Expected to Drive the Studied Market
- 4. Market Factor Analysis
- 4.1. Porters Five Forces
- 4.2. Supply/Value Chain
- 4.3. PESTEL analysis
- 4.4. Market Entropy
- 4.5. Patent/Trademark Analysis
- 5. Global APAC Smart Watch Industry Analysis, Insights and Forecast, 2019-2031
- 5.1. Market Analysis, Insights and Forecast - by Operating Systems
- 5.1.1. Watch OS
- 5.1.2. Android/Wear OS
- 5.1.3. Other Operating Systems
- 5.2. Market Analysis, Insights and Forecast - by Display Type
- 5.2.1. AMOLED
- 5.2.2. PMOLED
- 5.2.3. TFT LCD
- 5.3. Market Analysis, Insights and Forecast - by Application
- 5.3.1. Personal Assistance
- 5.3.2. Medical
- 5.3.3. Sports
- 5.3.4. Other Applications
- 5.4. Market Analysis, Insights and Forecast - by Region
- 5.4.1. North America
- 5.4.2. South America
- 5.4.3. Europe
- 5.4.4. Middle East & Africa
- 5.4.5. Asia Pacific
- 5.1. Market Analysis, Insights and Forecast - by Operating Systems
- 6. North America APAC Smart Watch Industry Analysis, Insights and Forecast, 2019-2031
- 6.1. Market Analysis, Insights and Forecast - by Operating Systems
- 6.1.1. Watch OS
- 6.1.2. Android/Wear OS
- 6.1.3. Other Operating Systems
- 6.2. Market Analysis, Insights and Forecast - by Display Type
- 6.2.1. AMOLED
- 6.2.2. PMOLED
- 6.2.3. TFT LCD
- 6.3. Market Analysis, Insights and Forecast - by Application
- 6.3.1. Personal Assistance
- 6.3.2. Medical
- 6.3.3. Sports
- 6.3.4. Other Applications
- 6.1. Market Analysis, Insights and Forecast - by Operating Systems
- 7. South America APAC Smart Watch Industry Analysis, Insights and Forecast, 2019-2031
- 7.1. Market Analysis, Insights and Forecast - by Operating Systems
- 7.1.1. Watch OS
- 7.1.2. Android/Wear OS
- 7.1.3. Other Operating Systems
- 7.2. Market Analysis, Insights and Forecast - by Display Type
- 7.2.1. AMOLED
- 7.2.2. PMOLED
- 7.2.3. TFT LCD
- 7.3. Market Analysis, Insights and Forecast - by Application
- 7.3.1. Personal Assistance
- 7.3.2. Medical
- 7.3.3. Sports
- 7.3.4. Other Applications
- 7.1. Market Analysis, Insights and Forecast - by Operating Systems
- 8. Europe APAC Smart Watch Industry Analysis, Insights and Forecast, 2019-2031
- 8.1. Market Analysis, Insights and Forecast - by Operating Systems
- 8.1.1. Watch OS
- 8.1.2. Android/Wear OS
- 8.1.3. Other Operating Systems
- 8.2. Market Analysis, Insights and Forecast - by Display Type
- 8.2.1. AMOLED
- 8.2.2. PMOLED
- 8.2.3. TFT LCD
- 8.3. Market Analysis, Insights and Forecast - by Application
- 8.3.1. Personal Assistance
- 8.3.2. Medical
- 8.3.3. Sports
- 8.3.4. Other Applications
- 8.1. Market Analysis, Insights and Forecast - by Operating Systems
- 9. Middle East & Africa APAC Smart Watch Industry Analysis, Insights and Forecast, 2019-2031
- 9.1. Market Analysis, Insights and Forecast - by Operating Systems
- 9.1.1. Watch OS
- 9.1.2. Android/Wear OS
- 9.1.3. Other Operating Systems
- 9.2. Market Analysis, Insights and Forecast - by Display Type
- 9.2.1. AMOLED
- 9.2.2. PMOLED
- 9.2.3. TFT LCD
- 9.3. Market Analysis, Insights and Forecast - by Application
- 9.3.1. Personal Assistance
- 9.3.2. Medical
- 9.3.3. Sports
- 9.3.4. Other Applications
- 9.1. Market Analysis, Insights and Forecast - by Operating Systems
- 10. Asia Pacific APAC Smart Watch Industry Analysis, Insights and Forecast, 2019-2031
- 10.1. Market Analysis, Insights and Forecast - by Operating Systems
- 10.1.1. Watch OS
- 10.1.2. Android/Wear OS
- 10.1.3. Other Operating Systems
- 10.2. Market Analysis, Insights and Forecast - by Display Type
- 10.2.1. AMOLED
- 10.2.2. PMOLED
- 10.2.3. TFT LCD
- 10.3. Market Analysis, Insights and Forecast - by Application
- 10.3.1. Personal Assistance
- 10.3.2. Medical
- 10.3.3. Sports
- 10.3.4. Other Applications
- 10.1. Market Analysis, Insights and Forecast - by Operating Systems
- 11. North America APAC Smart Watch Industry Analysis, Insights and Forecast, 2019-2031
- 11.1. Market Analysis, Insights and Forecast - By Country/Sub-region
- 11.1.1 United States
- 11.1.2 Canada
- 12. Europe APAC Smart Watch Industry Analysis, Insights and Forecast, 2019-2031
- 12.1. Market Analysis, Insights and Forecast - By Country/Sub-region
- 12.1.1 United Kingdom
- 12.1.2 Germany
- 12.1.3 France
- 12.1.4 Rest of Europe
- 13. Asia Pacific APAC Smart Watch Industry Analysis, Insights and Forecast, 2019-2031
- 13.1. Market Analysis, Insights and Forecast - By Country/Sub-region
- 13.1.1 China
- 13.1.2 Japan
- 13.1.3 India
- 13.1.4 Rest of Asia Pacific
- 14. Latin America APAC Smart Watch Industry Analysis, Insights and Forecast, 2019-2031
- 14.1. Market Analysis, Insights and Forecast - By Country/Sub-region
- 14.1.1 Mexico
- 14.1.2 Brazil
- 14.1.3 Rest of Latin America
- 15. Middle East and Africa APAC Smart Watch Industry Analysis, Insights and Forecast, 2019-2031
- 15.1. Market Analysis, Insights and Forecast - By Country/Sub-region
- 15.1.1 United Arab Emirates
- 15.1.2 South Africa
- 15.1.3 Rest of Middle East and Africa
- 16. Competitive Analysis
- 16.1. Global Market Share Analysis 2024
- 16.2. Company Profiles
- 16.2.1 Polar Electro OY
- 16.2.1.1. Overview
- 16.2.1.2. Products
- 16.2.1.3. SWOT Analysis
- 16.2.1.4. Recent Developments
- 16.2.1.5. Financials (Based on Availability)
- 16.2.2 Huami Corporation
- 16.2.2.1. Overview
- 16.2.2.2. Products
- 16.2.2.3. SWOT Analysis
- 16.2.2.4. Recent Developments
- 16.2.2.5. Financials (Based on Availability)
- 16.2.3 LG Electronics Inc
- 16.2.3.1. Overview
- 16.2.3.2. Products
- 16.2.3.3. SWOT Analysis
- 16.2.3.4. Recent Developments
- 16.2.3.5. Financials (Based on Availability)
- 16.2.4 Lenovo Group Limited
- 16.2.4.1. Overview
- 16.2.4.2. Products
- 16.2.4.3. SWOT Analysis
- 16.2.4.4. Recent Developments
- 16.2.4.5. Financials (Based on Availability)
- 16.2.5 Samsung Electronics Co Ltd
- 16.2.5.1. Overview
- 16.2.5.2. Products
- 16.2.5.3. SWOT Analysis
- 16.2.5.4. Recent Developments
- 16.2.5.5. Financials (Based on Availability)
- 16.2.6 Garmin Ltd
- 16.2.6.1. Overview
- 16.2.6.2. Products
- 16.2.6.3. SWOT Analysis
- 16.2.6.4. Recent Developments
- 16.2.6.5. Financials (Based on Availability)
- 16.2.7 Fitbit Inc
- 16.2.7.1. Overview
- 16.2.7.2. Products
- 16.2.7.3. SWOT Analysis
- 16.2.7.4. Recent Developments
- 16.2.7.5. Financials (Based on Availability)
- 16.2.8 Huawei Technologies Co Ltd
- 16.2.8.1. Overview
- 16.2.8.2. Products
- 16.2.8.3. SWOT Analysis
- 16.2.8.4. Recent Developments
- 16.2.8.5. Financials (Based on Availability)
- 16.2.9 Xiaomi Corporatio
- 16.2.9.1. Overview
- 16.2.9.2. Products
- 16.2.9.3. SWOT Analysis
- 16.2.9.4. Recent Developments
- 16.2.9.5. Financials (Based on Availability)
- 16.2.10 Fossil Group Inc
- 16.2.10.1. Overview
- 16.2.10.2. Products
- 16.2.10.3. SWOT Analysis
- 16.2.10.4. Recent Developments
- 16.2.10.5. Financials (Based on Availability)
- 16.2.11 Apple Inc
- 16.2.11.1. Overview
- 16.2.11.2. Products
- 16.2.11.3. SWOT Analysis
- 16.2.11.4. Recent Developments
- 16.2.11.5. Financials (Based on Availability)
- 16.2.12 Sony Corporation
- 16.2.12.1. Overview
- 16.2.12.2. Products
- 16.2.12.3. SWOT Analysis
- 16.2.12.4. Recent Developments
- 16.2.12.5. Financials (Based on Availability)
- 16.2.1 Polar Electro OY
List of Figures
- Figure 1: Global APAC Smart Watch Industry Revenue Breakdown (Million, %) by Region 2024 & 2032
- Figure 2: North America APAC Smart Watch Industry Revenue (Million), by Country 2024 & 2032
- Figure 3: North America APAC Smart Watch Industry Revenue Share (%), by Country 2024 & 2032
- Figure 4: Europe APAC Smart Watch Industry Revenue (Million), by Country 2024 & 2032
- Figure 5: Europe APAC Smart Watch Industry Revenue Share (%), by Country 2024 & 2032
- Figure 6: Asia Pacific APAC Smart Watch Industry Revenue (Million), by Country 2024 & 2032
- Figure 7: Asia Pacific APAC Smart Watch Industry Revenue Share (%), by Country 2024 & 2032
- Figure 8: Latin America APAC Smart Watch Industry Revenue (Million), by Country 2024 & 2032
- Figure 9: Latin America APAC Smart Watch Industry Revenue Share (%), by Country 2024 & 2032
- Figure 10: Middle East and Africa APAC Smart Watch Industry Revenue (Million), by Country 2024 & 2032
- Figure 11: Middle East and Africa APAC Smart Watch Industry Revenue Share (%), by Country 2024 & 2032
- Figure 12: North America APAC Smart Watch Industry Revenue (Million), by Operating Systems 2024 & 2032
- Figure 13: North America APAC Smart Watch Industry Revenue Share (%), by Operating Systems 2024 & 2032
- Figure 14: North America APAC Smart Watch Industry Revenue (Million), by Display Type 2024 & 2032
- Figure 15: North America APAC Smart Watch Industry Revenue Share (%), by Display Type 2024 & 2032
- Figure 16: North America APAC Smart Watch Industry Revenue (Million), by Application 2024 & 2032
- Figure 17: North America APAC Smart Watch Industry Revenue Share (%), by Application 2024 & 2032
- Figure 18: North America APAC Smart Watch Industry Revenue (Million), by Country 2024 & 2032
- Figure 19: North America APAC Smart Watch Industry Revenue Share (%), by Country 2024 & 2032
- Figure 20: South America APAC Smart Watch Industry Revenue (Million), by Operating Systems 2024 & 2032
- Figure 21: South America APAC Smart Watch Industry Revenue Share (%), by Operating Systems 2024 & 2032
- Figure 22: South America APAC Smart Watch Industry Revenue (Million), by Display Type 2024 & 2032
- Figure 23: South America APAC Smart Watch Industry Revenue Share (%), by Display Type 2024 & 2032
- Figure 24: South America APAC Smart Watch Industry Revenue (Million), by Application 2024 & 2032
- Figure 25: South America APAC Smart Watch Industry Revenue Share (%), by Application 2024 & 2032
- Figure 26: South America APAC Smart Watch Industry Revenue (Million), by Country 2024 & 2032
- Figure 27: South America APAC Smart Watch Industry Revenue Share (%), by Country 2024 & 2032
- Figure 28: Europe APAC Smart Watch Industry Revenue (Million), by Operating Systems 2024 & 2032
- Figure 29: Europe APAC Smart Watch Industry Revenue Share (%), by Operating Systems 2024 & 2032
- Figure 30: Europe APAC Smart Watch Industry Revenue (Million), by Display Type 2024 & 2032
- Figure 31: Europe APAC Smart Watch Industry Revenue Share (%), by Display Type 2024 & 2032
- Figure 32: Europe APAC Smart Watch Industry Revenue (Million), by Application 2024 & 2032
- Figure 33: Europe APAC Smart Watch Industry Revenue Share (%), by Application 2024 & 2032
- Figure 34: Europe APAC Smart Watch Industry Revenue (Million), by Country 2024 & 2032
- Figure 35: Europe APAC Smart Watch Industry Revenue Share (%), by Country 2024 & 2032
- Figure 36: Middle East & Africa APAC Smart Watch Industry Revenue (Million), by Operating Systems 2024 & 2032
- Figure 37: Middle East & Africa APAC Smart Watch Industry Revenue Share (%), by Operating Systems 2024 & 2032
- Figure 38: Middle East & Africa APAC Smart Watch Industry Revenue (Million), by Display Type 2024 & 2032
- Figure 39: Middle East & Africa APAC Smart Watch Industry Revenue Share (%), by Display Type 2024 & 2032
- Figure 40: Middle East & Africa APAC Smart Watch Industry Revenue (Million), by Application 2024 & 2032
- Figure 41: Middle East & Africa APAC Smart Watch Industry Revenue Share (%), by Application 2024 & 2032
- Figure 42: Middle East & Africa APAC Smart Watch Industry Revenue (Million), by Country 2024 & 2032
- Figure 43: Middle East & Africa APAC Smart Watch Industry Revenue Share (%), by Country 2024 & 2032
- Figure 44: Asia Pacific APAC Smart Watch Industry Revenue (Million), by Operating Systems 2024 & 2032
- Figure 45: Asia Pacific APAC Smart Watch Industry Revenue Share (%), by Operating Systems 2024 & 2032
- Figure 46: Asia Pacific APAC Smart Watch Industry Revenue (Million), by Display Type 2024 & 2032
- Figure 47: Asia Pacific APAC Smart Watch Industry Revenue Share (%), by Display Type 2024 & 2032
- Figure 48: Asia Pacific APAC Smart Watch Industry Revenue (Million), by Application 2024 & 2032
- Figure 49: Asia Pacific APAC Smart Watch Industry Revenue Share (%), by Application 2024 & 2032
- Figure 50: Asia Pacific APAC Smart Watch Industry Revenue (Million), by Country 2024 & 2032
- Figure 51: Asia Pacific APAC Smart Watch Industry Revenue Share (%), by Country 2024 & 2032
List of Tables
- Table 1: Global APAC Smart Watch Industry Revenue Million Forecast, by Region 2019 & 2032
- Table 2: Global APAC Smart Watch Industry Revenue Million Forecast, by Operating Systems 2019 & 2032
- Table 3: Global APAC Smart Watch Industry Revenue Million Forecast, by Display Type 2019 & 2032
- Table 4: Global APAC Smart Watch Industry Revenue Million Forecast, by Application 2019 & 2032
- Table 5: Global APAC Smart Watch Industry Revenue Million Forecast, by Region 2019 & 2032
- Table 6: Global APAC Smart Watch Industry Revenue Million Forecast, by Country 2019 & 2032
- Table 7: United States APAC Smart Watch Industry Revenue (Million) Forecast, by Application 2019 & 2032
- Table 8: Canada APAC Smart Watch Industry Revenue (Million) Forecast, by Application 2019 & 2032
- Table 9: Global APAC Smart Watch Industry Revenue Million Forecast, by Country 2019 & 2032
- Table 10: United Kingdom APAC Smart Watch Industry Revenue (Million) Forecast, by Application 2019 & 2032
- Table 11: Germany APAC Smart Watch Industry Revenue (Million) Forecast, by Application 2019 & 2032
- Table 12: France APAC Smart Watch Industry Revenue (Million) Forecast, by Application 2019 & 2032
- Table 13: Rest of Europe APAC Smart Watch Industry Revenue (Million) Forecast, by Application 2019 & 2032
- Table 14: Global APAC Smart Watch Industry Revenue Million Forecast, by Country 2019 & 2032
- Table 15: China APAC Smart Watch Industry Revenue (Million) Forecast, by Application 2019 & 2032
- Table 16: Japan APAC Smart Watch Industry Revenue (Million) Forecast, by Application 2019 & 2032
- Table 17: India APAC Smart Watch Industry Revenue (Million) Forecast, by Application 2019 & 2032
- Table 18: Rest of Asia Pacific APAC Smart Watch Industry Revenue (Million) Forecast, by Application 2019 & 2032
- Table 19: Global APAC Smart Watch Industry Revenue Million Forecast, by Country 2019 & 2032
- Table 20: Mexico APAC Smart Watch Industry Revenue (Million) Forecast, by Application 2019 & 2032
- Table 21: Brazil APAC Smart Watch Industry Revenue (Million) Forecast, by Application 2019 & 2032
- Table 22: Rest of Latin America APAC Smart Watch Industry Revenue (Million) Forecast, by Application 2019 & 2032
- Table 23: Global APAC Smart Watch Industry Revenue Million Forecast, by Country 2019 & 2032
- Table 24: United Arab Emirates APAC Smart Watch Industry Revenue (Million) Forecast, by Application 2019 & 2032
- Table 25: South Africa APAC Smart Watch Industry Revenue (Million) Forecast, by Application 2019 & 2032
- Table 26: Rest of Middle East and Africa APAC Smart Watch Industry Revenue (Million) Forecast, by Application 2019 & 2032
- Table 27: Global APAC Smart Watch Industry Revenue Million Forecast, by Operating Systems 2019 & 2032
- Table 28: Global APAC Smart Watch Industry Revenue Million Forecast, by Display Type 2019 & 2032
- Table 29: Global APAC Smart Watch Industry Revenue Million Forecast, by Application 2019 & 2032
- Table 30: Global APAC Smart Watch Industry Revenue Million Forecast, by Country 2019 & 2032
- Table 31: United States APAC Smart Watch Industry Revenue (Million) Forecast, by Application 2019 & 2032
- Table 32: Canada APAC Smart Watch Industry Revenue (Million) Forecast, by Application 2019 & 2032
- Table 33: Mexico APAC Smart Watch Industry Revenue (Million) Forecast, by Application 2019 & 2032
- Table 34: Global APAC Smart Watch Industry Revenue Million Forecast, by Operating Systems 2019 & 2032
- Table 35: Global APAC Smart Watch Industry Revenue Million Forecast, by Display Type 2019 & 2032
- Table 36: Global APAC Smart Watch Industry Revenue Million Forecast, by Application 2019 & 2032
- Table 37: Global APAC Smart Watch Industry Revenue Million Forecast, by Country 2019 & 2032
- Table 38: Brazil APAC Smart Watch Industry Revenue (Million) Forecast, by Application 2019 & 2032
- Table 39: Argentina APAC Smart Watch Industry Revenue (Million) Forecast, by Application 2019 & 2032
- Table 40: Rest of South America APAC Smart Watch Industry Revenue (Million) Forecast, by Application 2019 & 2032
- Table 41: Global APAC Smart Watch Industry Revenue Million Forecast, by Operating Systems 2019 & 2032
- Table 42: Global APAC Smart Watch Industry Revenue Million Forecast, by Display Type 2019 & 2032
- Table 43: Global APAC Smart Watch Industry Revenue Million Forecast, by Application 2019 & 2032
- Table 44: Global APAC Smart Watch Industry Revenue Million Forecast, by Country 2019 & 2032
- Table 45: United Kingdom APAC Smart Watch Industry Revenue (Million) Forecast, by Application 2019 & 2032
- Table 46: Germany APAC Smart Watch Industry Revenue (Million) Forecast, by Application 2019 & 2032
- Table 47: France APAC Smart Watch Industry Revenue (Million) Forecast, by Application 2019 & 2032
- Table 48: Italy APAC Smart Watch Industry Revenue (Million) Forecast, by Application 2019 & 2032
- Table 49: Spain APAC Smart Watch Industry Revenue (Million) Forecast, by Application 2019 & 2032
- Table 50: Russia APAC Smart Watch Industry Revenue (Million) Forecast, by Application 2019 & 2032
- Table 51: Benelux APAC Smart Watch Industry Revenue (Million) Forecast, by Application 2019 & 2032
- Table 52: Nordics APAC Smart Watch Industry Revenue (Million) Forecast, by Application 2019 & 2032
- Table 53: Rest of Europe APAC Smart Watch Industry Revenue (Million) Forecast, by Application 2019 & 2032
- Table 54: Global APAC Smart Watch Industry Revenue Million Forecast, by Operating Systems 2019 & 2032
- Table 55: Global APAC Smart Watch Industry Revenue Million Forecast, by Display Type 2019 & 2032
- Table 56: Global APAC Smart Watch Industry Revenue Million Forecast, by Application 2019 & 2032
- Table 57: Global APAC Smart Watch Industry Revenue Million Forecast, by Country 2019 & 2032
- Table 58: Turkey APAC Smart Watch Industry Revenue (Million) Forecast, by Application 2019 & 2032
- Table 59: Israel APAC Smart Watch Industry Revenue (Million) Forecast, by Application 2019 & 2032
- Table 60: GCC APAC Smart Watch Industry Revenue (Million) Forecast, by Application 2019 & 2032
- Table 61: North Africa APAC Smart Watch Industry Revenue (Million) Forecast, by Application 2019 & 2032
- Table 62: South Africa APAC Smart Watch Industry Revenue (Million) Forecast, by Application 2019 & 2032
- Table 63: Rest of Middle East & Africa APAC Smart Watch Industry Revenue (Million) Forecast, by Application 2019 & 2032
- Table 64: Global APAC Smart Watch Industry Revenue Million Forecast, by Operating Systems 2019 & 2032
- Table 65: Global APAC Smart Watch Industry Revenue Million Forecast, by Display Type 2019 & 2032
- Table 66: Global APAC Smart Watch Industry Revenue Million Forecast, by Application 2019 & 2032
- Table 67: Global APAC Smart Watch Industry Revenue Million Forecast, by Country 2019 & 2032
- Table 68: China APAC Smart Watch Industry Revenue (Million) Forecast, by Application 2019 & 2032
- Table 69: India APAC Smart Watch Industry Revenue (Million) Forecast, by Application 2019 & 2032
- Table 70: Japan APAC Smart Watch Industry Revenue (Million) Forecast, by Application 2019 & 2032
- Table 71: South Korea APAC Smart Watch Industry Revenue (Million) Forecast, by Application 2019 & 2032
- Table 72: ASEAN APAC Smart Watch Industry Revenue (Million) Forecast, by Application 2019 & 2032
- Table 73: Oceania APAC Smart Watch Industry Revenue (Million) Forecast, by Application 2019 & 2032
- Table 74: Rest of Asia Pacific APAC Smart Watch Industry Revenue (Million) Forecast, by Application 2019 & 2032
Frequently Asked Questions
1. What is the projected Compound Annual Growth Rate (CAGR) of the APAC Smart Watch Industry?
The projected CAGR is approximately 19.69%.
2. Which companies are prominent players in the APAC Smart Watch Industry?
Key companies in the market include Polar Electro OY, Huami Corporation, LG Electronics Inc, Lenovo Group Limited, Samsung Electronics Co Ltd, Garmin Ltd, Fitbit Inc, Huawei Technologies Co Ltd, Xiaomi Corporatio, Fossil Group Inc, Apple Inc, Sony Corporation.
3. What are the main segments of the APAC Smart Watch Industry?
The market segments include Operating Systems, Display Type, Application.
4. Can you provide details about the market size?
The market size is estimated to be USD 51.62 Million as of 2022.
5. What are some drivers contributing to market growth?
Increasing Technological Advancements in the Wearables Market; Increase in Health Awareness among the Consumer.
6. What are the notable trends driving market growth?
Increasing Internet Penetration in the Asia Pacific is Expected to Drive the Studied Market.
7. Are there any restraints impacting market growth?
Growing Complexity of Wearable Devices and Limited Use of Features. Augmented With Security Risks.
8. Can you provide examples of recent developments in the market?
November 2022 - Xiaomi announced the launch of its new watch S2 in China alongside the flagship Xiaomi 13 series, Buds 4, and a couple of new products. After the launch in China, the company could also aim to launch the watch in the global market.
9. What pricing options are available for accessing the report?
Pricing options include single-user, multi-user, and enterprise licenses priced at USD 4750, USD 4950, and USD 6800 respectively.
10. Is the market size provided in terms of value or volume?
The market size is provided in terms of value, measured in Million.
11. Are there any specific market keywords associated with the report?
Yes, the market keyword associated with the report is "APAC Smart Watch Industry," which aids in identifying and referencing the specific market segment covered.
12. How do I determine which pricing option suits my needs best?
The pricing options vary based on user requirements and access needs. Individual users may opt for single-user licenses, while businesses requiring broader access may choose multi-user or enterprise licenses for cost-effective access to the report.
13. Are there any additional resources or data provided in the APAC Smart Watch Industry report?
While the report offers comprehensive insights, it's advisable to review the specific contents or supplementary materials provided to ascertain if additional resources or data are available.
14. How can I stay updated on further developments or reports in the APAC Smart Watch Industry?
To stay informed about further developments, trends, and reports in the APAC Smart Watch Industry, consider subscribing to industry newsletters, following relevant companies and organizations, or regularly checking reputable industry news sources and publications.
Methodology
Step 1 - Identification of Relevant Samples Size from Population Database


Step 2 - Approaches for Defining Global Market Size (Value, Volume* & Price*)

Note*: In applicable scenarios
Step 3 - Data Sources
Primary Research
- Web Analytics
- Survey Reports
- Research Institute
- Latest Research Reports
- Opinion Leaders
Secondary Research
- Annual Reports
- White Paper
- Latest Press Release
- Industry Association
- Paid Database
- Investor Presentations

Step 4 - Data Triangulation
Involves using different sources of information in order to increase the validity of a study
These sources are likely to be stakeholders in a program - participants, other researchers, program staff, other community members, and so on.
Then we put all data in single framework & apply various statistical tools to find out the dynamic on the market.
During the analysis stage, feedback from the stakeholder groups would be compared to determine areas of agreement as well as areas of divergence
