

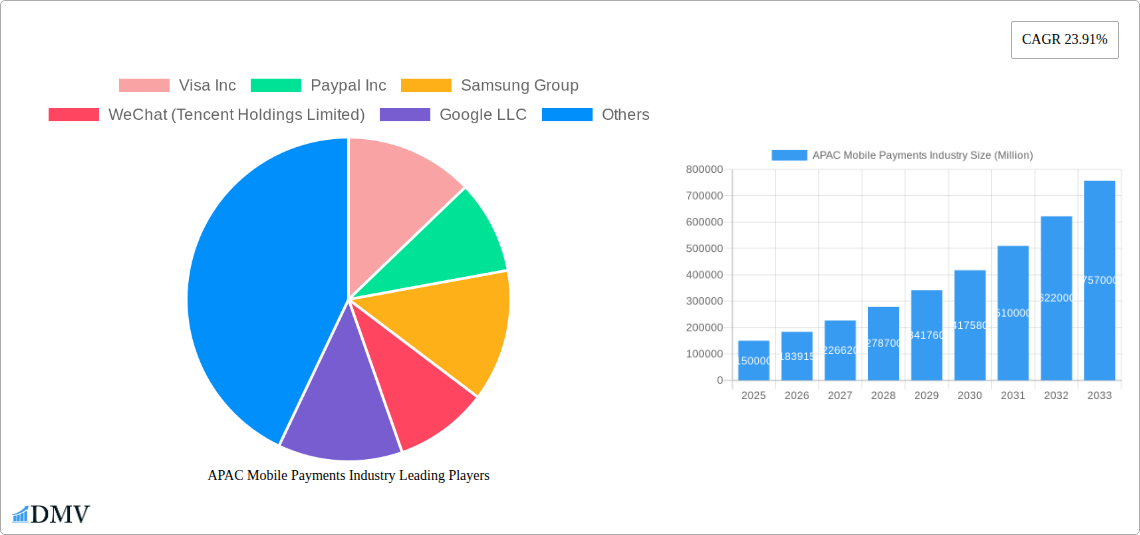
Key Insights
The Asia-Pacific (APAC) mobile payments market is experiencing explosive growth, driven by the region's burgeoning smartphone penetration, expanding internet access, and a rapidly increasing digital-savvy population. A 23.91% Compound Annual Growth Rate (CAGR) indicates a significant upward trajectory, transforming how consumers and businesses conduct transactions. Key drivers include the widespread adoption of smartphones, the increasing preference for cashless transactions, the rise of e-commerce and mobile-first businesses, and the proactive government initiatives promoting digital financial inclusion across various APAC nations, particularly in India and China. The market is segmented by payment type (proximity and remote), end-user industry (BFSI, IT, retail, healthcare, government, media & entertainment, transportation & logistics, and others), and geography, with China, India, Japan, and South Korea representing significant market shares. The competitive landscape is intensely dynamic, featuring both global giants like Visa, Mastercard, PayPal, and Google, alongside regional players such as Alipay, WeChat Pay, and Paytm, creating intense competition and innovation. This competition fuels the development of new payment technologies, enhanced security features, and improved user experiences, further accelerating market expansion. The growth is not uniform across all segments; proximity payments, which encompass NFC-based technologies like Apple Pay and Google Pay, are witnessing robust growth, while remote payments are fueled by the expanding e-commerce sector. BFSI, retail, and IT and telecommunications industries are major adopters, driving a significant portion of the market's value. While challenges exist, such as concerns over data security and digital literacy gaps in certain regions, the overall market outlook remains strongly positive, predicting sustained high growth throughout the forecast period (2025-2033).
The continued expansion of mobile financial services (MFS) in emerging economies within APAC is a powerful catalyst for growth. Government initiatives focused on financial inclusion are fostering broader access to mobile payment systems, particularly in previously underserved populations. The integration of mobile payments with other digital services, such as ride-hailing apps and online food delivery platforms, is furthering adoption. The evolution of super-apps, offering a comprehensive suite of services beyond payments, strengthens market leadership and encourages user loyalty. While challenges like regulatory hurdles and cybersecurity threats require attention, robust technological advancements, such as biometric authentication and advanced fraud detection systems, are mitigating these risks. The increasing adoption of 5G technology will pave the way for faster transaction speeds and enhanced user experience, further stimulating market growth. Furthermore, the rise of Buy Now, Pay Later (BNPL) options integrated into mobile payment platforms is reshaping consumer behavior and increasing the overall transaction volume. The forecast period anticipates significant regional variations, with countries like India and China continuing to lead in terms of market size and growth, while other nations in Southeast Asia will demonstrate impressive expansion.
APAC Mobile Payments Industry: A Comprehensive Market Report (2019-2033)
This insightful report provides a comprehensive analysis of the Asia-Pacific (APAC) mobile payments industry, encompassing market trends, leading players, technological advancements, and future growth projections from 2019 to 2033. With a base year of 2025 and a forecast period spanning 2025-2033, this report is an indispensable resource for stakeholders seeking to understand and capitalize on the dynamic opportunities within this rapidly evolving market. The report delves into key segments, including proximity and remote payments, across diverse end-user industries like BFSI, retail, and healthcare, providing granular insights into the performance of major markets like China, India, Japan, South Korea, and the rest of APAC. The total market value is predicted to reach xx Million by 2033.
APAC Mobile Payments Industry Market Composition & Trends
This section examines the competitive landscape of the APAC mobile payments market, analyzing market concentration, innovation drivers, regulatory frameworks, substitute payment methods, end-user behavior, and merger & acquisition (M&A) activities. We quantify market share distribution among key players and assess the financial implications of significant M&A deals.
- Market Concentration: The APAC mobile payments market exhibits a moderately concentrated structure, with a few dominant players holding significant market share. However, the market also features numerous smaller players, fostering competition and innovation. The combined market share of the top 5 players is estimated at xx%.
- Innovation Catalysts: Factors like increasing smartphone penetration, the rise of e-commerce, and government initiatives promoting digital financial inclusion are driving innovation in mobile payment technologies. The development of new payment methods, such as biometric authentication and blockchain-based solutions, is further accelerating this trend.
- Regulatory Landscape: Varying regulatory frameworks across different APAC countries influence the adoption and usage of mobile payment systems. Governments are actively involved in shaping the industry through supportive regulations and initiatives designed to foster financial inclusion and combat financial crime.
- Substitute Products: Traditional payment methods, such as cash and credit cards, remain prevalent in certain segments and regions of APAC. However, the increasing convenience and security of mobile payments are gradually replacing these traditional methods, particularly among younger demographics.
- End-User Profiles: The APAC mobile payments market caters to a diverse range of end-users, with varying adoption rates across different demographics and industries. Understanding the preferences and needs of these diverse user groups is crucial for successful market penetration.
- M&A Activities: The APAC mobile payments sector has witnessed significant M&A activity in recent years, as larger players consolidate their market positions and smaller companies seek strategic partnerships. Total M&A deal value in the past five years is estimated to be approximately xx Million.
APAC Mobile Payments Industry Industry Evolution
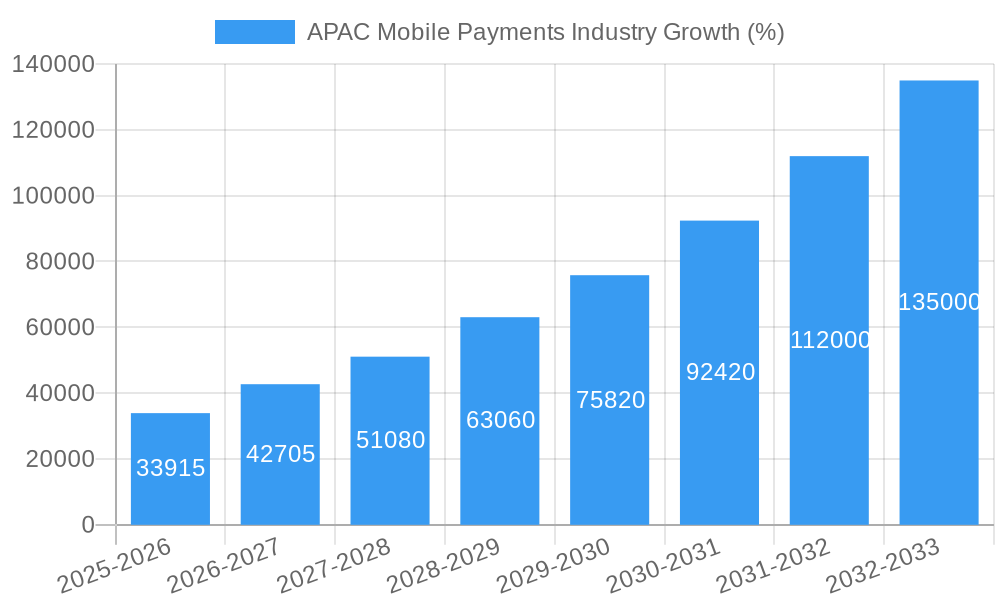
This section analyzes the historical and projected growth trajectory of the APAC mobile payments market, focusing on technological advancements and changing consumer preferences. We examine the impact of factors such as rising smartphone usage, expanding internet access, increased digital literacy, and the growing preference for contactless payments. Data points include detailed growth rates and adoption metrics across different segments. The market experienced a Compound Annual Growth Rate (CAGR) of xx% during the historical period (2019-2024) and is projected to maintain a robust growth rate of xx% during the forecast period (2025-2033). Key technological drivers such as the integration of AI, blockchain, and improved security protocols are also examined in detail, along with their impact on market growth. Specific examples of increased mobile payment adoption are provided, highlighting the significant shift towards cashless transactions.
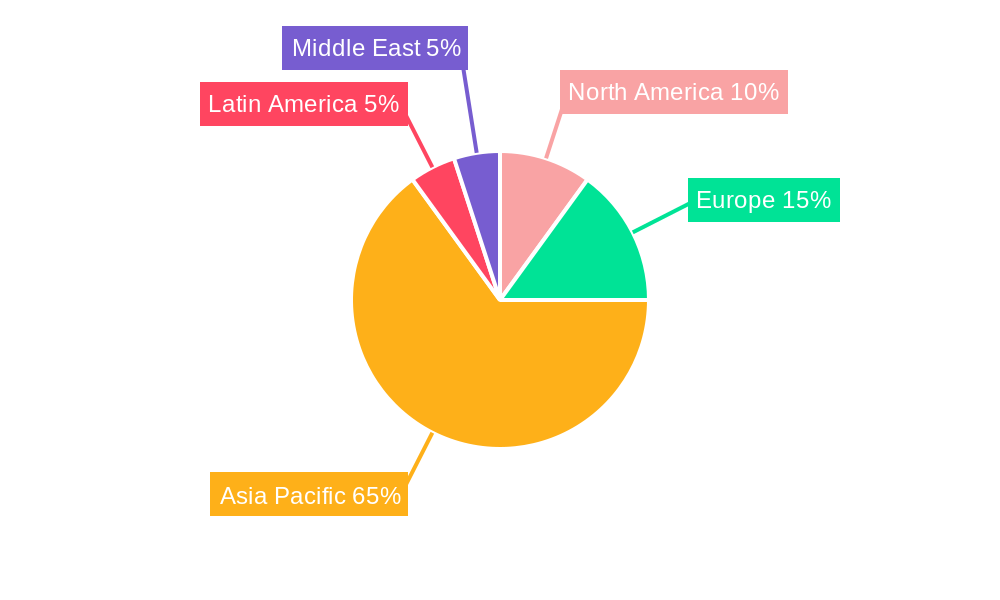
Leading Regions, Countries, or Segments in APAC Mobile Payments Industry
This section identifies the dominant regions, countries, and segments within the APAC mobile payments market.
By Type:
- Proximity Payment: Proximity payment systems, such as NFC-based solutions, are gaining significant traction across APAC. This growth is fuelled by the increasing adoption of contactless payment methods and the widespread availability of NFC-enabled smartphones.
- Remote Payment: Remote payment methods, including online and mobile banking transfers, are also experiencing significant growth, driven by the expanding e-commerce market and increased internet penetration.
By End-User Industry:
- BFSI: The BFSI sector is a major driver of mobile payments growth in APAC. Banks and financial institutions are actively promoting mobile payment solutions to enhance customer convenience and efficiency.
- Retail: The retail sector is another significant contributor to the growth of the mobile payments market. Retailers are increasingly adopting mobile payment technologies to streamline transactions and improve customer experience.
- Other Dominant Sectors: Other sectors such as IT and Telecommunication, Transportation and Logistics also show high growth rates.
By Country:
- China: China stands as the dominant market for mobile payments in APAC, fueled by the widespread adoption of mobile wallets like Alipay and WeChat Pay. Key drivers include strong government support, high smartphone penetration, and a robust e-commerce ecosystem.
- India: India is another significant market, witnessing rapid growth driven by the government’s push for digital financial inclusion and the proliferation of mobile payment platforms like Paytm. Government initiatives like UPI have been instrumental in driving adoption.
- Other Key Markets: Japan, South Korea, and the Rest of Asia Pacific (including countries like Vietnam and Malaysia) are experiencing significant growth in mobile payment adoption, although at a slightly slower pace compared to China and India.
APAC Mobile Payments Industry Product Innovations
The APAC mobile payments industry is witnessing continuous innovation, with new products and features emerging regularly. These innovations include advancements in biometric authentication, tokenization technologies for enhanced security, and the integration of artificial intelligence for fraud detection. Unique selling propositions are focused on convenience, security, and cost-effectiveness. These advancements are transforming the payment landscape and creating opportunities for new market entrants.
Propelling Factors for APAC Mobile Payments Industry Growth
Several factors are driving the growth of the APAC mobile payments industry. These include the increasing smartphone penetration, rising internet and mobile data usage, government initiatives promoting financial inclusion, and the expanding e-commerce sector. The growing preference for contactless payments due to hygiene concerns also plays a significant role. Technological advancements like AI and blockchain are further bolstering growth.
Obstacles in the APAC Mobile Payments Industry Market
Despite its strong growth trajectory, the APAC mobile payments market faces several challenges. These include security concerns, concerns over data privacy, regulatory hurdles in certain markets, and the need for widespread infrastructure development in some regions to support mobile payment adoption. Furthermore, intense competition among various payment providers necessitates continuous innovation and adaptation.
Future Opportunities in APAP Mobile Payments Industry
The APAP mobile payments industry presents several promising opportunities for future growth. These include the expansion into underserved markets, the integration of emerging technologies like blockchain and AI for enhanced security and efficiency, and the growing demand for personalized payment solutions. The rising popularity of super apps and the integration of mobile payments into other services present further avenues for market expansion.
Major Players in the APAC Mobile Payments Industry Ecosystem
- Visa Inc
- Paypal Inc
- Samsung Group
- WeChat (Tencent Holdings Limited)
- Google LLC
- Comviva Technologies Limited (A Tech Mahindra Company)
- Amazon com Inc
- Alipay com Co Ltd
- Mastercard Inc
- Paytm (One97 Communications Limited)
- American Express Co
Key Developments in APAC Mobile Payments Industry Industry
- March 2022: HDFC Bank launched PayZapp 2.0, a revamped mobile payment app integrating UPI and diverse payment options.
- June 2022: ComfortDelGro Taxi partnered with Alipay+, enabling Touch 'n Go eWallet and Kakao Pay for cashless payments in Malaysia and South Korea.
Strategic APAC Mobile Payments Industry Market Forecast
The APAC mobile payments market is poised for continued robust growth, driven by technological advancements, increasing smartphone penetration, and supportive government policies. The expansion into less-penetrated markets, coupled with the emergence of innovative payment solutions, presents substantial opportunities for growth. The market's future prospects remain highly positive, promising significant returns for investors and businesses operating in this sector.
APAC Mobile Payments Industry Segmentation
-
1. Type
- 1.1. Proximity Payment
- 1.2. Remote Payment
-
2. End-User Industry
- 2.1. BFSI
- 2.2. IT and Telecommunication
- 2.3. Retail
- 2.4. Healthcare
- 2.5. Government
- 2.6. Media and Entertainment
- 2.7. Transportation and Logistics
- 2.8. Other End User
APAC Mobile Payments Industry Segmentation By Geography
-
1. North America
- 1.1. United States
- 1.2. Canada
- 1.3. Mexico
-
2. South America
- 2.1. Brazil
- 2.2. Argentina
- 2.3. Rest of South America
-
3. Europe
- 3.1. United Kingdom
- 3.2. Germany
- 3.3. France
- 3.4. Italy
- 3.5. Spain
- 3.6. Russia
- 3.7. Benelux
- 3.8. Nordics
- 3.9. Rest of Europe
-
4. Middle East & Africa
- 4.1. Turkey
- 4.2. Israel
- 4.3. GCC
- 4.4. North Africa
- 4.5. South Africa
- 4.6. Rest of Middle East & Africa
-
5. Asia Pacific
- 5.1. China
- 5.2. India
- 5.3. Japan
- 5.4. South Korea
- 5.5. ASEAN
- 5.6. Oceania
- 5.7. Rest of Asia Pacific
APAC Mobile Payments Industry REPORT HIGHLIGHTS
| Aspects | Details |
|---|---|
| Study Period | 2019-2033 |
| Base Year | 2024 |
| Estimated Year | 2025 |
| Forecast Period | 2025-2033 |
| Historical Period | 2019-2024 |
| Growth Rate | CAGR of 23.91% from 2019-2033 |
| Segmentation |
|
Table of Contents
- 1. Introduction
- 1.1. Research Scope
- 1.2. Market Segmentation
- 1.3. Research Methodology
- 1.4. Definitions and Assumptions
- 2. Executive Summary
- 2.1. Introduction
- 3. Market Dynamics
- 3.1. Introduction
- 3.2. Market Drivers
- 3.2.1. Increasing Internet Penetration and Growing M-commerce Market
- 3.3. Market Restrains
- 3.3.1. Security Issues Associated with Mobile Payments
- 3.4. Market Trends
- 3.4.1. Retail Industry is one of the Factor Driving the Market
- 4. Market Factor Analysis
- 4.1. Porters Five Forces
- 4.2. Supply/Value Chain
- 4.3. PESTEL analysis
- 4.4. Market Entropy
- 4.5. Patent/Trademark Analysis
- 5. Global APAC Mobile Payments Industry Analysis, Insights and Forecast, 2019-2031
- 5.1. Market Analysis, Insights and Forecast - by Type
- 5.1.1. Proximity Payment
- 5.1.2. Remote Payment
- 5.2. Market Analysis, Insights and Forecast - by End-User Industry
- 5.2.1. BFSI
- 5.2.2. IT and Telecommunication
- 5.2.3. Retail
- 5.2.4. Healthcare
- 5.2.5. Government
- 5.2.6. Media and Entertainment
- 5.2.7. Transportation and Logistics
- 5.2.8. Other End User
- 5.3. Market Analysis, Insights and Forecast - by Region
- 5.3.1. North America
- 5.3.2. South America
- 5.3.3. Europe
- 5.3.4. Middle East & Africa
- 5.3.5. Asia Pacific
- 5.1. Market Analysis, Insights and Forecast - by Type
- 6. North America APAC Mobile Payments Industry Analysis, Insights and Forecast, 2019-2031
- 6.1. Market Analysis, Insights and Forecast - by Type
- 6.1.1. Proximity Payment
- 6.1.2. Remote Payment
- 6.2. Market Analysis, Insights and Forecast - by End-User Industry
- 6.2.1. BFSI
- 6.2.2. IT and Telecommunication
- 6.2.3. Retail
- 6.2.4. Healthcare
- 6.2.5. Government
- 6.2.6. Media and Entertainment
- 6.2.7. Transportation and Logistics
- 6.2.8. Other End User
- 6.1. Market Analysis, Insights and Forecast - by Type
- 7. South America APAC Mobile Payments Industry Analysis, Insights and Forecast, 2019-2031
- 7.1. Market Analysis, Insights and Forecast - by Type
- 7.1.1. Proximity Payment
- 7.1.2. Remote Payment
- 7.2. Market Analysis, Insights and Forecast - by End-User Industry
- 7.2.1. BFSI
- 7.2.2. IT and Telecommunication
- 7.2.3. Retail
- 7.2.4. Healthcare
- 7.2.5. Government
- 7.2.6. Media and Entertainment
- 7.2.7. Transportation and Logistics
- 7.2.8. Other End User
- 7.1. Market Analysis, Insights and Forecast - by Type
- 8. Europe APAC Mobile Payments Industry Analysis, Insights and Forecast, 2019-2031
- 8.1. Market Analysis, Insights and Forecast - by Type
- 8.1.1. Proximity Payment
- 8.1.2. Remote Payment
- 8.2. Market Analysis, Insights and Forecast - by End-User Industry
- 8.2.1. BFSI
- 8.2.2. IT and Telecommunication
- 8.2.3. Retail
- 8.2.4. Healthcare
- 8.2.5. Government
- 8.2.6. Media and Entertainment
- 8.2.7. Transportation and Logistics
- 8.2.8. Other End User
- 8.1. Market Analysis, Insights and Forecast - by Type
- 9. Middle East & Africa APAC Mobile Payments Industry Analysis, Insights and Forecast, 2019-2031
- 9.1. Market Analysis, Insights and Forecast - by Type
- 9.1.1. Proximity Payment
- 9.1.2. Remote Payment
- 9.2. Market Analysis, Insights and Forecast - by End-User Industry
- 9.2.1. BFSI
- 9.2.2. IT and Telecommunication
- 9.2.3. Retail
- 9.2.4. Healthcare
- 9.2.5. Government
- 9.2.6. Media and Entertainment
- 9.2.7. Transportation and Logistics
- 9.2.8. Other End User
- 9.1. Market Analysis, Insights and Forecast - by Type
- 10. Asia Pacific APAC Mobile Payments Industry Analysis, Insights and Forecast, 2019-2031
- 10.1. Market Analysis, Insights and Forecast - by Type
- 10.1.1. Proximity Payment
- 10.1.2. Remote Payment
- 10.2. Market Analysis, Insights and Forecast - by End-User Industry
- 10.2.1. BFSI
- 10.2.2. IT and Telecommunication
- 10.2.3. Retail
- 10.2.4. Healthcare
- 10.2.5. Government
- 10.2.6. Media and Entertainment
- 10.2.7. Transportation and Logistics
- 10.2.8. Other End User
- 10.1. Market Analysis, Insights and Forecast - by Type
- 11. North America APAC Mobile Payments Industry Analysis, Insights and Forecast, 2019-2031
- 11.1. Market Analysis, Insights and Forecast - By Country/Sub-region
- 11.1.1.
- 12. Europe APAC Mobile Payments Industry Analysis, Insights and Forecast, 2019-2031
- 12.1. Market Analysis, Insights and Forecast - By Country/Sub-region
- 12.1.1.
- 13. Asia Pacific APAC Mobile Payments Industry Analysis, Insights and Forecast, 2019-2031
- 13.1. Market Analysis, Insights and Forecast - By Country/Sub-region
- 13.1.1.
- 14. Latin America APAC Mobile Payments Industry Analysis, Insights and Forecast, 2019-2031
- 14.1. Market Analysis, Insights and Forecast - By Country/Sub-region
- 14.1.1.
- 15. Middle East APAC Mobile Payments Industry Analysis, Insights and Forecast, 2019-2031
- 15.1. Market Analysis, Insights and Forecast - By Country/Sub-region
- 15.1.1.
- 16. Competitive Analysis
- 16.1. Global Market Share Analysis 2024
- 16.2. Company Profiles
- 16.2.1 Visa Inc
- 16.2.1.1. Overview
- 16.2.1.2. Products
- 16.2.1.3. SWOT Analysis
- 16.2.1.4. Recent Developments
- 16.2.1.5. Financials (Based on Availability)
- 16.2.2 Paypal Inc
- 16.2.2.1. Overview
- 16.2.2.2. Products
- 16.2.2.3. SWOT Analysis
- 16.2.2.4. Recent Developments
- 16.2.2.5. Financials (Based on Availability)
- 16.2.3 Samsung Group
- 16.2.3.1. Overview
- 16.2.3.2. Products
- 16.2.3.3. SWOT Analysis
- 16.2.3.4. Recent Developments
- 16.2.3.5. Financials (Based on Availability)
- 16.2.4 WeChat (Tencent Holdings Limited)
- 16.2.4.1. Overview
- 16.2.4.2. Products
- 16.2.4.3. SWOT Analysis
- 16.2.4.4. Recent Developments
- 16.2.4.5. Financials (Based on Availability)
- 16.2.5 Google LLC
- 16.2.5.1. Overview
- 16.2.5.2. Products
- 16.2.5.3. SWOT Analysis
- 16.2.5.4. Recent Developments
- 16.2.5.5. Financials (Based on Availability)
- 16.2.6 Comviva Technologies Limited (A Tech Mahindra Company)
- 16.2.6.1. Overview
- 16.2.6.2. Products
- 16.2.6.3. SWOT Analysis
- 16.2.6.4. Recent Developments
- 16.2.6.5. Financials (Based on Availability)
- 16.2.7 Amazon com Inc
- 16.2.7.1. Overview
- 16.2.7.2. Products
- 16.2.7.3. SWOT Analysis
- 16.2.7.4. Recent Developments
- 16.2.7.5. Financials (Based on Availability)
- 16.2.8 Alipay com Co Ltd
- 16.2.8.1. Overview
- 16.2.8.2. Products
- 16.2.8.3. SWOT Analysis
- 16.2.8.4. Recent Developments
- 16.2.8.5. Financials (Based on Availability)
- 16.2.9 Mastercard Inc
- 16.2.9.1. Overview
- 16.2.9.2. Products
- 16.2.9.3. SWOT Analysis
- 16.2.9.4. Recent Developments
- 16.2.9.5. Financials (Based on Availability)
- 16.2.10 Paytm (One97 Communications Limited)
- 16.2.10.1. Overview
- 16.2.10.2. Products
- 16.2.10.3. SWOT Analysis
- 16.2.10.4. Recent Developments
- 16.2.10.5. Financials (Based on Availability)
- 16.2.11 American Express Co
- 16.2.11.1. Overview
- 16.2.11.2. Products
- 16.2.11.3. SWOT Analysis
- 16.2.11.4. Recent Developments
- 16.2.11.5. Financials (Based on Availability)
- 16.2.1 Visa Inc
List of Figures
- Figure 1: Global APAC Mobile Payments Industry Revenue Breakdown (Million, %) by Region 2024 & 2032
- Figure 2: Global APAC Mobile Payments Industry Volume Breakdown (K Unit, %) by Region 2024 & 2032
- Figure 3: North America APAC Mobile Payments Industry Revenue (Million), by Country 2024 & 2032
- Figure 4: North America APAC Mobile Payments Industry Volume (K Unit), by Country 2024 & 2032
- Figure 5: North America APAC Mobile Payments Industry Revenue Share (%), by Country 2024 & 2032
- Figure 6: North America APAC Mobile Payments Industry Volume Share (%), by Country 2024 & 2032
- Figure 7: Europe APAC Mobile Payments Industry Revenue (Million), by Country 2024 & 2032
- Figure 8: Europe APAC Mobile Payments Industry Volume (K Unit), by Country 2024 & 2032
- Figure 9: Europe APAC Mobile Payments Industry Revenue Share (%), by Country 2024 & 2032
- Figure 10: Europe APAC Mobile Payments Industry Volume Share (%), by Country 2024 & 2032
- Figure 11: Asia Pacific APAC Mobile Payments Industry Revenue (Million), by Country 2024 & 2032
- Figure 12: Asia Pacific APAC Mobile Payments Industry Volume (K Unit), by Country 2024 & 2032
- Figure 13: Asia Pacific APAC Mobile Payments Industry Revenue Share (%), by Country 2024 & 2032
- Figure 14: Asia Pacific APAC Mobile Payments Industry Volume Share (%), by Country 2024 & 2032
- Figure 15: Latin America APAC Mobile Payments Industry Revenue (Million), by Country 2024 & 2032
- Figure 16: Latin America APAC Mobile Payments Industry Volume (K Unit), by Country 2024 & 2032
- Figure 17: Latin America APAC Mobile Payments Industry Revenue Share (%), by Country 2024 & 2032
- Figure 18: Latin America APAC Mobile Payments Industry Volume Share (%), by Country 2024 & 2032
- Figure 19: Middle East APAC Mobile Payments Industry Revenue (Million), by Country 2024 & 2032
- Figure 20: Middle East APAC Mobile Payments Industry Volume (K Unit), by Country 2024 & 2032
- Figure 21: Middle East APAC Mobile Payments Industry Revenue Share (%), by Country 2024 & 2032
- Figure 22: Middle East APAC Mobile Payments Industry Volume Share (%), by Country 2024 & 2032
- Figure 23: North America APAC Mobile Payments Industry Revenue (Million), by Type 2024 & 2032
- Figure 24: North America APAC Mobile Payments Industry Volume (K Unit), by Type 2024 & 2032
- Figure 25: North America APAC Mobile Payments Industry Revenue Share (%), by Type 2024 & 2032
- Figure 26: North America APAC Mobile Payments Industry Volume Share (%), by Type 2024 & 2032
- Figure 27: North America APAC Mobile Payments Industry Revenue (Million), by End-User Industry 2024 & 2032
- Figure 28: North America APAC Mobile Payments Industry Volume (K Unit), by End-User Industry 2024 & 2032
- Figure 29: North America APAC Mobile Payments Industry Revenue Share (%), by End-User Industry 2024 & 2032
- Figure 30: North America APAC Mobile Payments Industry Volume Share (%), by End-User Industry 2024 & 2032
- Figure 31: North America APAC Mobile Payments Industry Revenue (Million), by Country 2024 & 2032
- Figure 32: North America APAC Mobile Payments Industry Volume (K Unit), by Country 2024 & 2032
- Figure 33: North America APAC Mobile Payments Industry Revenue Share (%), by Country 2024 & 2032
- Figure 34: North America APAC Mobile Payments Industry Volume Share (%), by Country 2024 & 2032
- Figure 35: South America APAC Mobile Payments Industry Revenue (Million), by Type 2024 & 2032
- Figure 36: South America APAC Mobile Payments Industry Volume (K Unit), by Type 2024 & 2032
- Figure 37: South America APAC Mobile Payments Industry Revenue Share (%), by Type 2024 & 2032
- Figure 38: South America APAC Mobile Payments Industry Volume Share (%), by Type 2024 & 2032
- Figure 39: South America APAC Mobile Payments Industry Revenue (Million), by End-User Industry 2024 & 2032
- Figure 40: South America APAC Mobile Payments Industry Volume (K Unit), by End-User Industry 2024 & 2032
- Figure 41: South America APAC Mobile Payments Industry Revenue Share (%), by End-User Industry 2024 & 2032
- Figure 42: South America APAC Mobile Payments Industry Volume Share (%), by End-User Industry 2024 & 2032
- Figure 43: South America APAC Mobile Payments Industry Revenue (Million), by Country 2024 & 2032
- Figure 44: South America APAC Mobile Payments Industry Volume (K Unit), by Country 2024 & 2032
- Figure 45: South America APAC Mobile Payments Industry Revenue Share (%), by Country 2024 & 2032
- Figure 46: South America APAC Mobile Payments Industry Volume Share (%), by Country 2024 & 2032
- Figure 47: Europe APAC Mobile Payments Industry Revenue (Million), by Type 2024 & 2032
- Figure 48: Europe APAC Mobile Payments Industry Volume (K Unit), by Type 2024 & 2032
- Figure 49: Europe APAC Mobile Payments Industry Revenue Share (%), by Type 2024 & 2032
- Figure 50: Europe APAC Mobile Payments Industry Volume Share (%), by Type 2024 & 2032
- Figure 51: Europe APAC Mobile Payments Industry Revenue (Million), by End-User Industry 2024 & 2032
- Figure 52: Europe APAC Mobile Payments Industry Volume (K Unit), by End-User Industry 2024 & 2032
- Figure 53: Europe APAC Mobile Payments Industry Revenue Share (%), by End-User Industry 2024 & 2032
- Figure 54: Europe APAC Mobile Payments Industry Volume Share (%), by End-User Industry 2024 & 2032
- Figure 55: Europe APAC Mobile Payments Industry Revenue (Million), by Country 2024 & 2032
- Figure 56: Europe APAC Mobile Payments Industry Volume (K Unit), by Country 2024 & 2032
- Figure 57: Europe APAC Mobile Payments Industry Revenue Share (%), by Country 2024 & 2032
- Figure 58: Europe APAC Mobile Payments Industry Volume Share (%), by Country 2024 & 2032
- Figure 59: Middle East & Africa APAC Mobile Payments Industry Revenue (Million), by Type 2024 & 2032
- Figure 60: Middle East & Africa APAC Mobile Payments Industry Volume (K Unit), by Type 2024 & 2032
- Figure 61: Middle East & Africa APAC Mobile Payments Industry Revenue Share (%), by Type 2024 & 2032
- Figure 62: Middle East & Africa APAC Mobile Payments Industry Volume Share (%), by Type 2024 & 2032
- Figure 63: Middle East & Africa APAC Mobile Payments Industry Revenue (Million), by End-User Industry 2024 & 2032
- Figure 64: Middle East & Africa APAC Mobile Payments Industry Volume (K Unit), by End-User Industry 2024 & 2032
- Figure 65: Middle East & Africa APAC Mobile Payments Industry Revenue Share (%), by End-User Industry 2024 & 2032
- Figure 66: Middle East & Africa APAC Mobile Payments Industry Volume Share (%), by End-User Industry 2024 & 2032
- Figure 67: Middle East & Africa APAC Mobile Payments Industry Revenue (Million), by Country 2024 & 2032
- Figure 68: Middle East & Africa APAC Mobile Payments Industry Volume (K Unit), by Country 2024 & 2032
- Figure 69: Middle East & Africa APAC Mobile Payments Industry Revenue Share (%), by Country 2024 & 2032
- Figure 70: Middle East & Africa APAC Mobile Payments Industry Volume Share (%), by Country 2024 & 2032
- Figure 71: Asia Pacific APAC Mobile Payments Industry Revenue (Million), by Type 2024 & 2032
- Figure 72: Asia Pacific APAC Mobile Payments Industry Volume (K Unit), by Type 2024 & 2032
- Figure 73: Asia Pacific APAC Mobile Payments Industry Revenue Share (%), by Type 2024 & 2032
- Figure 74: Asia Pacific APAC Mobile Payments Industry Volume Share (%), by Type 2024 & 2032
- Figure 75: Asia Pacific APAC Mobile Payments Industry Revenue (Million), by End-User Industry 2024 & 2032
- Figure 76: Asia Pacific APAC Mobile Payments Industry Volume (K Unit), by End-User Industry 2024 & 2032
- Figure 77: Asia Pacific APAC Mobile Payments Industry Revenue Share (%), by End-User Industry 2024 & 2032
- Figure 78: Asia Pacific APAC Mobile Payments Industry Volume Share (%), by End-User Industry 2024 & 2032
- Figure 79: Asia Pacific APAC Mobile Payments Industry Revenue (Million), by Country 2024 & 2032
- Figure 80: Asia Pacific APAC Mobile Payments Industry Volume (K Unit), by Country 2024 & 2032
- Figure 81: Asia Pacific APAC Mobile Payments Industry Revenue Share (%), by Country 2024 & 2032
- Figure 82: Asia Pacific APAC Mobile Payments Industry Volume Share (%), by Country 2024 & 2032
List of Tables
- Table 1: Global APAC Mobile Payments Industry Revenue Million Forecast, by Region 2019 & 2032
- Table 2: Global APAC Mobile Payments Industry Volume K Unit Forecast, by Region 2019 & 2032
- Table 3: Global APAC Mobile Payments Industry Revenue Million Forecast, by Type 2019 & 2032
- Table 4: Global APAC Mobile Payments Industry Volume K Unit Forecast, by Type 2019 & 2032
- Table 5: Global APAC Mobile Payments Industry Revenue Million Forecast, by End-User Industry 2019 & 2032
- Table 6: Global APAC Mobile Payments Industry Volume K Unit Forecast, by End-User Industry 2019 & 2032
- Table 7: Global APAC Mobile Payments Industry Revenue Million Forecast, by Region 2019 & 2032
- Table 8: Global APAC Mobile Payments Industry Volume K Unit Forecast, by Region 2019 & 2032
- Table 9: Global APAC Mobile Payments Industry Revenue Million Forecast, by Country 2019 & 2032
- Table 10: Global APAC Mobile Payments Industry Volume K Unit Forecast, by Country 2019 & 2032
- Table 11: APAC Mobile Payments Industry Revenue (Million) Forecast, by Application 2019 & 2032
- Table 12: APAC Mobile Payments Industry Volume (K Unit) Forecast, by Application 2019 & 2032
- Table 13: Global APAC Mobile Payments Industry Revenue Million Forecast, by Country 2019 & 2032
- Table 14: Global APAC Mobile Payments Industry Volume K Unit Forecast, by Country 2019 & 2032
- Table 15: APAC Mobile Payments Industry Revenue (Million) Forecast, by Application 2019 & 2032
- Table 16: APAC Mobile Payments Industry Volume (K Unit) Forecast, by Application 2019 & 2032
- Table 17: Global APAC Mobile Payments Industry Revenue Million Forecast, by Country 2019 & 2032
- Table 18: Global APAC Mobile Payments Industry Volume K Unit Forecast, by Country 2019 & 2032
- Table 19: APAC Mobile Payments Industry Revenue (Million) Forecast, by Application 2019 & 2032
- Table 20: APAC Mobile Payments Industry Volume (K Unit) Forecast, by Application 2019 & 2032
- Table 21: Global APAC Mobile Payments Industry Revenue Million Forecast, by Country 2019 & 2032
- Table 22: Global APAC Mobile Payments Industry Volume K Unit Forecast, by Country 2019 & 2032
- Table 23: APAC Mobile Payments Industry Revenue (Million) Forecast, by Application 2019 & 2032
- Table 24: APAC Mobile Payments Industry Volume (K Unit) Forecast, by Application 2019 & 2032
- Table 25: Global APAC Mobile Payments Industry Revenue Million Forecast, by Country 2019 & 2032
- Table 26: Global APAC Mobile Payments Industry Volume K Unit Forecast, by Country 2019 & 2032
- Table 27: APAC Mobile Payments Industry Revenue (Million) Forecast, by Application 2019 & 2032
- Table 28: APAC Mobile Payments Industry Volume (K Unit) Forecast, by Application 2019 & 2032
- Table 29: Global APAC Mobile Payments Industry Revenue Million Forecast, by Type 2019 & 2032
- Table 30: Global APAC Mobile Payments Industry Volume K Unit Forecast, by Type 2019 & 2032
- Table 31: Global APAC Mobile Payments Industry Revenue Million Forecast, by End-User Industry 2019 & 2032
- Table 32: Global APAC Mobile Payments Industry Volume K Unit Forecast, by End-User Industry 2019 & 2032
- Table 33: Global APAC Mobile Payments Industry Revenue Million Forecast, by Country 2019 & 2032
- Table 34: Global APAC Mobile Payments Industry Volume K Unit Forecast, by Country 2019 & 2032
- Table 35: United States APAC Mobile Payments Industry Revenue (Million) Forecast, by Application 2019 & 2032
- Table 36: United States APAC Mobile Payments Industry Volume (K Unit) Forecast, by Application 2019 & 2032
- Table 37: Canada APAC Mobile Payments Industry Revenue (Million) Forecast, by Application 2019 & 2032
- Table 38: Canada APAC Mobile Payments Industry Volume (K Unit) Forecast, by Application 2019 & 2032
- Table 39: Mexico APAC Mobile Payments Industry Revenue (Million) Forecast, by Application 2019 & 2032
- Table 40: Mexico APAC Mobile Payments Industry Volume (K Unit) Forecast, by Application 2019 & 2032
- Table 41: Global APAC Mobile Payments Industry Revenue Million Forecast, by Type 2019 & 2032
- Table 42: Global APAC Mobile Payments Industry Volume K Unit Forecast, by Type 2019 & 2032
- Table 43: Global APAC Mobile Payments Industry Revenue Million Forecast, by End-User Industry 2019 & 2032
- Table 44: Global APAC Mobile Payments Industry Volume K Unit Forecast, by End-User Industry 2019 & 2032
- Table 45: Global APAC Mobile Payments Industry Revenue Million Forecast, by Country 2019 & 2032
- Table 46: Global APAC Mobile Payments Industry Volume K Unit Forecast, by Country 2019 & 2032
- Table 47: Brazil APAC Mobile Payments Industry Revenue (Million) Forecast, by Application 2019 & 2032
- Table 48: Brazil APAC Mobile Payments Industry Volume (K Unit) Forecast, by Application 2019 & 2032
- Table 49: Argentina APAC Mobile Payments Industry Revenue (Million) Forecast, by Application 2019 & 2032
- Table 50: Argentina APAC Mobile Payments Industry Volume (K Unit) Forecast, by Application 2019 & 2032
- Table 51: Rest of South America APAC Mobile Payments Industry Revenue (Million) Forecast, by Application 2019 & 2032
- Table 52: Rest of South America APAC Mobile Payments Industry Volume (K Unit) Forecast, by Application 2019 & 2032
- Table 53: Global APAC Mobile Payments Industry Revenue Million Forecast, by Type 2019 & 2032
- Table 54: Global APAC Mobile Payments Industry Volume K Unit Forecast, by Type 2019 & 2032
- Table 55: Global APAC Mobile Payments Industry Revenue Million Forecast, by End-User Industry 2019 & 2032
- Table 56: Global APAC Mobile Payments Industry Volume K Unit Forecast, by End-User Industry 2019 & 2032
- Table 57: Global APAC Mobile Payments Industry Revenue Million Forecast, by Country 2019 & 2032
- Table 58: Global APAC Mobile Payments Industry Volume K Unit Forecast, by Country 2019 & 2032
- Table 59: United Kingdom APAC Mobile Payments Industry Revenue (Million) Forecast, by Application 2019 & 2032
- Table 60: United Kingdom APAC Mobile Payments Industry Volume (K Unit) Forecast, by Application 2019 & 2032
- Table 61: Germany APAC Mobile Payments Industry Revenue (Million) Forecast, by Application 2019 & 2032
- Table 62: Germany APAC Mobile Payments Industry Volume (K Unit) Forecast, by Application 2019 & 2032
- Table 63: France APAC Mobile Payments Industry Revenue (Million) Forecast, by Application 2019 & 2032
- Table 64: France APAC Mobile Payments Industry Volume (K Unit) Forecast, by Application 2019 & 2032
- Table 65: Italy APAC Mobile Payments Industry Revenue (Million) Forecast, by Application 2019 & 2032
- Table 66: Italy APAC Mobile Payments Industry Volume (K Unit) Forecast, by Application 2019 & 2032
- Table 67: Spain APAC Mobile Payments Industry Revenue (Million) Forecast, by Application 2019 & 2032
- Table 68: Spain APAC Mobile Payments Industry Volume (K Unit) Forecast, by Application 2019 & 2032
- Table 69: Russia APAC Mobile Payments Industry Revenue (Million) Forecast, by Application 2019 & 2032
- Table 70: Russia APAC Mobile Payments Industry Volume (K Unit) Forecast, by Application 2019 & 2032
- Table 71: Benelux APAC Mobile Payments Industry Revenue (Million) Forecast, by Application 2019 & 2032
- Table 72: Benelux APAC Mobile Payments Industry Volume (K Unit) Forecast, by Application 2019 & 2032
- Table 73: Nordics APAC Mobile Payments Industry Revenue (Million) Forecast, by Application 2019 & 2032
- Table 74: Nordics APAC Mobile Payments Industry Volume (K Unit) Forecast, by Application 2019 & 2032
- Table 75: Rest of Europe APAC Mobile Payments Industry Revenue (Million) Forecast, by Application 2019 & 2032
- Table 76: Rest of Europe APAC Mobile Payments Industry Volume (K Unit) Forecast, by Application 2019 & 2032
- Table 77: Global APAC Mobile Payments Industry Revenue Million Forecast, by Type 2019 & 2032
- Table 78: Global APAC Mobile Payments Industry Volume K Unit Forecast, by Type 2019 & 2032
- Table 79: Global APAC Mobile Payments Industry Revenue Million Forecast, by End-User Industry 2019 & 2032
- Table 80: Global APAC Mobile Payments Industry Volume K Unit Forecast, by End-User Industry 2019 & 2032
- Table 81: Global APAC Mobile Payments Industry Revenue Million Forecast, by Country 2019 & 2032
- Table 82: Global APAC Mobile Payments Industry Volume K Unit Forecast, by Country 2019 & 2032
- Table 83: Turkey APAC Mobile Payments Industry Revenue (Million) Forecast, by Application 2019 & 2032
- Table 84: Turkey APAC Mobile Payments Industry Volume (K Unit) Forecast, by Application 2019 & 2032
- Table 85: Israel APAC Mobile Payments Industry Revenue (Million) Forecast, by Application 2019 & 2032
- Table 86: Israel APAC Mobile Payments Industry Volume (K Unit) Forecast, by Application 2019 & 2032
- Table 87: GCC APAC Mobile Payments Industry Revenue (Million) Forecast, by Application 2019 & 2032
- Table 88: GCC APAC Mobile Payments Industry Volume (K Unit) Forecast, by Application 2019 & 2032
- Table 89: North Africa APAC Mobile Payments Industry Revenue (Million) Forecast, by Application 2019 & 2032
- Table 90: North Africa APAC Mobile Payments Industry Volume (K Unit) Forecast, by Application 2019 & 2032
- Table 91: South Africa APAC Mobile Payments Industry Revenue (Million) Forecast, by Application 2019 & 2032
- Table 92: South Africa APAC Mobile Payments Industry Volume (K Unit) Forecast, by Application 2019 & 2032
- Table 93: Rest of Middle East & Africa APAC Mobile Payments Industry Revenue (Million) Forecast, by Application 2019 & 2032
- Table 94: Rest of Middle East & Africa APAC Mobile Payments Industry Volume (K Unit) Forecast, by Application 2019 & 2032
- Table 95: Global APAC Mobile Payments Industry Revenue Million Forecast, by Type 2019 & 2032
- Table 96: Global APAC Mobile Payments Industry Volume K Unit Forecast, by Type 2019 & 2032
- Table 97: Global APAC Mobile Payments Industry Revenue Million Forecast, by End-User Industry 2019 & 2032
- Table 98: Global APAC Mobile Payments Industry Volume K Unit Forecast, by End-User Industry 2019 & 2032
- Table 99: Global APAC Mobile Payments Industry Revenue Million Forecast, by Country 2019 & 2032
- Table 100: Global APAC Mobile Payments Industry Volume K Unit Forecast, by Country 2019 & 2032
- Table 101: China APAC Mobile Payments Industry Revenue (Million) Forecast, by Application 2019 & 2032
- Table 102: China APAC Mobile Payments Industry Volume (K Unit) Forecast, by Application 2019 & 2032
- Table 103: India APAC Mobile Payments Industry Revenue (Million) Forecast, by Application 2019 & 2032
- Table 104: India APAC Mobile Payments Industry Volume (K Unit) Forecast, by Application 2019 & 2032
- Table 105: Japan APAC Mobile Payments Industry Revenue (Million) Forecast, by Application 2019 & 2032
- Table 106: Japan APAC Mobile Payments Industry Volume (K Unit) Forecast, by Application 2019 & 2032
- Table 107: South Korea APAC Mobile Payments Industry Revenue (Million) Forecast, by Application 2019 & 2032
- Table 108: South Korea APAC Mobile Payments Industry Volume (K Unit) Forecast, by Application 2019 & 2032
- Table 109: ASEAN APAC Mobile Payments Industry Revenue (Million) Forecast, by Application 2019 & 2032
- Table 110: ASEAN APAC Mobile Payments Industry Volume (K Unit) Forecast, by Application 2019 & 2032
- Table 111: Oceania APAC Mobile Payments Industry Revenue (Million) Forecast, by Application 2019 & 2032
- Table 112: Oceania APAC Mobile Payments Industry Volume (K Unit) Forecast, by Application 2019 & 2032
- Table 113: Rest of Asia Pacific APAC Mobile Payments Industry Revenue (Million) Forecast, by Application 2019 & 2032
- Table 114: Rest of Asia Pacific APAC Mobile Payments Industry Volume (K Unit) Forecast, by Application 2019 & 2032
Frequently Asked Questions
1. What is the projected Compound Annual Growth Rate (CAGR) of the APAC Mobile Payments Industry?
The projected CAGR is approximately 23.91%.
2. Which companies are prominent players in the APAC Mobile Payments Industry?
Key companies in the market include Visa Inc, Paypal Inc, Samsung Group, WeChat (Tencent Holdings Limited), Google LLC, Comviva Technologies Limited (A Tech Mahindra Company), Amazon com Inc, Alipay com Co Ltd, Mastercard Inc, Paytm (One97 Communications Limited), American Express Co.
3. What are the main segments of the APAC Mobile Payments Industry?
The market segments include Type, End-User Industry.
4. Can you provide details about the market size?
The market size is estimated to be USD XX Million as of 2022.
5. What are some drivers contributing to market growth?
Increasing Internet Penetration and Growing M-commerce Market.
6. What are the notable trends driving market growth?
Retail Industry is one of the Factor Driving the Market.
7. Are there any restraints impacting market growth?
Security Issues Associated with Mobile Payments.
8. Can you provide examples of recent developments in the market?
June 2022 - ComfortDelGro Taxi and Alipay+ announced a partnership that enables mobile payments from Malaysia and South Korea, namely the Touch 'n Go eWallet and Kakao Pay, to be accepted as cashless payment options in all its Comfort and CityCab taxis. Users of these mobile wallets can pay for the cab fare simply through the wallet apps without needing to exchange currency.
9. What pricing options are available for accessing the report?
Pricing options include single-user, multi-user, and enterprise licenses priced at USD 4750, USD 4950, and USD 6800 respectively.
10. Is the market size provided in terms of value or volume?
The market size is provided in terms of value, measured in Million and volume, measured in K Unit.
11. Are there any specific market keywords associated with the report?
Yes, the market keyword associated with the report is "APAC Mobile Payments Industry," which aids in identifying and referencing the specific market segment covered.
12. How do I determine which pricing option suits my needs best?
The pricing options vary based on user requirements and access needs. Individual users may opt for single-user licenses, while businesses requiring broader access may choose multi-user or enterprise licenses for cost-effective access to the report.
13. Are there any additional resources or data provided in the APAC Mobile Payments Industry report?
While the report offers comprehensive insights, it's advisable to review the specific contents or supplementary materials provided to ascertain if additional resources or data are available.
14. How can I stay updated on further developments or reports in the APAC Mobile Payments Industry?
To stay informed about further developments, trends, and reports in the APAC Mobile Payments Industry, consider subscribing to industry newsletters, following relevant companies and organizations, or regularly checking reputable industry news sources and publications.
Methodology
Step 1 - Identification of Relevant Samples Size from Population Database


Step 2 - Approaches for Defining Global Market Size (Value, Volume* & Price*)

Note*: In applicable scenarios
Step 3 - Data Sources
Primary Research
- Web Analytics
- Survey Reports
- Research Institute
- Latest Research Reports
- Opinion Leaders
Secondary Research
- Annual Reports
- White Paper
- Latest Press Release
- Industry Association
- Paid Database
- Investor Presentations

Step 4 - Data Triangulation
Involves using different sources of information in order to increase the validity of a study
These sources are likely to be stakeholders in a program - participants, other researchers, program staff, other community members, and so on.
Then we put all data in single framework & apply various statistical tools to find out the dynamic on the market.
During the analysis stage, feedback from the stakeholder groups would be compared to determine areas of agreement as well as areas of divergence
