

Key Insights
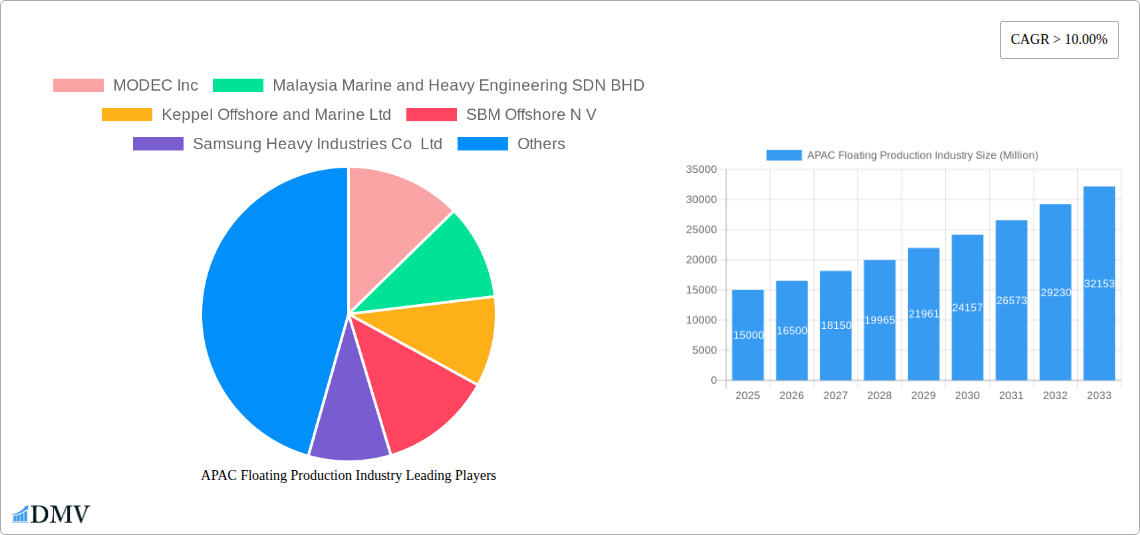
The Asia-Pacific (APAC) floating production industry is experiencing robust growth, driven by increasing offshore oil and gas exploration and production activities in the region. Significant investments in deepwater projects, coupled with the region's abundant reserves, are fueling this expansion. The high CAGR of over 10% indicates a sustained period of growth, projected to continue through 2033. Key market segments within APAC contributing to this growth include deepwater and ultra-deepwater projects, leveraging technologies like FPSOs (Floating Production, Storage, and Offloading units) and Tension Leg Platforms to access challenging offshore reserves. China, Japan, India, and Southeast Asian nations are major contributors to the regional market, with ongoing infrastructure development and government support further stimulating industry activity. While challenges such as volatile oil prices and regulatory complexities exist, the long-term outlook remains positive, with considerable potential for expansion driven by technological advancements and exploration in previously untapped areas.
The dominance of major players like MODEC, Keppel Offshore & Marine, and Samsung Heavy Industries within the APAC region reflects the industry's consolidation and reliance on established technological expertise. However, the market also presents opportunities for smaller, specialized companies catering to niche segments or providing innovative solutions. Future growth will likely be shaped by factors such as the increasing adoption of sustainable technologies, a focus on reducing environmental impact, and ongoing efforts to improve operational efficiency and safety standards. Competition is expected to intensify, leading to further technological advancements and cost optimization strategies. The industry's success in APAC will depend on adapting to evolving geopolitical landscapes, ensuring regulatory compliance, and maintaining a skilled workforce to support complex offshore operations.
APAC Floating Production Industry: A Comprehensive Market Report (2019-2033)
This insightful report provides a comprehensive analysis of the Asia-Pacific (APAC) floating production industry, offering crucial market intelligence for stakeholders seeking to navigate this dynamic sector. Covering the period from 2019 to 2033, with a base year of 2025 and a forecast period extending to 2033, this report unveils the intricate details of market composition, technological advancements, and future growth potential. The study meticulously examines key players such as MODEC Inc, Malaysia Marine and Heavy Engineering SDN BHD, Keppel Offshore and Marine Ltd, SBM Offshore N V, Samsung Heavy Industries Co Ltd, Teekay Corporation, Hyundai Heavy Industries Co Ltd, TechnipFMC PLC, Bumi Armada Berhad, and Mitsubishi Heavy Industries Ltd, offering a granular understanding of their market positioning and strategic moves. The report's robust methodology and detailed data projections make it an invaluable resource for informed decision-making.
APAC Floating Production Industry Market Composition & Trends
This section dissects the APAC floating production market's competitive landscape, analyzing market concentration, innovation drivers, regulatory frameworks, substitute products, end-user profiles, and merger & acquisition (M&A) activities. The study period (2019-2024) reveals a market valued at approximately $XX Million, projected to reach $XX Million by 2025 and $XX Million by 2033.
- Market Share Distribution: MODEC Inc. holds an estimated XX% market share in 2025, followed by SBM Offshore N V with XX%, and Keppel Offshore and Marine Ltd with XX%. The remaining market share is distributed among other key players.
- M&A Activities: The historical period (2019-2024) witnessed XX M&A deals totaling approximately $XX Million. The forecast period (2025-2033) anticipates a surge in M&A activity driven by consolidation and expansion strategies.
- Innovation Catalysts: Technological advancements in FPSO design, subsea technologies, and digitalization are key drivers of market innovation.
- Regulatory Landscape: Stringent environmental regulations and safety standards significantly influence industry operations and investment decisions.
- Substitute Products: While limited, alternative solutions like onshore processing facilities influence market dynamics in specific geographical locations.
APAC Floating Production Industry Industry Evolution
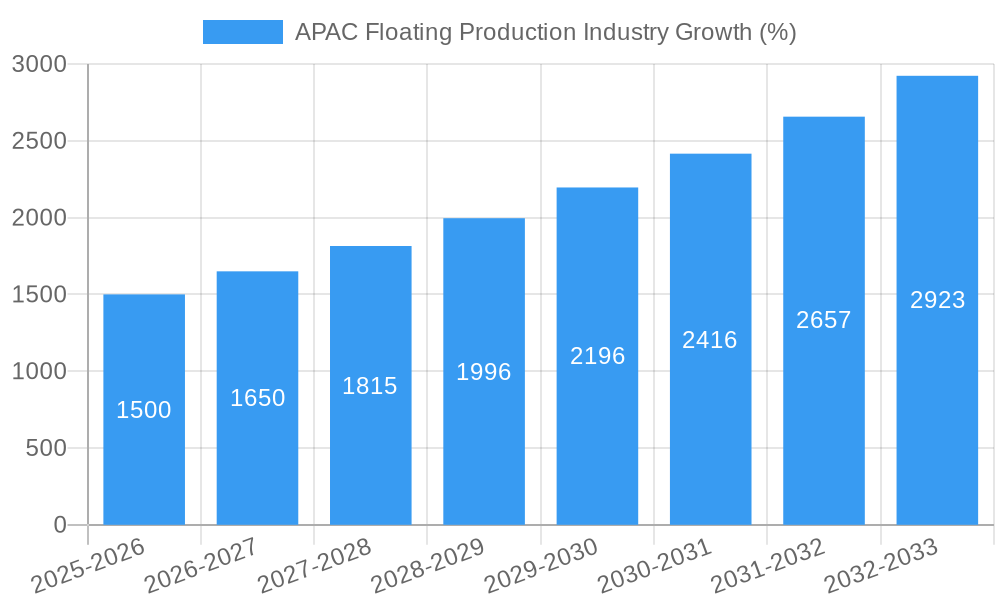
This section meticulously analyzes the evolution of the APAC floating production industry, charting its growth trajectory, highlighting technological progress, and assessing shifts in consumer demands. The market experienced a Compound Annual Growth Rate (CAGR) of XX% during 2019-2024 and is projected to maintain a CAGR of XX% between 2025 and 2033.
The increasing demand for offshore oil and gas extraction in deepwater regions, coupled with technological advancements in floating production systems, has fueled significant market growth. Advancements in subsea processing and enhanced oil recovery techniques have also contributed to this upward trend. Moreover, the rising adoption of automation and digitalization within offshore operations streamlines processes and improves efficiency, further driving market expansion. The shift toward sustainable and environmentally friendly practices influences the industry's trajectory, leading to the adoption of cleaner technologies and operational methods. Finally, government initiatives and supportive policies play a vital role in shaping the market's growth path.
Leading Regions, Countries, or Segments in APAP Floating Production Industry
This section identifies the dominant regions, countries, and segments within the APAC floating production industry.
Dominant Segment: FPSOs represent the largest segment, accounting for approximately XX% of the market in 2025.
- Key Drivers for FPSO Dominance:
- High Capacity: FPSOs offer substantial oil and gas processing capacity, making them ideal for large-scale offshore projects.
- Versatility: FPSOs can be adapted to different water depths and field conditions.
- Established Technology: Mature technology and extensive operational experience contribute to their widespread adoption.
Dominant Region: Southeast Asia, particularly Malaysia and Indonesia, emerges as the leading region due to significant offshore oil and gas reserves and supportive government policies.
- Key Drivers for Southeast Asia Dominance:
- Abundant Reserves: Significant oil and gas reserves in the region fuel high demand for floating production systems.
- Government Support: Favorable regulatory frameworks and investment incentives stimulate industry growth.
- Established Infrastructure: Existing infrastructure and skilled workforce facilitate project execution.
Dominant Water Depth: Deepwater projects represent a significant portion of the market, driven by the exploration and development of deepwater oil and gas fields.
APAC Floating Production Industry Product Innovations
Recent product innovations include advancements in FPSO design incorporating enhanced oil recovery techniques, improved subsea processing capabilities, and the integration of digital technologies for remote monitoring and autonomous operations. These innovations enhance efficiency, reduce operational costs, and improve safety. Unique selling propositions (USPs) center around increased processing capacity, improved environmental performance, and enhanced operational flexibility.
Propelling Factors for APAC Floating Production Industry Growth
Several factors drive the APAC floating production industry's growth. The rising demand for offshore oil and gas, coupled with the exploration and development of deepwater fields, fuels market expansion. Technological advancements, including improved FPSO designs and subsea technologies, enhance efficiency and reduce costs. Furthermore, supportive government policies and investments in infrastructure contribute significantly to industry growth.
Obstacles in the APAC Floating Production Industry Market
The industry faces challenges including stringent environmental regulations, volatile oil and gas prices, and the complexities of operating in harsh offshore environments. Supply chain disruptions and skilled labor shortages can impact project timelines and costs. Moreover, intense competition from established and emerging players influences profitability.
Future Opportunities in APAC Floating Production Industry
Future opportunities lie in the exploration and development of new offshore oil and gas reserves, the adoption of advanced technologies like artificial intelligence and automation, and the growing demand for environmentally sustainable solutions. Expanding into new markets and leveraging partnerships will play a crucial role in shaping future success.
Major Players in the APAC Floating Production Industry Ecosystem
- MODEC Inc
- Malaysia Marine and Heavy Engineering SDN BHD
- Keppel Offshore and Marine Ltd
- SBM Offshore N V
- Samsung Heavy Industries Co Ltd
- Teekay Corporation
- Hyundai Heavy Industries Co Ltd
- TechnipFMC PLC
- Bumi Armada Berhad
- Mitsubishi Heavy Industries Ltd
Key Developments in APAC Floating Production Industry Industry
- 2022 Q4: SBM Offshore N V secured a major contract for a new FPSO in the Australian sector.
- 2023 Q1: MODEC Inc announced a new technological advancement in deepwater FPSO technology.
- 2023 Q3: Malaysia Marine and Heavy Engineering SDN BHD completed a significant expansion of its fabrication yard. (Further details on other developments to be added).
Strategic APAC Floating Production Industry Market Forecast
The APAC floating production industry is poised for continued growth, driven by rising demand for offshore oil and gas, technological advancements, and supportive government policies. The industry's future hinges on adapting to evolving environmental regulations, embracing technological innovation, and securing strategic partnerships to capitalize on emerging opportunities in the region. This report's forecast suggests a robust growth trajectory with significant potential for both established and emerging players.
APAC Floating Production Industry Segmentation
-
1. Type
- 1.1. FPSO
- 1.2. Tension Leg Platform
- 1.3. SPAR
- 1.4. Barge
-
2. Water Depth
- 2.1. Shallow Water
- 2.2. Deepwater and Ultra-Deepwater
-
3. Geography
- 3.1. China
- 3.2. Australia
- 3.3. India
- 3.4. Malaysia
- 3.5. Rest of Asia-Pacific
APAC Floating Production Industry Segmentation By Geography
- 1. China
- 2. Australia
- 3. India
- 4. Malaysia
- 5. Rest of Asia Pacific
APAC Floating Production Industry REPORT HIGHLIGHTS
| Aspects | Details |
|---|---|
| Study Period | 2019-2033 |
| Base Year | 2024 |
| Estimated Year | 2025 |
| Forecast Period | 2025-2033 |
| Historical Period | 2019-2024 |
| Growth Rate | CAGR of > 10.00% from 2019-2033 |
| Segmentation |
|
Table of Contents
- 1. Introduction
- 1.1. Research Scope
- 1.2. Market Segmentation
- 1.3. Research Methodology
- 1.4. Definitions and Assumptions
- 2. Executive Summary
- 2.1. Introduction
- 3. Market Dynamics
- 3.1. Introduction
- 3.2. Market Drivers
- 3.2.1. 4.; An Increase in the Use of LNG as an Energy Source
- 3.3. Market Restrains
- 3.3.1. 4.; Increasing Adoption of Solar and Wind Energy
- 3.4. Market Trends
- 3.4.1 Floating Production
- 3.4.2 Storage and Offloading (FPSO) to Dominate the Market
- 4. Market Factor Analysis
- 4.1. Porters Five Forces
- 4.2. Supply/Value Chain
- 4.3. PESTEL analysis
- 4.4. Market Entropy
- 4.5. Patent/Trademark Analysis
- 5. Global APAC Floating Production Industry Analysis, Insights and Forecast, 2019-2031
- 5.1. Market Analysis, Insights and Forecast - by Type
- 5.1.1. FPSO
- 5.1.2. Tension Leg Platform
- 5.1.3. SPAR
- 5.1.4. Barge
- 5.2. Market Analysis, Insights and Forecast - by Water Depth
- 5.2.1. Shallow Water
- 5.2.2. Deepwater and Ultra-Deepwater
- 5.3. Market Analysis, Insights and Forecast - by Geography
- 5.3.1. China
- 5.3.2. Australia
- 5.3.3. India
- 5.3.4. Malaysia
- 5.3.5. Rest of Asia-Pacific
- 5.4. Market Analysis, Insights and Forecast - by Region
- 5.4.1. China
- 5.4.2. Australia
- 5.4.3. India
- 5.4.4. Malaysia
- 5.4.5. Rest of Asia Pacific
- 5.1. Market Analysis, Insights and Forecast - by Type
- 6. China APAC Floating Production Industry Analysis, Insights and Forecast, 2019-2031
- 6.1. Market Analysis, Insights and Forecast - by Type
- 6.1.1. FPSO
- 6.1.2. Tension Leg Platform
- 6.1.3. SPAR
- 6.1.4. Barge
- 6.2. Market Analysis, Insights and Forecast - by Water Depth
- 6.2.1. Shallow Water
- 6.2.2. Deepwater and Ultra-Deepwater
- 6.3. Market Analysis, Insights and Forecast - by Geography
- 6.3.1. China
- 6.3.2. Australia
- 6.3.3. India
- 6.3.4. Malaysia
- 6.3.5. Rest of Asia-Pacific
- 6.1. Market Analysis, Insights and Forecast - by Type
- 7. Australia APAC Floating Production Industry Analysis, Insights and Forecast, 2019-2031
- 7.1. Market Analysis, Insights and Forecast - by Type
- 7.1.1. FPSO
- 7.1.2. Tension Leg Platform
- 7.1.3. SPAR
- 7.1.4. Barge
- 7.2. Market Analysis, Insights and Forecast - by Water Depth
- 7.2.1. Shallow Water
- 7.2.2. Deepwater and Ultra-Deepwater
- 7.3. Market Analysis, Insights and Forecast - by Geography
- 7.3.1. China
- 7.3.2. Australia
- 7.3.3. India
- 7.3.4. Malaysia
- 7.3.5. Rest of Asia-Pacific
- 7.1. Market Analysis, Insights and Forecast - by Type
- 8. India APAC Floating Production Industry Analysis, Insights and Forecast, 2019-2031
- 8.1. Market Analysis, Insights and Forecast - by Type
- 8.1.1. FPSO
- 8.1.2. Tension Leg Platform
- 8.1.3. SPAR
- 8.1.4. Barge
- 8.2. Market Analysis, Insights and Forecast - by Water Depth
- 8.2.1. Shallow Water
- 8.2.2. Deepwater and Ultra-Deepwater
- 8.3. Market Analysis, Insights and Forecast - by Geography
- 8.3.1. China
- 8.3.2. Australia
- 8.3.3. India
- 8.3.4. Malaysia
- 8.3.5. Rest of Asia-Pacific
- 8.1. Market Analysis, Insights and Forecast - by Type
- 9. Malaysia APAC Floating Production Industry Analysis, Insights and Forecast, 2019-2031
- 9.1. Market Analysis, Insights and Forecast - by Type
- 9.1.1. FPSO
- 9.1.2. Tension Leg Platform
- 9.1.3. SPAR
- 9.1.4. Barge
- 9.2. Market Analysis, Insights and Forecast - by Water Depth
- 9.2.1. Shallow Water
- 9.2.2. Deepwater and Ultra-Deepwater
- 9.3. Market Analysis, Insights and Forecast - by Geography
- 9.3.1. China
- 9.3.2. Australia
- 9.3.3. India
- 9.3.4. Malaysia
- 9.3.5. Rest of Asia-Pacific
- 9.1. Market Analysis, Insights and Forecast - by Type
- 10. Rest of Asia Pacific APAC Floating Production Industry Analysis, Insights and Forecast, 2019-2031
- 10.1. Market Analysis, Insights and Forecast - by Type
- 10.1.1. FPSO
- 10.1.2. Tension Leg Platform
- 10.1.3. SPAR
- 10.1.4. Barge
- 10.2. Market Analysis, Insights and Forecast - by Water Depth
- 10.2.1. Shallow Water
- 10.2.2. Deepwater and Ultra-Deepwater
- 10.3. Market Analysis, Insights and Forecast - by Geography
- 10.3.1. China
- 10.3.2. Australia
- 10.3.3. India
- 10.3.4. Malaysia
- 10.3.5. Rest of Asia-Pacific
- 10.1. Market Analysis, Insights and Forecast - by Type
- 11. North America APAC Floating Production Industry Analysis, Insights and Forecast, 2019-2031
- 11.1. Market Analysis, Insights and Forecast - By Country/Sub-region
- 11.1.1 United States
- 11.1.2 Canada
- 11.1.3 Mexico
- 12. Europe APAC Floating Production Industry Analysis, Insights and Forecast, 2019-2031
- 12.1. Market Analysis, Insights and Forecast - By Country/Sub-region
- 12.1.1 Germany
- 12.1.2 United Kingdom
- 12.1.3 France
- 12.1.4 Spain
- 12.1.5 Italy
- 12.1.6 Spain
- 12.1.7 Belgium
- 12.1.8 Netherland
- 12.1.9 Nordics
- 12.1.10 Rest of Europe
- 13. Asia Pacific APAC Floating Production Industry Analysis, Insights and Forecast, 2019-2031
- 13.1. Market Analysis, Insights and Forecast - By Country/Sub-region
- 13.1.1 China
- 13.1.2 Japan
- 13.1.3 India
- 13.1.4 South Korea
- 13.1.5 Southeast Asia
- 13.1.6 Australia
- 13.1.7 Indonesia
- 13.1.8 Phillipes
- 13.1.9 Singapore
- 13.1.10 Thailandc
- 13.1.11 Rest of Asia Pacific
- 14. South America APAC Floating Production Industry Analysis, Insights and Forecast, 2019-2031
- 14.1. Market Analysis, Insights and Forecast - By Country/Sub-region
- 14.1.1 Brazil
- 14.1.2 Argentina
- 14.1.3 Peru
- 14.1.4 Chile
- 14.1.5 Colombia
- 14.1.6 Ecuador
- 14.1.7 Venezuela
- 14.1.8 Rest of South America
- 15. MEA APAC Floating Production Industry Analysis, Insights and Forecast, 2019-2031
- 15.1. Market Analysis, Insights and Forecast - By Country/Sub-region
- 15.1.1 United Arab Emirates
- 15.1.2 Saudi Arabia
- 15.1.3 South Africa
- 15.1.4 Rest of Middle East and Africa
- 16. Competitive Analysis
- 16.1. Global Market Share Analysis 2024
- 16.2. Company Profiles
- 16.2.1 MODEC Inc
- 16.2.1.1. Overview
- 16.2.1.2. Products
- 16.2.1.3. SWOT Analysis
- 16.2.1.4. Recent Developments
- 16.2.1.5. Financials (Based on Availability)
- 16.2.2 Malaysia Marine and Heavy Engineering SDN BHD
- 16.2.2.1. Overview
- 16.2.2.2. Products
- 16.2.2.3. SWOT Analysis
- 16.2.2.4. Recent Developments
- 16.2.2.5. Financials (Based on Availability)
- 16.2.3 Keppel Offshore and Marine Ltd
- 16.2.3.1. Overview
- 16.2.3.2. Products
- 16.2.3.3. SWOT Analysis
- 16.2.3.4. Recent Developments
- 16.2.3.5. Financials (Based on Availability)
- 16.2.4 SBM Offshore N V
- 16.2.4.1. Overview
- 16.2.4.2. Products
- 16.2.4.3. SWOT Analysis
- 16.2.4.4. Recent Developments
- 16.2.4.5. Financials (Based on Availability)
- 16.2.5 Samsung Heavy Industries Co Ltd
- 16.2.5.1. Overview
- 16.2.5.2. Products
- 16.2.5.3. SWOT Analysis
- 16.2.5.4. Recent Developments
- 16.2.5.5. Financials (Based on Availability)
- 16.2.6 Teekay Corporation
- 16.2.6.1. Overview
- 16.2.6.2. Products
- 16.2.6.3. SWOT Analysis
- 16.2.6.4. Recent Developments
- 16.2.6.5. Financials (Based on Availability)
- 16.2.7 Hyundai Heavy Industries Co Ltd
- 16.2.7.1. Overview
- 16.2.7.2. Products
- 16.2.7.3. SWOT Analysis
- 16.2.7.4. Recent Developments
- 16.2.7.5. Financials (Based on Availability)
- 16.2.8 TechnipFMC PLC
- 16.2.8.1. Overview
- 16.2.8.2. Products
- 16.2.8.3. SWOT Analysis
- 16.2.8.4. Recent Developments
- 16.2.8.5. Financials (Based on Availability)
- 16.2.9 Bumi Armada Berhad
- 16.2.9.1. Overview
- 16.2.9.2. Products
- 16.2.9.3. SWOT Analysis
- 16.2.9.4. Recent Developments
- 16.2.9.5. Financials (Based on Availability)
- 16.2.10 Mitsubishi Heavy Industries Ltd
- 16.2.10.1. Overview
- 16.2.10.2. Products
- 16.2.10.3. SWOT Analysis
- 16.2.10.4. Recent Developments
- 16.2.10.5. Financials (Based on Availability)
- 16.2.1 MODEC Inc
List of Figures
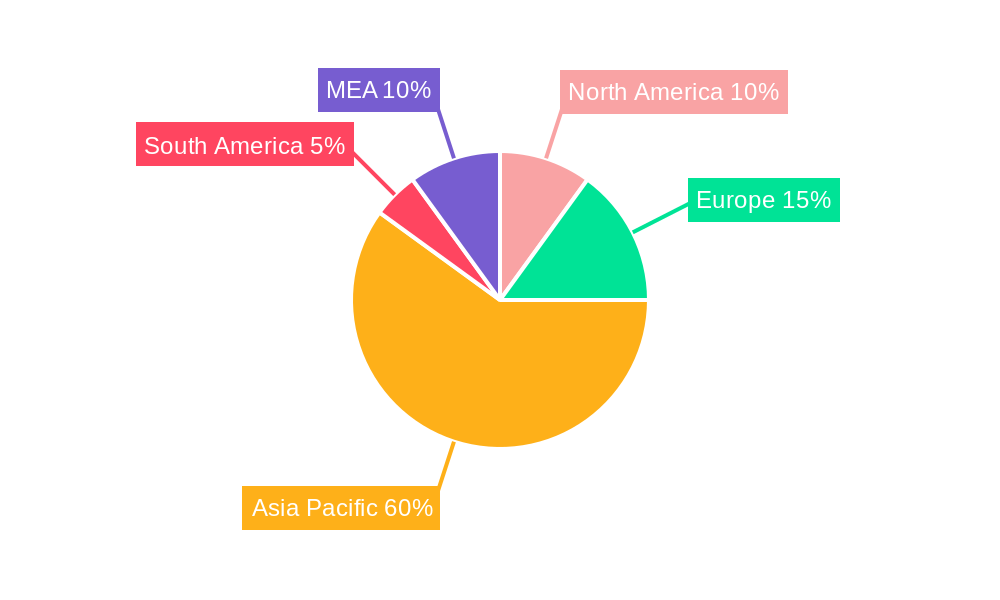
- Figure 1: Global APAC Floating Production Industry Revenue Breakdown (Million, %) by Region 2024 & 2032
- Figure 2: North America APAC Floating Production Industry Revenue (Million), by Country 2024 & 2032
- Figure 3: North America APAC Floating Production Industry Revenue Share (%), by Country 2024 & 2032
- Figure 4: Europe APAC Floating Production Industry Revenue (Million), by Country 2024 & 2032
- Figure 5: Europe APAC Floating Production Industry Revenue Share (%), by Country 2024 & 2032
- Figure 6: Asia Pacific APAC Floating Production Industry Revenue (Million), by Country 2024 & 2032
- Figure 7: Asia Pacific APAC Floating Production Industry Revenue Share (%), by Country 2024 & 2032
- Figure 8: South America APAC Floating Production Industry Revenue (Million), by Country 2024 & 2032
- Figure 9: South America APAC Floating Production Industry Revenue Share (%), by Country 2024 & 2032
- Figure 10: MEA APAC Floating Production Industry Revenue (Million), by Country 2024 & 2032
- Figure 11: MEA APAC Floating Production Industry Revenue Share (%), by Country 2024 & 2032
- Figure 12: China APAC Floating Production Industry Revenue (Million), by Type 2024 & 2032
- Figure 13: China APAC Floating Production Industry Revenue Share (%), by Type 2024 & 2032
- Figure 14: China APAC Floating Production Industry Revenue (Million), by Water Depth 2024 & 2032
- Figure 15: China APAC Floating Production Industry Revenue Share (%), by Water Depth 2024 & 2032
- Figure 16: China APAC Floating Production Industry Revenue (Million), by Geography 2024 & 2032
- Figure 17: China APAC Floating Production Industry Revenue Share (%), by Geography 2024 & 2032
- Figure 18: China APAC Floating Production Industry Revenue (Million), by Country 2024 & 2032
- Figure 19: China APAC Floating Production Industry Revenue Share (%), by Country 2024 & 2032
- Figure 20: Australia APAC Floating Production Industry Revenue (Million), by Type 2024 & 2032
- Figure 21: Australia APAC Floating Production Industry Revenue Share (%), by Type 2024 & 2032
- Figure 22: Australia APAC Floating Production Industry Revenue (Million), by Water Depth 2024 & 2032
- Figure 23: Australia APAC Floating Production Industry Revenue Share (%), by Water Depth 2024 & 2032
- Figure 24: Australia APAC Floating Production Industry Revenue (Million), by Geography 2024 & 2032
- Figure 25: Australia APAC Floating Production Industry Revenue Share (%), by Geography 2024 & 2032
- Figure 26: Australia APAC Floating Production Industry Revenue (Million), by Country 2024 & 2032
- Figure 27: Australia APAC Floating Production Industry Revenue Share (%), by Country 2024 & 2032
- Figure 28: India APAC Floating Production Industry Revenue (Million), by Type 2024 & 2032
- Figure 29: India APAC Floating Production Industry Revenue Share (%), by Type 2024 & 2032
- Figure 30: India APAC Floating Production Industry Revenue (Million), by Water Depth 2024 & 2032
- Figure 31: India APAC Floating Production Industry Revenue Share (%), by Water Depth 2024 & 2032
- Figure 32: India APAC Floating Production Industry Revenue (Million), by Geography 2024 & 2032
- Figure 33: India APAC Floating Production Industry Revenue Share (%), by Geography 2024 & 2032
- Figure 34: India APAC Floating Production Industry Revenue (Million), by Country 2024 & 2032
- Figure 35: India APAC Floating Production Industry Revenue Share (%), by Country 2024 & 2032
- Figure 36: Malaysia APAC Floating Production Industry Revenue (Million), by Type 2024 & 2032
- Figure 37: Malaysia APAC Floating Production Industry Revenue Share (%), by Type 2024 & 2032
- Figure 38: Malaysia APAC Floating Production Industry Revenue (Million), by Water Depth 2024 & 2032
- Figure 39: Malaysia APAC Floating Production Industry Revenue Share (%), by Water Depth 2024 & 2032
- Figure 40: Malaysia APAC Floating Production Industry Revenue (Million), by Geography 2024 & 2032
- Figure 41: Malaysia APAC Floating Production Industry Revenue Share (%), by Geography 2024 & 2032
- Figure 42: Malaysia APAC Floating Production Industry Revenue (Million), by Country 2024 & 2032
- Figure 43: Malaysia APAC Floating Production Industry Revenue Share (%), by Country 2024 & 2032
- Figure 44: Rest of Asia Pacific APAC Floating Production Industry Revenue (Million), by Type 2024 & 2032
- Figure 45: Rest of Asia Pacific APAC Floating Production Industry Revenue Share (%), by Type 2024 & 2032
- Figure 46: Rest of Asia Pacific APAC Floating Production Industry Revenue (Million), by Water Depth 2024 & 2032
- Figure 47: Rest of Asia Pacific APAC Floating Production Industry Revenue Share (%), by Water Depth 2024 & 2032
- Figure 48: Rest of Asia Pacific APAC Floating Production Industry Revenue (Million), by Geography 2024 & 2032
- Figure 49: Rest of Asia Pacific APAC Floating Production Industry Revenue Share (%), by Geography 2024 & 2032
- Figure 50: Rest of Asia Pacific APAC Floating Production Industry Revenue (Million), by Country 2024 & 2032
- Figure 51: Rest of Asia Pacific APAC Floating Production Industry Revenue Share (%), by Country 2024 & 2032
List of Tables
- Table 1: Global APAC Floating Production Industry Revenue Million Forecast, by Region 2019 & 2032
- Table 2: Global APAC Floating Production Industry Revenue Million Forecast, by Type 2019 & 2032
- Table 3: Global APAC Floating Production Industry Revenue Million Forecast, by Water Depth 2019 & 2032
- Table 4: Global APAC Floating Production Industry Revenue Million Forecast, by Geography 2019 & 2032
- Table 5: Global APAC Floating Production Industry Revenue Million Forecast, by Region 2019 & 2032
- Table 6: Global APAC Floating Production Industry Revenue Million Forecast, by Country 2019 & 2032
- Table 7: United States APAC Floating Production Industry Revenue (Million) Forecast, by Application 2019 & 2032
- Table 8: Canada APAC Floating Production Industry Revenue (Million) Forecast, by Application 2019 & 2032
- Table 9: Mexico APAC Floating Production Industry Revenue (Million) Forecast, by Application 2019 & 2032
- Table 10: Global APAC Floating Production Industry Revenue Million Forecast, by Country 2019 & 2032
- Table 11: Germany APAC Floating Production Industry Revenue (Million) Forecast, by Application 2019 & 2032
- Table 12: United Kingdom APAC Floating Production Industry Revenue (Million) Forecast, by Application 2019 & 2032
- Table 13: France APAC Floating Production Industry Revenue (Million) Forecast, by Application 2019 & 2032
- Table 14: Spain APAC Floating Production Industry Revenue (Million) Forecast, by Application 2019 & 2032
- Table 15: Italy APAC Floating Production Industry Revenue (Million) Forecast, by Application 2019 & 2032
- Table 16: Spain APAC Floating Production Industry Revenue (Million) Forecast, by Application 2019 & 2032
- Table 17: Belgium APAC Floating Production Industry Revenue (Million) Forecast, by Application 2019 & 2032
- Table 18: Netherland APAC Floating Production Industry Revenue (Million) Forecast, by Application 2019 & 2032
- Table 19: Nordics APAC Floating Production Industry Revenue (Million) Forecast, by Application 2019 & 2032
- Table 20: Rest of Europe APAC Floating Production Industry Revenue (Million) Forecast, by Application 2019 & 2032
- Table 21: Global APAC Floating Production Industry Revenue Million Forecast, by Country 2019 & 2032
- Table 22: China APAC Floating Production Industry Revenue (Million) Forecast, by Application 2019 & 2032
- Table 23: Japan APAC Floating Production Industry Revenue (Million) Forecast, by Application 2019 & 2032
- Table 24: India APAC Floating Production Industry Revenue (Million) Forecast, by Application 2019 & 2032
- Table 25: South Korea APAC Floating Production Industry Revenue (Million) Forecast, by Application 2019 & 2032
- Table 26: Southeast Asia APAC Floating Production Industry Revenue (Million) Forecast, by Application 2019 & 2032
- Table 27: Australia APAC Floating Production Industry Revenue (Million) Forecast, by Application 2019 & 2032
- Table 28: Indonesia APAC Floating Production Industry Revenue (Million) Forecast, by Application 2019 & 2032
- Table 29: Phillipes APAC Floating Production Industry Revenue (Million) Forecast, by Application 2019 & 2032
- Table 30: Singapore APAC Floating Production Industry Revenue (Million) Forecast, by Application 2019 & 2032
- Table 31: Thailandc APAC Floating Production Industry Revenue (Million) Forecast, by Application 2019 & 2032
- Table 32: Rest of Asia Pacific APAC Floating Production Industry Revenue (Million) Forecast, by Application 2019 & 2032
- Table 33: Global APAC Floating Production Industry Revenue Million Forecast, by Country 2019 & 2032
- Table 34: Brazil APAC Floating Production Industry Revenue (Million) Forecast, by Application 2019 & 2032
- Table 35: Argentina APAC Floating Production Industry Revenue (Million) Forecast, by Application 2019 & 2032
- Table 36: Peru APAC Floating Production Industry Revenue (Million) Forecast, by Application 2019 & 2032
- Table 37: Chile APAC Floating Production Industry Revenue (Million) Forecast, by Application 2019 & 2032
- Table 38: Colombia APAC Floating Production Industry Revenue (Million) Forecast, by Application 2019 & 2032
- Table 39: Ecuador APAC Floating Production Industry Revenue (Million) Forecast, by Application 2019 & 2032
- Table 40: Venezuela APAC Floating Production Industry Revenue (Million) Forecast, by Application 2019 & 2032
- Table 41: Rest of South America APAC Floating Production Industry Revenue (Million) Forecast, by Application 2019 & 2032
- Table 42: Global APAC Floating Production Industry Revenue Million Forecast, by Country 2019 & 2032
- Table 43: United Arab Emirates APAC Floating Production Industry Revenue (Million) Forecast, by Application 2019 & 2032
- Table 44: Saudi Arabia APAC Floating Production Industry Revenue (Million) Forecast, by Application 2019 & 2032
- Table 45: South Africa APAC Floating Production Industry Revenue (Million) Forecast, by Application 2019 & 2032
- Table 46: Rest of Middle East and Africa APAC Floating Production Industry Revenue (Million) Forecast, by Application 2019 & 2032
- Table 47: Global APAC Floating Production Industry Revenue Million Forecast, by Type 2019 & 2032
- Table 48: Global APAC Floating Production Industry Revenue Million Forecast, by Water Depth 2019 & 2032
- Table 49: Global APAC Floating Production Industry Revenue Million Forecast, by Geography 2019 & 2032
- Table 50: Global APAC Floating Production Industry Revenue Million Forecast, by Country 2019 & 2032
- Table 51: Global APAC Floating Production Industry Revenue Million Forecast, by Type 2019 & 2032
- Table 52: Global APAC Floating Production Industry Revenue Million Forecast, by Water Depth 2019 & 2032
- Table 53: Global APAC Floating Production Industry Revenue Million Forecast, by Geography 2019 & 2032
- Table 54: Global APAC Floating Production Industry Revenue Million Forecast, by Country 2019 & 2032
- Table 55: Global APAC Floating Production Industry Revenue Million Forecast, by Type 2019 & 2032
- Table 56: Global APAC Floating Production Industry Revenue Million Forecast, by Water Depth 2019 & 2032
- Table 57: Global APAC Floating Production Industry Revenue Million Forecast, by Geography 2019 & 2032
- Table 58: Global APAC Floating Production Industry Revenue Million Forecast, by Country 2019 & 2032
- Table 59: Global APAC Floating Production Industry Revenue Million Forecast, by Type 2019 & 2032
- Table 60: Global APAC Floating Production Industry Revenue Million Forecast, by Water Depth 2019 & 2032
- Table 61: Global APAC Floating Production Industry Revenue Million Forecast, by Geography 2019 & 2032
- Table 62: Global APAC Floating Production Industry Revenue Million Forecast, by Country 2019 & 2032
- Table 63: Global APAC Floating Production Industry Revenue Million Forecast, by Type 2019 & 2032
- Table 64: Global APAC Floating Production Industry Revenue Million Forecast, by Water Depth 2019 & 2032
- Table 65: Global APAC Floating Production Industry Revenue Million Forecast, by Geography 2019 & 2032
- Table 66: Global APAC Floating Production Industry Revenue Million Forecast, by Country 2019 & 2032
Frequently Asked Questions
1. What is the projected Compound Annual Growth Rate (CAGR) of the APAC Floating Production Industry?
The projected CAGR is approximately > 10.00%.
2. Which companies are prominent players in the APAC Floating Production Industry?
Key companies in the market include MODEC Inc, Malaysia Marine and Heavy Engineering SDN BHD, Keppel Offshore and Marine Ltd, SBM Offshore N V, Samsung Heavy Industries Co Ltd, Teekay Corporation, Hyundai Heavy Industries Co Ltd, TechnipFMC PLC, Bumi Armada Berhad, Mitsubishi Heavy Industries Ltd.
3. What are the main segments of the APAC Floating Production Industry?
The market segments include Type, Water Depth, Geography.
4. Can you provide details about the market size?
The market size is estimated to be USD XX Million as of 2022.
5. What are some drivers contributing to market growth?
4.; An Increase in the Use of LNG as an Energy Source.
6. What are the notable trends driving market growth?
Floating Production. Storage and Offloading (FPSO) to Dominate the Market.
7. Are there any restraints impacting market growth?
4.; Increasing Adoption of Solar and Wind Energy.
8. Can you provide examples of recent developments in the market?
N/A
9. What pricing options are available for accessing the report?
Pricing options include single-user, multi-user, and enterprise licenses priced at USD 4750, USD 5250, and USD 8750 respectively.
10. Is the market size provided in terms of value or volume?
The market size is provided in terms of value, measured in Million.
11. Are there any specific market keywords associated with the report?
Yes, the market keyword associated with the report is "APAC Floating Production Industry," which aids in identifying and referencing the specific market segment covered.
12. How do I determine which pricing option suits my needs best?
The pricing options vary based on user requirements and access needs. Individual users may opt for single-user licenses, while businesses requiring broader access may choose multi-user or enterprise licenses for cost-effective access to the report.
13. Are there any additional resources or data provided in the APAC Floating Production Industry report?
While the report offers comprehensive insights, it's advisable to review the specific contents or supplementary materials provided to ascertain if additional resources or data are available.
14. How can I stay updated on further developments or reports in the APAC Floating Production Industry?
To stay informed about further developments, trends, and reports in the APAC Floating Production Industry, consider subscribing to industry newsletters, following relevant companies and organizations, or regularly checking reputable industry news sources and publications.
Methodology
Step 1 - Identification of Relevant Samples Size from Population Database


Step 2 - Approaches for Defining Global Market Size (Value, Volume* & Price*)

Note*: In applicable scenarios
Step 3 - Data Sources
Primary Research
- Web Analytics
- Survey Reports
- Research Institute
- Latest Research Reports
- Opinion Leaders
Secondary Research
- Annual Reports
- White Paper
- Latest Press Release
- Industry Association
- Paid Database
- Investor Presentations

Step 4 - Data Triangulation
Involves using different sources of information in order to increase the validity of a study
These sources are likely to be stakeholders in a program - participants, other researchers, program staff, other community members, and so on.
Then we put all data in single framework & apply various statistical tools to find out the dynamic on the market.
During the analysis stage, feedback from the stakeholder groups would be compared to determine areas of agreement as well as areas of divergence
