

Key Insights
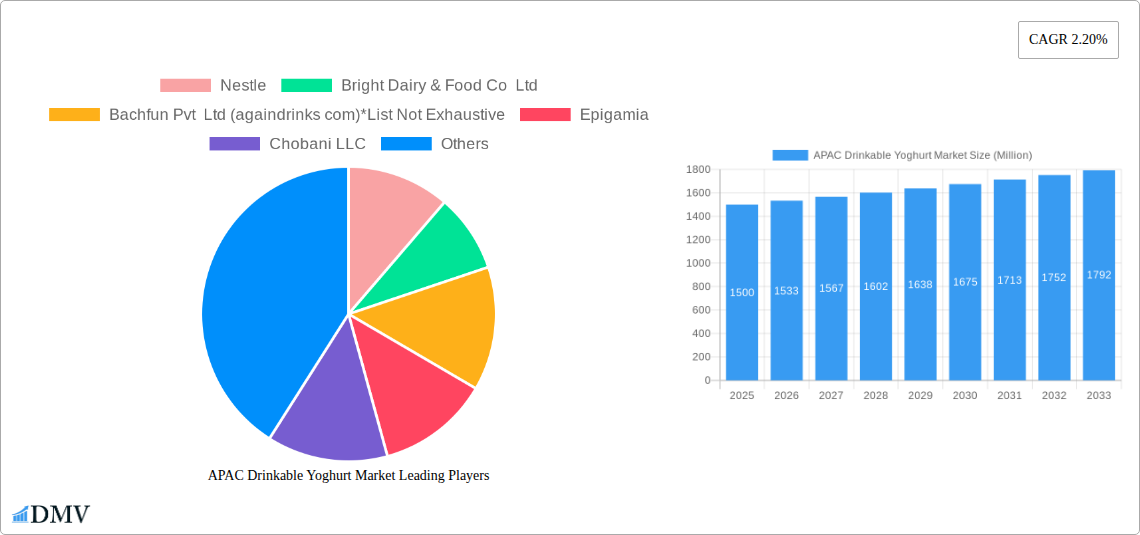
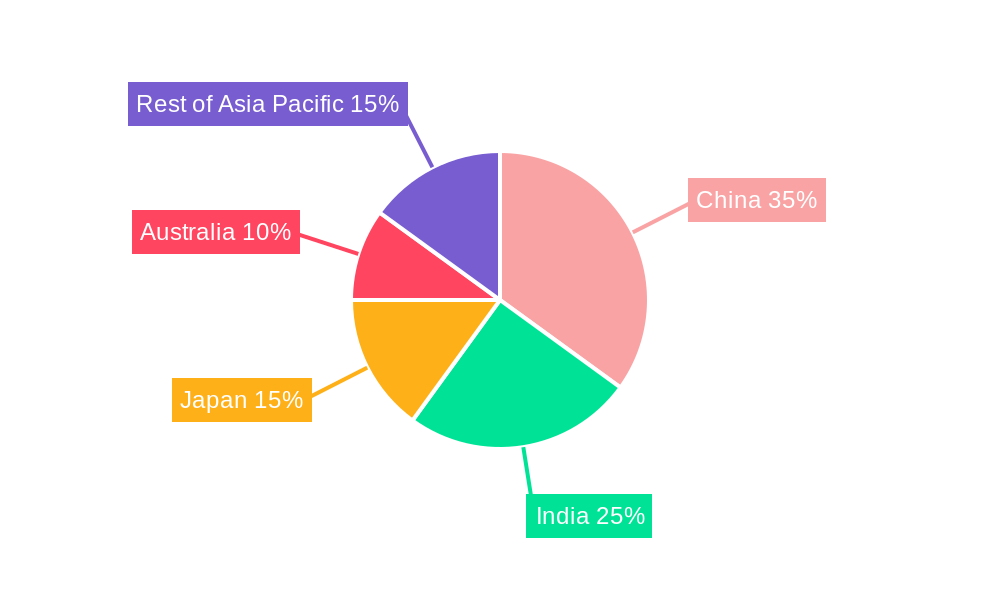
The Asia-Pacific (APAC) drinkable yogurt market, valued at approximately $XX million in 2025, is projected to experience steady growth, exhibiting a Compound Annual Growth Rate (CAGR) of 2.20% from 2025 to 2033. This growth is fueled by several key factors. Rising health consciousness among consumers is driving demand for convenient and nutritious food options, with drinkable yogurt offering a portable and refreshing alternative to traditional dairy products. The increasing popularity of functional foods and beverages, enriched with probiotics and vitamins, further boosts market expansion. Furthermore, innovative product launches, incorporating diverse flavors and incorporating healthy ingredients like fruits and vegetables, cater to evolving consumer preferences. The market is segmented by distribution channel (supermarkets/hypermarkets, convenience stores, specialty stores, online retailers, others), country (China, Japan, Australia, India, Rest of Asia Pacific), category (dairy-based, non-dairy based), and type (plain, flavored). China and India, with their large populations and growing middle classes, are expected to be major contributors to market growth. However, challenges such as fluctuating raw material prices and intense competition from established players and emerging brands could pose potential restraints.
The market's dynamism is evident in the competitive landscape, which includes both multinational giants like Nestlé and Yili, and smaller, agile players like Epigamia and Bachfun, who are focusing on niche segments and innovative product offerings. The growth trajectory suggests a promising future for the APAC drinkable yogurt market, particularly within the flavored and dairy-based segments. Further expansion will likely be driven by strategic partnerships, increased marketing efforts targeting health-conscious consumers, and continuous product innovation to meet evolving consumer demands for taste, convenience, and health benefits. The online retail channel is projected to witness significant expansion, mirroring broader e-commerce trends in the food and beverage industry. Successful players will be those that effectively manage supply chain complexities, leverage e-commerce effectively, and cater to specific regional preferences across the diverse APAC landscape.
APAC Drinkable Yoghurt Market: A Comprehensive Report (2019-2033)
This insightful report provides a detailed analysis of the Asia-Pacific (APAC) drinkable yoghurt market, offering a comprehensive overview of its current state and future trajectory. Covering the period from 2019 to 2033, with 2025 as the base year and a forecast period of 2025-2033, this research is essential for stakeholders seeking to understand this dynamic market segment. The report meticulously examines market size, segmentation, key players, growth drivers, and challenges, providing actionable insights for informed decision-making. The market value is projected to reach xx Million by 2033.
APAC Drinkable Yoghurt Market Composition & Trends
This section delves into the competitive landscape of the APAC drinkable yoghurt market, analyzing market concentration, innovation drivers, regulatory frameworks, substitute products, end-user behavior, and merger & acquisition (M&A) activities. We assess the market share distribution among key players such as Nestle, Bright Dairy & Food Co Ltd, Bachfun Pvt Ltd (againdrinks.com), Epigamia, Chobani LLC, and Yili Com Inc. (Note: List not exhaustive). The report also examines the impact of M&A activities, providing an analysis of deal values and their influence on market dynamics. Innovation is driven by consumer demand for healthier options, such as non-dairy alternatives and functional yogurts. The regulatory landscape, varying across APAC countries, plays a crucial role in shaping market access and product standards. The rise of plant-based alternatives presents a significant challenge, while the increasing health consciousness of consumers fuels market growth. We analyze the end-user profile, segmented by age, lifestyle, and purchasing behavior, along with the impact of evolving consumer preferences on market segmentation. The report estimates the total market size reached xx Million in 2024.
- Market Share Distribution: Nestle holds an estimated xx% market share in 2025, followed by Yili Com Inc. at xx%, and Bright Dairy & Food Co Ltd at xx%. (Note: These figures are estimates based on available data).
- M&A Activity: The report includes a detailed analysis of significant M&A transactions in the APAC drinkable yoghurt market since 2019, including deal values and their impact on market consolidation. Total M&A deal value from 2019-2024 is estimated at xx Million.
APAC Drinkable Yoghurt Market Industry Evolution
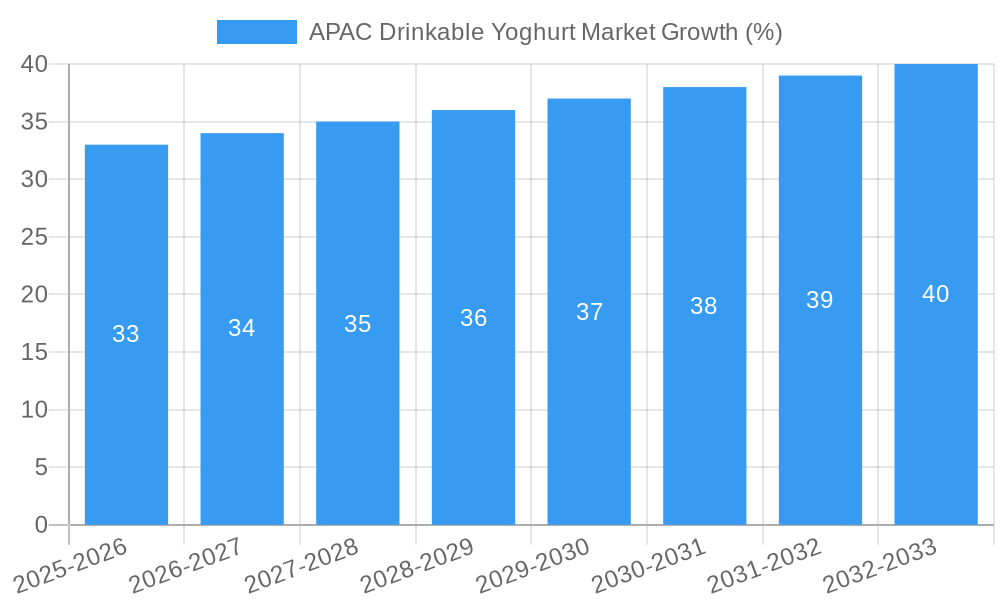
This section charts the evolution of the APAC drinkable yoghurt market from 2019 to 2024, projecting its trajectory to 2033. It analyzes market growth trajectories, highlighting key periods of expansion and contraction. Technological advancements, such as improved preservation techniques and innovative packaging solutions, have significantly influenced market growth. The report quantifies growth rates during the historical and forecast periods, detailing the impact of technological improvements and changing consumer preferences on market dynamics. The increasing demand for convenient and on-the-go food options has fueled the growth of drinkable yoghurt, particularly among younger demographics. The shift in consumer preference toward healthier, functional foods, including probiotics and low-sugar options, has also shaped market trends. The report incorporates detailed data points, including market growth rates (CAGR) for each segment, adoption rates of new technologies, and evolving consumer demographics, providing a clear picture of the market’s evolution. The market exhibited a CAGR of xx% from 2019 to 2024, and is projected to maintain a CAGR of xx% during the forecast period (2025-2033).
Leading Regions, Countries, or Segments in APAC Drinkable Yoghurt Market
This section identifies the leading regions, countries, and segments within the APAC drinkable yoghurt market.
By Distribution Channel:
- Supermarkets/Hypermarkets: Remains the dominant distribution channel, benefiting from established infrastructure and broad consumer reach.
- Convenience Stores: Shows strong growth potential, driven by increasing consumer demand for on-the-go convenience.
- Online Retailers: Experiences significant growth, facilitated by the rise of e-commerce and online grocery shopping.
By Country:
- China: Dominates the market due to its large population and expanding middle class.
- India: Exhibits high growth potential, fueled by rising disposable incomes and increasing health consciousness.
- Japan: Displays a mature market, characterized by established brands and consumer preference for premium products.
By Category:
- Dairy-based yogurt: Remains the leading category, driven by established consumer preferences and widespread availability.
- Non-dairy based yogurt: Demonstrates significant growth, driven by increasing health consciousness and the rise of veganism.
By Type:
- Flavored yogurt: Dominates the market, driven by consumer preference for diverse taste profiles.
- Plain yogurt: Represents a significant segment, appealing to health-conscious consumers seeking simple, unadulterated products.
Key Drivers:
Investment in production and distribution infrastructure Government regulations promoting dairy farming Health awareness campaigns highlighting the benefits of yogurt
The dominance of specific segments is driven by factors such as strong consumer demand, established distribution networks, favorable regulatory environments, and effective marketing strategies.
APAP Drinkable Yoghurt Market Product Innovations
Recent innovations in the APAP drinkable yoghurt market include the introduction of functional yogurts enriched with probiotics and added nutrients, along with a wider variety of flavors catering to diverse palates. Sustainable packaging solutions are also gaining traction, reflecting increasing environmental concerns. These innovations cater to the rising demand for healthy, convenient, and environmentally conscious food options, enhancing the appeal of drinkable yoghurts to a broad range of consumers. Furthermore, technological advancements in preservation techniques allow for extended shelf life and improved product quality.
Propelling Factors for APAC Drinkable Yoghurt Market Growth
Several factors propel the growth of the APAC drinkable yoghurt market. The rising disposable incomes in many APAC countries contribute significantly to increasing consumer spending on premium and convenient food products. Technological advancements in production and packaging enhance efficiency and extend shelf life. Government regulations supporting the dairy industry further facilitate market expansion.
Obstacles in the APAC Drinkable Yoghurt Market
The APAC drinkable yoghurt market faces challenges, such as intense competition among existing and emerging players, resulting in price wars that can squeeze profit margins. Fluctuations in raw material prices (e.g., milk) also impact production costs, while supply chain disruptions due to various factors, including pandemics and geopolitical events, lead to instability. Furthermore, varying regulatory requirements across different APAC countries introduce complexities for companies operating across multiple markets.
Future Opportunities in APAC Drinkable Yoghurt Market
Future opportunities include the expansion into new markets with growing populations and rising disposable incomes. The development of innovative products, such as personalized yogurts tailored to specific health needs and preferences, is an attractive area. Leveraging e-commerce channels for wider market reach and exploring new product formats, such as organic and plant-based alternatives, offer potential avenues for growth.
Major Players in the APAC Drinkable Yoghurt Market Ecosystem
- Nestle
- Bright Dairy & Food Co Ltd
- Bachfun Pvt Ltd (againdrinks.com)
- Epigamia
- Chobani LLC
- Yili Com Inc
Key Developments in APAC Drinkable Yoghurt Market Industry
- January 2023: Nestle launches a new range of plant-based drinkable yogurts in Australia.
- June 2022: Yili Com Inc. invests xx Million in a new production facility in China.
- October 2021: Bright Dairy & Food Co Ltd acquires a smaller yoghurt producer in India. (Note: Specific dates and values for some events may require further investigation).
Strategic APAC Drinkable Yoghurt Market Forecast
The APAC drinkable yoghurt market is poised for significant growth driven by evolving consumer preferences toward health and convenience, coupled with technological innovations leading to improved product quality and efficiency. This report projects a positive growth trajectory, with considerable potential for expansion in key markets and within specific segments. The market is expected to continue benefiting from factors such as increasing disposable incomes, urbanization, and rising health awareness. The continued expansion of e-commerce channels will further augment market growth.
APAC Drinkable Yoghurt Market Segmentation
-
1. Category
- 1.1. Dairy-based yogurt
- 1.2. Non-dairy based yogurt
-
2. Type
- 2.1. Plain yogurt
- 2.2. Flavored yogurt
-
3. Distribution Channel
- 3.1. Supermarkets/Hypermarkets
- 3.2. Convenience Stores
- 3.3. Specialty Stores
- 3.4. Online Retailers
- 3.5. Others
APAC Drinkable Yoghurt Market Segmentation By Geography
-
1. North America
- 1.1. United States
- 1.2. Canada
- 1.3. Mexico
-
2. South America
- 2.1. Brazil
- 2.2. Argentina
- 2.3. Rest of South America
-
3. Europe
- 3.1. United Kingdom
- 3.2. Germany
- 3.3. France
- 3.4. Italy
- 3.5. Spain
- 3.6. Russia
- 3.7. Benelux
- 3.8. Nordics
- 3.9. Rest of Europe
-
4. Middle East & Africa
- 4.1. Turkey
- 4.2. Israel
- 4.3. GCC
- 4.4. North Africa
- 4.5. South Africa
- 4.6. Rest of Middle East & Africa
-
5. Asia Pacific
- 5.1. China
- 5.2. India
- 5.3. Japan
- 5.4. South Korea
- 5.5. ASEAN
- 5.6. Oceania
- 5.7. Rest of Asia Pacific
APAC Drinkable Yoghurt Market REPORT HIGHLIGHTS
| Aspects | Details |
|---|---|
| Study Period | 2019-2033 |
| Base Year | 2024 |
| Estimated Year | 2025 |
| Forecast Period | 2025-2033 |
| Historical Period | 2019-2024 |
| Growth Rate | CAGR of 2.20% from 2019-2033 |
| Segmentation |
|
Table of Contents
- 1. Introduction
- 1.1. Research Scope
- 1.2. Market Segmentation
- 1.3. Research Methodology
- 1.4. Definitions and Assumptions
- 2. Executive Summary
- 2.1. Introduction
- 3. Market Dynamics
- 3.1. Introduction
- 3.2. Market Drivers
- 3.2.1. Increasing Consumer Demand for Products with Low Environmental Impacts; Dedicated Policies and Government Efforts to Promote the use of Biotechnology
- 3.3. Market Restrains
- 3.3.1. Deteriorating Fertility of Agricultural Lands
- 3.4. Market Trends
- 3.4.1. Growing Demand for Probiotic Food & Beverages
- 4. Market Factor Analysis
- 4.1. Porters Five Forces
- 4.2. Supply/Value Chain
- 4.3. PESTEL analysis
- 4.4. Market Entropy
- 4.5. Patent/Trademark Analysis
- 5. Global APAC Drinkable Yoghurt Market Analysis, Insights and Forecast, 2019-2031
- 5.1. Market Analysis, Insights and Forecast - by Category
- 5.1.1. Dairy-based yogurt
- 5.1.2. Non-dairy based yogurt
- 5.2. Market Analysis, Insights and Forecast - by Type
- 5.2.1. Plain yogurt
- 5.2.2. Flavored yogurt
- 5.3. Market Analysis, Insights and Forecast - by Distribution Channel
- 5.3.1. Supermarkets/Hypermarkets
- 5.3.2. Convenience Stores
- 5.3.3. Specialty Stores
- 5.3.4. Online Retailers
- 5.3.5. Others
- 5.4. Market Analysis, Insights and Forecast - by Region
- 5.4.1. North America
- 5.4.2. South America
- 5.4.3. Europe
- 5.4.4. Middle East & Africa
- 5.4.5. Asia Pacific
- 5.1. Market Analysis, Insights and Forecast - by Category
- 6. North America APAC Drinkable Yoghurt Market Analysis, Insights and Forecast, 2019-2031
- 6.1. Market Analysis, Insights and Forecast - by Category
- 6.1.1. Dairy-based yogurt
- 6.1.2. Non-dairy based yogurt
- 6.2. Market Analysis, Insights and Forecast - by Type
- 6.2.1. Plain yogurt
- 6.2.2. Flavored yogurt
- 6.3. Market Analysis, Insights and Forecast - by Distribution Channel
- 6.3.1. Supermarkets/Hypermarkets
- 6.3.2. Convenience Stores
- 6.3.3. Specialty Stores
- 6.3.4. Online Retailers
- 6.3.5. Others
- 6.1. Market Analysis, Insights and Forecast - by Category
- 7. South America APAC Drinkable Yoghurt Market Analysis, Insights and Forecast, 2019-2031
- 7.1. Market Analysis, Insights and Forecast - by Category
- 7.1.1. Dairy-based yogurt
- 7.1.2. Non-dairy based yogurt
- 7.2. Market Analysis, Insights and Forecast - by Type
- 7.2.1. Plain yogurt
- 7.2.2. Flavored yogurt
- 7.3. Market Analysis, Insights and Forecast - by Distribution Channel
- 7.3.1. Supermarkets/Hypermarkets
- 7.3.2. Convenience Stores
- 7.3.3. Specialty Stores
- 7.3.4. Online Retailers
- 7.3.5. Others
- 7.1. Market Analysis, Insights and Forecast - by Category
- 8. Europe APAC Drinkable Yoghurt Market Analysis, Insights and Forecast, 2019-2031
- 8.1. Market Analysis, Insights and Forecast - by Category
- 8.1.1. Dairy-based yogurt
- 8.1.2. Non-dairy based yogurt
- 8.2. Market Analysis, Insights and Forecast - by Type
- 8.2.1. Plain yogurt
- 8.2.2. Flavored yogurt
- 8.3. Market Analysis, Insights and Forecast - by Distribution Channel
- 8.3.1. Supermarkets/Hypermarkets
- 8.3.2. Convenience Stores
- 8.3.3. Specialty Stores
- 8.3.4. Online Retailers
- 8.3.5. Others
- 8.1. Market Analysis, Insights and Forecast - by Category
- 9. Middle East & Africa APAC Drinkable Yoghurt Market Analysis, Insights and Forecast, 2019-2031
- 9.1. Market Analysis, Insights and Forecast - by Category
- 9.1.1. Dairy-based yogurt
- 9.1.2. Non-dairy based yogurt
- 9.2. Market Analysis, Insights and Forecast - by Type
- 9.2.1. Plain yogurt
- 9.2.2. Flavored yogurt
- 9.3. Market Analysis, Insights and Forecast - by Distribution Channel
- 9.3.1. Supermarkets/Hypermarkets
- 9.3.2. Convenience Stores
- 9.3.3. Specialty Stores
- 9.3.4. Online Retailers
- 9.3.5. Others
- 9.1. Market Analysis, Insights and Forecast - by Category
- 10. Asia Pacific APAC Drinkable Yoghurt Market Analysis, Insights and Forecast, 2019-2031
- 10.1. Market Analysis, Insights and Forecast - by Category
- 10.1.1. Dairy-based yogurt
- 10.1.2. Non-dairy based yogurt
- 10.2. Market Analysis, Insights and Forecast - by Type
- 10.2.1. Plain yogurt
- 10.2.2. Flavored yogurt
- 10.3. Market Analysis, Insights and Forecast - by Distribution Channel
- 10.3.1. Supermarkets/Hypermarkets
- 10.3.2. Convenience Stores
- 10.3.3. Specialty Stores
- 10.3.4. Online Retailers
- 10.3.5. Others
- 10.1. Market Analysis, Insights and Forecast - by Category
- 11. Competitive Analysis
- 11.1. Global Market Share Analysis 2024
- 11.2. Company Profiles
- 11.2.1 Nestle
- 11.2.1.1. Overview
- 11.2.1.2. Products
- 11.2.1.3. SWOT Analysis
- 11.2.1.4. Recent Developments
- 11.2.1.5. Financials (Based on Availability)
- 11.2.2 Bright Dairy & Food Co Ltd
- 11.2.2.1. Overview
- 11.2.2.2. Products
- 11.2.2.3. SWOT Analysis
- 11.2.2.4. Recent Developments
- 11.2.2.5. Financials (Based on Availability)
- 11.2.3 Bachfun Pvt Ltd (againdrinks com)*List Not Exhaustive
- 11.2.3.1. Overview
- 11.2.3.2. Products
- 11.2.3.3. SWOT Analysis
- 11.2.3.4. Recent Developments
- 11.2.3.5. Financials (Based on Availability)
- 11.2.4 Epigamia
- 11.2.4.1. Overview
- 11.2.4.2. Products
- 11.2.4.3. SWOT Analysis
- 11.2.4.4. Recent Developments
- 11.2.4.5. Financials (Based on Availability)
- 11.2.5 Chobani LLC
- 11.2.5.1. Overview
- 11.2.5.2. Products
- 11.2.5.3. SWOT Analysis
- 11.2.5.4. Recent Developments
- 11.2.5.5. Financials (Based on Availability)
- 11.2.6 Yili Com Inc
- 11.2.6.1. Overview
- 11.2.6.2. Products
- 11.2.6.3. SWOT Analysis
- 11.2.6.4. Recent Developments
- 11.2.6.5. Financials (Based on Availability)
- 11.2.1 Nestle
List of Figures
- Figure 1: Global APAC Drinkable Yoghurt Market Revenue Breakdown (Million, %) by Region 2024 & 2032
- Figure 2: North America APAC Drinkable Yoghurt Market Revenue (Million), by Category 2024 & 2032
- Figure 3: North America APAC Drinkable Yoghurt Market Revenue Share (%), by Category 2024 & 2032
- Figure 4: North America APAC Drinkable Yoghurt Market Revenue (Million), by Type 2024 & 2032
- Figure 5: North America APAC Drinkable Yoghurt Market Revenue Share (%), by Type 2024 & 2032
- Figure 6: North America APAC Drinkable Yoghurt Market Revenue (Million), by Distribution Channel 2024 & 2032
- Figure 7: North America APAC Drinkable Yoghurt Market Revenue Share (%), by Distribution Channel 2024 & 2032
- Figure 8: North America APAC Drinkable Yoghurt Market Revenue (Million), by Country 2024 & 2032
- Figure 9: North America APAC Drinkable Yoghurt Market Revenue Share (%), by Country 2024 & 2032
- Figure 10: South America APAC Drinkable Yoghurt Market Revenue (Million), by Category 2024 & 2032
- Figure 11: South America APAC Drinkable Yoghurt Market Revenue Share (%), by Category 2024 & 2032
- Figure 12: South America APAC Drinkable Yoghurt Market Revenue (Million), by Type 2024 & 2032
- Figure 13: South America APAC Drinkable Yoghurt Market Revenue Share (%), by Type 2024 & 2032
- Figure 14: South America APAC Drinkable Yoghurt Market Revenue (Million), by Distribution Channel 2024 & 2032
- Figure 15: South America APAC Drinkable Yoghurt Market Revenue Share (%), by Distribution Channel 2024 & 2032
- Figure 16: South America APAC Drinkable Yoghurt Market Revenue (Million), by Country 2024 & 2032
- Figure 17: South America APAC Drinkable Yoghurt Market Revenue Share (%), by Country 2024 & 2032
- Figure 18: Europe APAC Drinkable Yoghurt Market Revenue (Million), by Category 2024 & 2032
- Figure 19: Europe APAC Drinkable Yoghurt Market Revenue Share (%), by Category 2024 & 2032
- Figure 20: Europe APAC Drinkable Yoghurt Market Revenue (Million), by Type 2024 & 2032
- Figure 21: Europe APAC Drinkable Yoghurt Market Revenue Share (%), by Type 2024 & 2032
- Figure 22: Europe APAC Drinkable Yoghurt Market Revenue (Million), by Distribution Channel 2024 & 2032
- Figure 23: Europe APAC Drinkable Yoghurt Market Revenue Share (%), by Distribution Channel 2024 & 2032
- Figure 24: Europe APAC Drinkable Yoghurt Market Revenue (Million), by Country 2024 & 2032
- Figure 25: Europe APAC Drinkable Yoghurt Market Revenue Share (%), by Country 2024 & 2032
- Figure 26: Middle East & Africa APAC Drinkable Yoghurt Market Revenue (Million), by Category 2024 & 2032
- Figure 27: Middle East & Africa APAC Drinkable Yoghurt Market Revenue Share (%), by Category 2024 & 2032
- Figure 28: Middle East & Africa APAC Drinkable Yoghurt Market Revenue (Million), by Type 2024 & 2032
- Figure 29: Middle East & Africa APAC Drinkable Yoghurt Market Revenue Share (%), by Type 2024 & 2032
- Figure 30: Middle East & Africa APAC Drinkable Yoghurt Market Revenue (Million), by Distribution Channel 2024 & 2032
- Figure 31: Middle East & Africa APAC Drinkable Yoghurt Market Revenue Share (%), by Distribution Channel 2024 & 2032
- Figure 32: Middle East & Africa APAC Drinkable Yoghurt Market Revenue (Million), by Country 2024 & 2032
- Figure 33: Middle East & Africa APAC Drinkable Yoghurt Market Revenue Share (%), by Country 2024 & 2032
- Figure 34: Asia Pacific APAC Drinkable Yoghurt Market Revenue (Million), by Category 2024 & 2032
- Figure 35: Asia Pacific APAC Drinkable Yoghurt Market Revenue Share (%), by Category 2024 & 2032
- Figure 36: Asia Pacific APAC Drinkable Yoghurt Market Revenue (Million), by Type 2024 & 2032
- Figure 37: Asia Pacific APAC Drinkable Yoghurt Market Revenue Share (%), by Type 2024 & 2032
- Figure 38: Asia Pacific APAC Drinkable Yoghurt Market Revenue (Million), by Distribution Channel 2024 & 2032
- Figure 39: Asia Pacific APAC Drinkable Yoghurt Market Revenue Share (%), by Distribution Channel 2024 & 2032
- Figure 40: Asia Pacific APAC Drinkable Yoghurt Market Revenue (Million), by Country 2024 & 2032
- Figure 41: Asia Pacific APAC Drinkable Yoghurt Market Revenue Share (%), by Country 2024 & 2032
List of Tables
- Table 1: Global APAC Drinkable Yoghurt Market Revenue Million Forecast, by Region 2019 & 2032
- Table 2: Global APAC Drinkable Yoghurt Market Revenue Million Forecast, by Category 2019 & 2032
- Table 3: Global APAC Drinkable Yoghurt Market Revenue Million Forecast, by Type 2019 & 2032
- Table 4: Global APAC Drinkable Yoghurt Market Revenue Million Forecast, by Distribution Channel 2019 & 2032
- Table 5: Global APAC Drinkable Yoghurt Market Revenue Million Forecast, by Region 2019 & 2032
- Table 6: Global APAC Drinkable Yoghurt Market Revenue Million Forecast, by Category 2019 & 2032
- Table 7: Global APAC Drinkable Yoghurt Market Revenue Million Forecast, by Type 2019 & 2032
- Table 8: Global APAC Drinkable Yoghurt Market Revenue Million Forecast, by Distribution Channel 2019 & 2032
- Table 9: Global APAC Drinkable Yoghurt Market Revenue Million Forecast, by Country 2019 & 2032
- Table 10: United States APAC Drinkable Yoghurt Market Revenue (Million) Forecast, by Application 2019 & 2032
- Table 11: Canada APAC Drinkable Yoghurt Market Revenue (Million) Forecast, by Application 2019 & 2032
- Table 12: Mexico APAC Drinkable Yoghurt Market Revenue (Million) Forecast, by Application 2019 & 2032
- Table 13: Global APAC Drinkable Yoghurt Market Revenue Million Forecast, by Category 2019 & 2032
- Table 14: Global APAC Drinkable Yoghurt Market Revenue Million Forecast, by Type 2019 & 2032
- Table 15: Global APAC Drinkable Yoghurt Market Revenue Million Forecast, by Distribution Channel 2019 & 2032
- Table 16: Global APAC Drinkable Yoghurt Market Revenue Million Forecast, by Country 2019 & 2032
- Table 17: Brazil APAC Drinkable Yoghurt Market Revenue (Million) Forecast, by Application 2019 & 2032
- Table 18: Argentina APAC Drinkable Yoghurt Market Revenue (Million) Forecast, by Application 2019 & 2032
- Table 19: Rest of South America APAC Drinkable Yoghurt Market Revenue (Million) Forecast, by Application 2019 & 2032
- Table 20: Global APAC Drinkable Yoghurt Market Revenue Million Forecast, by Category 2019 & 2032
- Table 21: Global APAC Drinkable Yoghurt Market Revenue Million Forecast, by Type 2019 & 2032
- Table 22: Global APAC Drinkable Yoghurt Market Revenue Million Forecast, by Distribution Channel 2019 & 2032
- Table 23: Global APAC Drinkable Yoghurt Market Revenue Million Forecast, by Country 2019 & 2032
- Table 24: United Kingdom APAC Drinkable Yoghurt Market Revenue (Million) Forecast, by Application 2019 & 2032
- Table 25: Germany APAC Drinkable Yoghurt Market Revenue (Million) Forecast, by Application 2019 & 2032
- Table 26: France APAC Drinkable Yoghurt Market Revenue (Million) Forecast, by Application 2019 & 2032
- Table 27: Italy APAC Drinkable Yoghurt Market Revenue (Million) Forecast, by Application 2019 & 2032
- Table 28: Spain APAC Drinkable Yoghurt Market Revenue (Million) Forecast, by Application 2019 & 2032
- Table 29: Russia APAC Drinkable Yoghurt Market Revenue (Million) Forecast, by Application 2019 & 2032
- Table 30: Benelux APAC Drinkable Yoghurt Market Revenue (Million) Forecast, by Application 2019 & 2032
- Table 31: Nordics APAC Drinkable Yoghurt Market Revenue (Million) Forecast, by Application 2019 & 2032
- Table 32: Rest of Europe APAC Drinkable Yoghurt Market Revenue (Million) Forecast, by Application 2019 & 2032
- Table 33: Global APAC Drinkable Yoghurt Market Revenue Million Forecast, by Category 2019 & 2032
- Table 34: Global APAC Drinkable Yoghurt Market Revenue Million Forecast, by Type 2019 & 2032
- Table 35: Global APAC Drinkable Yoghurt Market Revenue Million Forecast, by Distribution Channel 2019 & 2032
- Table 36: Global APAC Drinkable Yoghurt Market Revenue Million Forecast, by Country 2019 & 2032
- Table 37: Turkey APAC Drinkable Yoghurt Market Revenue (Million) Forecast, by Application 2019 & 2032
- Table 38: Israel APAC Drinkable Yoghurt Market Revenue (Million) Forecast, by Application 2019 & 2032
- Table 39: GCC APAC Drinkable Yoghurt Market Revenue (Million) Forecast, by Application 2019 & 2032
- Table 40: North Africa APAC Drinkable Yoghurt Market Revenue (Million) Forecast, by Application 2019 & 2032
- Table 41: South Africa APAC Drinkable Yoghurt Market Revenue (Million) Forecast, by Application 2019 & 2032
- Table 42: Rest of Middle East & Africa APAC Drinkable Yoghurt Market Revenue (Million) Forecast, by Application 2019 & 2032
- Table 43: Global APAC Drinkable Yoghurt Market Revenue Million Forecast, by Category 2019 & 2032
- Table 44: Global APAC Drinkable Yoghurt Market Revenue Million Forecast, by Type 2019 & 2032
- Table 45: Global APAC Drinkable Yoghurt Market Revenue Million Forecast, by Distribution Channel 2019 & 2032
- Table 46: Global APAC Drinkable Yoghurt Market Revenue Million Forecast, by Country 2019 & 2032
- Table 47: China APAC Drinkable Yoghurt Market Revenue (Million) Forecast, by Application 2019 & 2032
- Table 48: India APAC Drinkable Yoghurt Market Revenue (Million) Forecast, by Application 2019 & 2032
- Table 49: Japan APAC Drinkable Yoghurt Market Revenue (Million) Forecast, by Application 2019 & 2032
- Table 50: South Korea APAC Drinkable Yoghurt Market Revenue (Million) Forecast, by Application 2019 & 2032
- Table 51: ASEAN APAC Drinkable Yoghurt Market Revenue (Million) Forecast, by Application 2019 & 2032
- Table 52: Oceania APAC Drinkable Yoghurt Market Revenue (Million) Forecast, by Application 2019 & 2032
- Table 53: Rest of Asia Pacific APAC Drinkable Yoghurt Market Revenue (Million) Forecast, by Application 2019 & 2032
Frequently Asked Questions
1. What is the projected Compound Annual Growth Rate (CAGR) of the APAC Drinkable Yoghurt Market?
The projected CAGR is approximately 2.20%.
2. Which companies are prominent players in the APAC Drinkable Yoghurt Market?
Key companies in the market include Nestle, Bright Dairy & Food Co Ltd, Bachfun Pvt Ltd (againdrinks com)*List Not Exhaustive, Epigamia, Chobani LLC, Yili Com Inc.
3. What are the main segments of the APAC Drinkable Yoghurt Market?
The market segments include Category, Type, Distribution Channel.
4. Can you provide details about the market size?
The market size is estimated to be USD XX Million as of 2022.
5. What are some drivers contributing to market growth?
Increasing Consumer Demand for Products with Low Environmental Impacts; Dedicated Policies and Government Efforts to Promote the use of Biotechnology.
6. What are the notable trends driving market growth?
Growing Demand for Probiotic Food & Beverages.
7. Are there any restraints impacting market growth?
Deteriorating Fertility of Agricultural Lands.
8. Can you provide examples of recent developments in the market?
N/A
9. What pricing options are available for accessing the report?
Pricing options include single-user, multi-user, and enterprise licenses priced at USD 3800, USD 4500, and USD 5800 respectively.
10. Is the market size provided in terms of value or volume?
The market size is provided in terms of value, measured in Million.
11. Are there any specific market keywords associated with the report?
Yes, the market keyword associated with the report is "APAC Drinkable Yoghurt Market," which aids in identifying and referencing the specific market segment covered.
12. How do I determine which pricing option suits my needs best?
The pricing options vary based on user requirements and access needs. Individual users may opt for single-user licenses, while businesses requiring broader access may choose multi-user or enterprise licenses for cost-effective access to the report.
13. Are there any additional resources or data provided in the APAC Drinkable Yoghurt Market report?
While the report offers comprehensive insights, it's advisable to review the specific contents or supplementary materials provided to ascertain if additional resources or data are available.
14. How can I stay updated on further developments or reports in the APAC Drinkable Yoghurt Market?
To stay informed about further developments, trends, and reports in the APAC Drinkable Yoghurt Market, consider subscribing to industry newsletters, following relevant companies and organizations, or regularly checking reputable industry news sources and publications.
Methodology
Step 1 - Identification of Relevant Samples Size from Population Database


Step 2 - Approaches for Defining Global Market Size (Value, Volume* & Price*)

Note*: In applicable scenarios
Step 3 - Data Sources
Primary Research
- Web Analytics
- Survey Reports
- Research Institute
- Latest Research Reports
- Opinion Leaders
Secondary Research
- Annual Reports
- White Paper
- Latest Press Release
- Industry Association
- Paid Database
- Investor Presentations

Step 4 - Data Triangulation
Involves using different sources of information in order to increase the validity of a study
These sources are likely to be stakeholders in a program - participants, other researchers, program staff, other community members, and so on.
Then we put all data in single framework & apply various statistical tools to find out the dynamic on the market.
During the analysis stage, feedback from the stakeholder groups would be compared to determine areas of agreement as well as areas of divergence
