

Key Insights
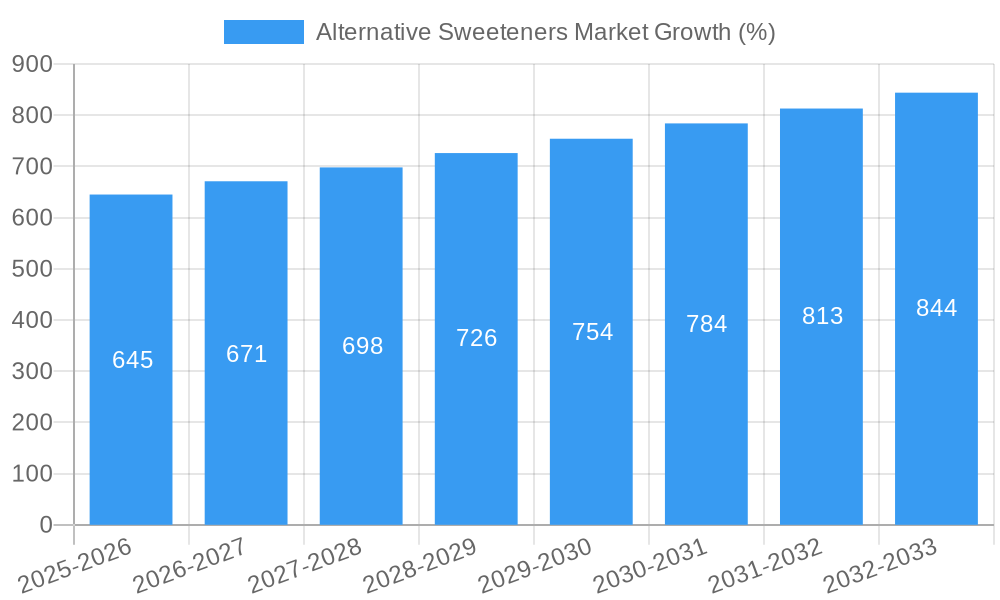
The global alternative sweeteners market, valued at approximately $XX million in 2025, is projected to experience robust growth, exhibiting a compound annual growth rate (CAGR) of 4.30% from 2025 to 2033. This expansion is driven by several key factors. The rising prevalence of diabetes and obesity globally fuels demand for healthier sugar substitutes. Consumers are increasingly aware of the negative health impacts associated with high sugar intake, leading to a shift towards low-calorie and sugar-free options in food and beverages. Furthermore, the growing demand for convenient and ready-to-consume foods and beverages, many of which incorporate alternative sweeteners, significantly contributes to market growth. The expanding food and beverage industry, coupled with the increasing popularity of functional foods and beverages, further strengthens this trend. Technological advancements in sweetener production, leading to improved taste profiles and cost-effectiveness, also play a crucial role. Different segments within the market show varying growth trajectories. High-intensity sweeteners, owing to their potent sweetening power and versatility, are expected to witness faster growth compared to low-intensity sweeteners. The pharmaceuticals segment, leveraging alternative sweeteners in drug formulations, also contributes significantly to market expansion. Geographical variations exist, with North America and Europe currently holding a significant market share; however, the Asia-Pacific region is anticipated to exhibit substantial growth potential in the coming years due to rising disposable incomes and changing dietary habits.
Despite the optimistic outlook, certain market restraints exist. Concerns regarding the potential long-term health effects of certain alternative sweeteners continue to be a topic of ongoing research and public debate. Regulatory hurdles and varying approval statuses for different sweeteners across different regions can also impede market growth. The price fluctuations of raw materials and competition from established sugar producers are additional factors influencing market dynamics. Nevertheless, the overall trend points toward a continuously expanding market for alternative sweeteners, driven by evolving consumer preferences and the increasing need for healthier food and beverage options. Key players like Cargill, Ingredion, and Ajinomoto are actively involved in research and development, striving to innovate and cater to the growing demand. Strategic collaborations, product diversification, and market expansion into emerging economies will be vital for maintaining competitiveness in this dynamic market.
Alternative Sweeteners Market Report: A Comprehensive Analysis (2019-2033)
This insightful report provides a comprehensive analysis of the global Alternative Sweeteners Market, offering a detailed examination of market trends, leading players, and future growth prospects. The study covers the period from 2019 to 2033, with 2025 serving as the base and estimated year. The forecast period extends from 2025 to 2033, while the historical period encompasses 2019-2024. Valuations are expressed in Millions. This report is crucial for stakeholders seeking to understand the dynamics of this rapidly evolving market and make informed strategic decisions.
Alternative Sweeteners Market Composition & Trends
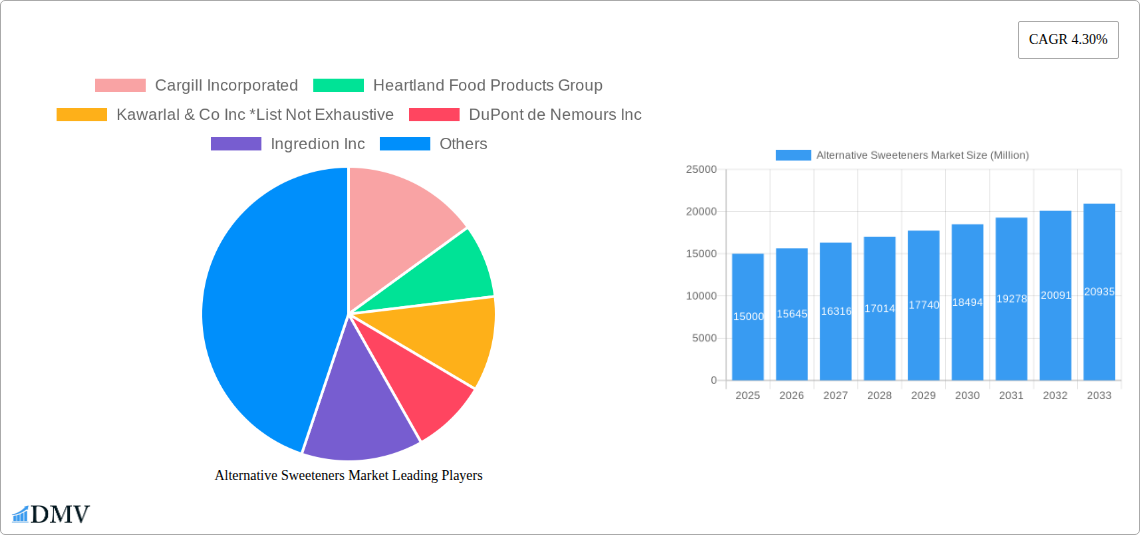
This section delves into the competitive landscape of the alternative sweeteners market, analyzing market concentration, innovation drivers, regulatory hurdles, substitute products, end-user preferences, and mergers & acquisitions (M&A) activity. We examine the market share distribution among key players, including Cargill Incorporated, DuPont de Nemours Inc, Ingredion Inc, Archer Daniels Midland Company, Ajinomoto Co Inc, PureCircle Ltd, Roquette Freres, and Stevia First Corporation, along with smaller players like Heartland Food Products Group and Kawarlal & Co Inc. The analysis also incorporates an evaluation of M&A deal values, revealing the strategic shifts in the industry and their impact on market dynamics. We quantify market concentration using the Herfindahl-Hirschman Index (HHI) at xx and analyze the impact of regulatory changes on market share and pricing. The report also features detailed analysis of substitute products, impacting the market share of high fructose corn syrup with a projected market share of xx% in 2033.
- Market Concentration: HHI of xx in 2025, indicating a xx competitive landscape.
- Innovation Catalysts: Focus on stevia and monk fruit based sweeteners, and the development of novel sweetener combinations driving innovation.
- Regulatory Landscape: Impact of labeling regulations and health guidelines on market segmentation.
- Substitute Products: Analysis of sugar and sugar alcohols' impact on market growth.
- End-User Profiles: Detailed examination of consumer preferences across food and beverage, pharmaceutical, and other sectors.
- M&A Activity: Review of significant transactions in the last five years, with a total deal value of approximately $xx Million.
Alternative Sweeteners Market Industry Evolution
This section provides a detailed analysis of the alternative sweeteners market's evolution, encompassing growth trajectories, technological advancements, and evolving consumer preferences. We examine the historical growth rate of xx% from 2019 to 2024 and project a Compound Annual Growth Rate (CAGR) of xx% from 2025 to 2033, driven by factors such as the rising prevalence of diabetes and growing health consciousness. Technological innovations, such as the development of next-generation sweeteners with improved taste and functionality, are also analyzed in depth. We explore the shifting consumer demand towards natural and healthier alternatives to traditional sugar, impacting the market share of natural sweeteners, projected to reach xx% by 2033. The adoption rate of high-intensity sweeteners is evaluated, showing a xx% increase from 2024 to 2025.
Leading Regions, Countries, or Segments in Alternative Sweeteners Market
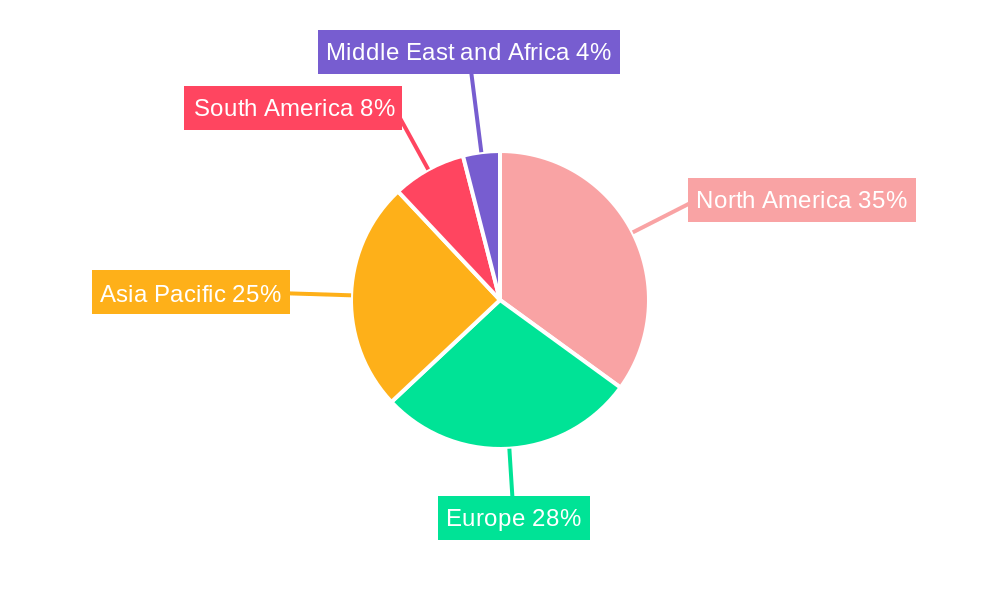
This section pinpoints the leading regions, countries, and segments within the alternative sweeteners market. North America is currently the dominant region, holding approximately xx% of the global market share in 2025 due to factors such as robust regulatory frameworks and high consumer awareness. However, the Asia-Pacific region is projected to experience the fastest growth during the forecast period, driven by rising disposable incomes and a growing health-conscious population. We also analyze market segmentation across the key parameters – Source (Natural vs. Synthetic), Application (Food & Beverages, Pharmaceuticals, Others), and Product Type (High Fructose Syrup, High-Intensity Sweeteners, Low-Intensity Sweeteners).
- Key Drivers for North America: Strong regulatory framework, high consumer awareness of health risks, and established distribution channels.
- Key Drivers for Asia-Pacific: Rapidly growing middle class, increasing disposable incomes, and rising health consciousness.
- Dominant Segment: The Food and Beverage segment accounts for xx% of the market. High-intensity sweeteners dominate the product type segment with a projected market share of xx% in 2033.
- Dominant Source: Natural sweeteners are gaining popularity, projected to hold xx% of the market by 2033.
Alternative Sweeteners Market Product Innovations
The alternative sweeteners market witnesses continuous innovation. New product launches include improved stevia formulations addressing taste challenges, the emergence of novel sweeteners like monk fruit extracts, and advancements in the production of sugar alcohols with better functional properties. These innovations focus on enhancing sweetness, improving texture and mouthfeel, and addressing consumer concerns about aftertaste. Companies are also exploring innovative applications, including functional foods and beverages, expanding the market potential.
Propelling Factors for Alternative Sweeteners Market Growth
Several factors fuel the growth of the alternative sweeteners market. The rising prevalence of diabetes and obesity globally significantly drives demand for healthier alternatives to sugar. Growing consumer awareness of the health risks associated with excessive sugar consumption also contributes. Furthermore, stringent regulations regarding sugar content in food products and supportive government initiatives further propel market expansion. Technological advancements that enhance the taste and functionality of alternative sweeteners also play a significant role.
Obstacles in the Alternative Sweeteners Market
Despite the strong growth potential, the alternative sweeteners market faces several challenges. Regulatory hurdles regarding the approval and labeling of novel sweeteners can hinder market entry for new players. Supply chain disruptions and price volatility of raw materials can affect profitability. Intense competition among established players also adds to the pressure. The market share of High Fructose Corn Syrup is declining because of this challenge showing a xx% decrease from 2024 to 2025.
Future Opportunities in Alternative Sweeteners Market
Emerging opportunities include the expansion into new markets, particularly in developing economies with rapidly growing middle classes. The development and commercialization of innovative sweetener technologies, such as those focusing on improved taste profiles and functionality, also present significant prospects. Exploiting new application areas, like functional foods and beverages that offer health benefits beyond sweetness, can create further growth opportunities.
Major Players in the Alternative Sweeteners Market Ecosystem
- Cargill Incorporated
- Heartland Food Products Group
- Kawarlal & Co Inc
- DuPont de Nemours Inc
- Ingredion Inc
- Archer Daniels Midland Company
- Ajinomoto Co Inc
- PureCircle Ltd
- Roquette Freres
- Stevia First Corporation
Key Developments in Alternative Sweeteners Market Industry
- January 2023: Ingredion Inc. launched a new line of stevia-based sweeteners.
- June 2022: Cargill Incorporated and PureCircle Ltd announced a joint venture to expand stevia production.
- October 2021: Ajinomoto Co Inc. acquired a smaller sweetener manufacturer. (Further details are available in the full report)
(Further details and more key developments are available in the full report)
Strategic Alternative Sweeteners Market Forecast
The alternative sweeteners market is poised for robust growth in the coming years, driven by the factors discussed previously. Rising health concerns, evolving consumer preferences, and technological advancements will continue to shape market dynamics. The focus on natural and sustainably sourced sweeteners will gain further traction, creating opportunities for innovative players. The market is expected to witness a CAGR of xx% from 2025 to 2033, reaching a market value of $xx Million by 2033.
Alternative Sweeteners Market Segmentation
-
1. Product Type
- 1.1. High Fructose Syrup
- 1.2. High-Intensity Sweeteners
- 1.3. Low-Intensity Sweeteners
-
2. Source
- 2.1. Natural
- 2.2. Synthetic
-
3. Application
-
3.1. Food and Beverages
- 3.1.1. Bakery
- 3.1.2. Confectionery
- 3.1.3. Dairy
- 3.1.4. Others
- 3.2. Pharmaceuticals
-
3.1. Food and Beverages
Alternative Sweeteners Market Segmentation By Geography
-
1. North America
- 1.1. United States
- 1.2. Canada
- 1.3. Mexico
- 1.4. Rest of North America
-
2. Europe
- 2.1. Spain
- 2.2. United Kingdom
- 2.3. Germany
- 2.4. France
- 2.5. Italy
- 2.6. Russia
- 2.7. Rest of Europe
-
3. Asia Pacific
- 3.1. China
- 3.2. Japan
- 3.3. India
- 3.4. Australia
- 3.5. Rest of Asia Pacific
-
4. South America
- 4.1. Brazil
- 4.2. Argentina
- 4.3. Rest of South America
-
5. Middle East and Africa
- 5.1. South Africa
- 5.2. United Arab Emirates
- 5.3. Rest of Middle East and Africa
Alternative Sweeteners Market REPORT HIGHLIGHTS
| Aspects | Details |
|---|---|
| Study Period | 2019-2033 |
| Base Year | 2024 |
| Estimated Year | 2025 |
| Forecast Period | 2025-2033 |
| Historical Period | 2019-2024 |
| Growth Rate | CAGR of 4.30% from 2019-2033 |
| Segmentation |
|
Table of Contents
- 1. Introduction
- 1.1. Research Scope
- 1.2. Market Segmentation
- 1.3. Research Methodology
- 1.4. Definitions and Assumptions
- 2. Executive Summary
- 2.1. Introduction
- 3. Market Dynamics
- 3.1. Introduction
- 3.2. Market Drivers
- 3.2.1. Increasing Demand for Low-Fat and Low-Calorie Food; Increasing Product Innovation
- 3.3. Market Restrains
- 3.3.1. Higher Production Cost of Fat Replacers
- 3.4. Market Trends
- 3.4.1. Rising Number of Consumers Affected by Diabetes and Obesity
- 4. Market Factor Analysis
- 4.1. Porters Five Forces
- 4.2. Supply/Value Chain
- 4.3. PESTEL analysis
- 4.4. Market Entropy
- 4.5. Patent/Trademark Analysis
- 5. Global Alternative Sweeteners Market Analysis, Insights and Forecast, 2019-2031
- 5.1. Market Analysis, Insights and Forecast - by Product Type
- 5.1.1. High Fructose Syrup
- 5.1.2. High-Intensity Sweeteners
- 5.1.3. Low-Intensity Sweeteners
- 5.2. Market Analysis, Insights and Forecast - by Source
- 5.2.1. Natural
- 5.2.2. Synthetic
- 5.3. Market Analysis, Insights and Forecast - by Application
- 5.3.1. Food and Beverages
- 5.3.1.1. Bakery
- 5.3.1.2. Confectionery
- 5.3.1.3. Dairy
- 5.3.1.4. Others
- 5.3.2. Pharmaceuticals
- 5.3.1. Food and Beverages
- 5.4. Market Analysis, Insights and Forecast - by Region
- 5.4.1. North America
- 5.4.2. Europe
- 5.4.3. Asia Pacific
- 5.4.4. South America
- 5.4.5. Middle East and Africa
- 5.1. Market Analysis, Insights and Forecast - by Product Type
- 6. North America Alternative Sweeteners Market Analysis, Insights and Forecast, 2019-2031
- 6.1. Market Analysis, Insights and Forecast - by Product Type
- 6.1.1. High Fructose Syrup
- 6.1.2. High-Intensity Sweeteners
- 6.1.3. Low-Intensity Sweeteners
- 6.2. Market Analysis, Insights and Forecast - by Source
- 6.2.1. Natural
- 6.2.2. Synthetic
- 6.3. Market Analysis, Insights and Forecast - by Application
- 6.3.1. Food and Beverages
- 6.3.1.1. Bakery
- 6.3.1.2. Confectionery
- 6.3.1.3. Dairy
- 6.3.1.4. Others
- 6.3.2. Pharmaceuticals
- 6.3.1. Food and Beverages
- 6.1. Market Analysis, Insights and Forecast - by Product Type
- 7. Europe Alternative Sweeteners Market Analysis, Insights and Forecast, 2019-2031
- 7.1. Market Analysis, Insights and Forecast - by Product Type
- 7.1.1. High Fructose Syrup
- 7.1.2. High-Intensity Sweeteners
- 7.1.3. Low-Intensity Sweeteners
- 7.2. Market Analysis, Insights and Forecast - by Source
- 7.2.1. Natural
- 7.2.2. Synthetic
- 7.3. Market Analysis, Insights and Forecast - by Application
- 7.3.1. Food and Beverages
- 7.3.1.1. Bakery
- 7.3.1.2. Confectionery
- 7.3.1.3. Dairy
- 7.3.1.4. Others
- 7.3.2. Pharmaceuticals
- 7.3.1. Food and Beverages
- 7.1. Market Analysis, Insights and Forecast - by Product Type
- 8. Asia Pacific Alternative Sweeteners Market Analysis, Insights and Forecast, 2019-2031
- 8.1. Market Analysis, Insights and Forecast - by Product Type
- 8.1.1. High Fructose Syrup
- 8.1.2. High-Intensity Sweeteners
- 8.1.3. Low-Intensity Sweeteners
- 8.2. Market Analysis, Insights and Forecast - by Source
- 8.2.1. Natural
- 8.2.2. Synthetic
- 8.3. Market Analysis, Insights and Forecast - by Application
- 8.3.1. Food and Beverages
- 8.3.1.1. Bakery
- 8.3.1.2. Confectionery
- 8.3.1.3. Dairy
- 8.3.1.4. Others
- 8.3.2. Pharmaceuticals
- 8.3.1. Food and Beverages
- 8.1. Market Analysis, Insights and Forecast - by Product Type
- 9. South America Alternative Sweeteners Market Analysis, Insights and Forecast, 2019-2031
- 9.1. Market Analysis, Insights and Forecast - by Product Type
- 9.1.1. High Fructose Syrup
- 9.1.2. High-Intensity Sweeteners
- 9.1.3. Low-Intensity Sweeteners
- 9.2. Market Analysis, Insights and Forecast - by Source
- 9.2.1. Natural
- 9.2.2. Synthetic
- 9.3. Market Analysis, Insights and Forecast - by Application
- 9.3.1. Food and Beverages
- 9.3.1.1. Bakery
- 9.3.1.2. Confectionery
- 9.3.1.3. Dairy
- 9.3.1.4. Others
- 9.3.2. Pharmaceuticals
- 9.3.1. Food and Beverages
- 9.1. Market Analysis, Insights and Forecast - by Product Type
- 10. Middle East and Africa Alternative Sweeteners Market Analysis, Insights and Forecast, 2019-2031
- 10.1. Market Analysis, Insights and Forecast - by Product Type
- 10.1.1. High Fructose Syrup
- 10.1.2. High-Intensity Sweeteners
- 10.1.3. Low-Intensity Sweeteners
- 10.2. Market Analysis, Insights and Forecast - by Source
- 10.2.1. Natural
- 10.2.2. Synthetic
- 10.3. Market Analysis, Insights and Forecast - by Application
- 10.3.1. Food and Beverages
- 10.3.1.1. Bakery
- 10.3.1.2. Confectionery
- 10.3.1.3. Dairy
- 10.3.1.4. Others
- 10.3.2. Pharmaceuticals
- 10.3.1. Food and Beverages
- 10.1. Market Analysis, Insights and Forecast - by Product Type
- 11. North America Alternative Sweeteners Market Analysis, Insights and Forecast, 2019-2031
- 11.1. Market Analysis, Insights and Forecast - By Country/Sub-region
- 11.1.1 United States
- 11.1.2 Canada
- 11.1.3 Mexico
- 11.1.4 Rest of North America
- 12. Europe Alternative Sweeteners Market Analysis, Insights and Forecast, 2019-2031
- 12.1. Market Analysis, Insights and Forecast - By Country/Sub-region
- 12.1.1 Spain
- 12.1.2 United Kingdom
- 12.1.3 Germany
- 12.1.4 France
- 12.1.5 Italy
- 12.1.6 Russia
- 12.1.7 Rest of Europe
- 13. Asia Pacific Alternative Sweeteners Market Analysis, Insights and Forecast, 2019-2031
- 13.1. Market Analysis, Insights and Forecast - By Country/Sub-region
- 13.1.1 China
- 13.1.2 Japan
- 13.1.3 India
- 13.1.4 Australia
- 13.1.5 Rest of Asia Pacific
- 14. South America Alternative Sweeteners Market Analysis, Insights and Forecast, 2019-2031
- 14.1. Market Analysis, Insights and Forecast - By Country/Sub-region
- 14.1.1 Brazil
- 14.1.2 Argentina
- 14.1.3 Rest of South America
- 15. Middle East and Africa Alternative Sweeteners Market Analysis, Insights and Forecast, 2019-2031
- 15.1. Market Analysis, Insights and Forecast - By Country/Sub-region
- 15.1.1 South Africa
- 15.1.2 United Arab Emirates
- 15.1.3 Rest of Middle East and Africa
- 16. Competitive Analysis
- 16.1. Global Market Share Analysis 2024
- 16.2. Company Profiles
- 16.2.1 Cargill Incorporated
- 16.2.1.1. Overview
- 16.2.1.2. Products
- 16.2.1.3. SWOT Analysis
- 16.2.1.4. Recent Developments
- 16.2.1.5. Financials (Based on Availability)
- 16.2.2 Heartland Food Products Group
- 16.2.2.1. Overview
- 16.2.2.2. Products
- 16.2.2.3. SWOT Analysis
- 16.2.2.4. Recent Developments
- 16.2.2.5. Financials (Based on Availability)
- 16.2.3 Kawarlal & Co Inc *List Not Exhaustive
- 16.2.3.1. Overview
- 16.2.3.2. Products
- 16.2.3.3. SWOT Analysis
- 16.2.3.4. Recent Developments
- 16.2.3.5. Financials (Based on Availability)
- 16.2.4 DuPont de Nemours Inc
- 16.2.4.1. Overview
- 16.2.4.2. Products
- 16.2.4.3. SWOT Analysis
- 16.2.4.4. Recent Developments
- 16.2.4.5. Financials (Based on Availability)
- 16.2.5 Ingredion Inc
- 16.2.5.1. Overview
- 16.2.5.2. Products
- 16.2.5.3. SWOT Analysis
- 16.2.5.4. Recent Developments
- 16.2.5.5. Financials (Based on Availability)
- 16.2.6 Archer Daniels Midland Company
- 16.2.6.1. Overview
- 16.2.6.2. Products
- 16.2.6.3. SWOT Analysis
- 16.2.6.4. Recent Developments
- 16.2.6.5. Financials (Based on Availability)
- 16.2.7 Ajinomoto Co Inc
- 16.2.7.1. Overview
- 16.2.7.2. Products
- 16.2.7.3. SWOT Analysis
- 16.2.7.4. Recent Developments
- 16.2.7.5. Financials (Based on Availability)
- 16.2.8 PureCircle Ltd
- 16.2.8.1. Overview
- 16.2.8.2. Products
- 16.2.8.3. SWOT Analysis
- 16.2.8.4. Recent Developments
- 16.2.8.5. Financials (Based on Availability)
- 16.2.9 Roquette Freres
- 16.2.9.1. Overview
- 16.2.9.2. Products
- 16.2.9.3. SWOT Analysis
- 16.2.9.4. Recent Developments
- 16.2.9.5. Financials (Based on Availability)
- 16.2.10 Stevia First Corporation
- 16.2.10.1. Overview
- 16.2.10.2. Products
- 16.2.10.3. SWOT Analysis
- 16.2.10.4. Recent Developments
- 16.2.10.5. Financials (Based on Availability)
- 16.2.1 Cargill Incorporated
List of Figures
- Figure 1: Global Alternative Sweeteners Market Revenue Breakdown (Million, %) by Region 2024 & 2032
- Figure 2: North America Alternative Sweeteners Market Revenue (Million), by Country 2024 & 2032
- Figure 3: North America Alternative Sweeteners Market Revenue Share (%), by Country 2024 & 2032
- Figure 4: Europe Alternative Sweeteners Market Revenue (Million), by Country 2024 & 2032
- Figure 5: Europe Alternative Sweeteners Market Revenue Share (%), by Country 2024 & 2032
- Figure 6: Asia Pacific Alternative Sweeteners Market Revenue (Million), by Country 2024 & 2032
- Figure 7: Asia Pacific Alternative Sweeteners Market Revenue Share (%), by Country 2024 & 2032
- Figure 8: South America Alternative Sweeteners Market Revenue (Million), by Country 2024 & 2032
- Figure 9: South America Alternative Sweeteners Market Revenue Share (%), by Country 2024 & 2032
- Figure 10: Middle East and Africa Alternative Sweeteners Market Revenue (Million), by Country 2024 & 2032
- Figure 11: Middle East and Africa Alternative Sweeteners Market Revenue Share (%), by Country 2024 & 2032
- Figure 12: North America Alternative Sweeteners Market Revenue (Million), by Product Type 2024 & 2032
- Figure 13: North America Alternative Sweeteners Market Revenue Share (%), by Product Type 2024 & 2032
- Figure 14: North America Alternative Sweeteners Market Revenue (Million), by Source 2024 & 2032
- Figure 15: North America Alternative Sweeteners Market Revenue Share (%), by Source 2024 & 2032
- Figure 16: North America Alternative Sweeteners Market Revenue (Million), by Application 2024 & 2032
- Figure 17: North America Alternative Sweeteners Market Revenue Share (%), by Application 2024 & 2032
- Figure 18: North America Alternative Sweeteners Market Revenue (Million), by Country 2024 & 2032
- Figure 19: North America Alternative Sweeteners Market Revenue Share (%), by Country 2024 & 2032
- Figure 20: Europe Alternative Sweeteners Market Revenue (Million), by Product Type 2024 & 2032
- Figure 21: Europe Alternative Sweeteners Market Revenue Share (%), by Product Type 2024 & 2032
- Figure 22: Europe Alternative Sweeteners Market Revenue (Million), by Source 2024 & 2032
- Figure 23: Europe Alternative Sweeteners Market Revenue Share (%), by Source 2024 & 2032
- Figure 24: Europe Alternative Sweeteners Market Revenue (Million), by Application 2024 & 2032
- Figure 25: Europe Alternative Sweeteners Market Revenue Share (%), by Application 2024 & 2032
- Figure 26: Europe Alternative Sweeteners Market Revenue (Million), by Country 2024 & 2032
- Figure 27: Europe Alternative Sweeteners Market Revenue Share (%), by Country 2024 & 2032
- Figure 28: Asia Pacific Alternative Sweeteners Market Revenue (Million), by Product Type 2024 & 2032
- Figure 29: Asia Pacific Alternative Sweeteners Market Revenue Share (%), by Product Type 2024 & 2032
- Figure 30: Asia Pacific Alternative Sweeteners Market Revenue (Million), by Source 2024 & 2032
- Figure 31: Asia Pacific Alternative Sweeteners Market Revenue Share (%), by Source 2024 & 2032
- Figure 32: Asia Pacific Alternative Sweeteners Market Revenue (Million), by Application 2024 & 2032
- Figure 33: Asia Pacific Alternative Sweeteners Market Revenue Share (%), by Application 2024 & 2032
- Figure 34: Asia Pacific Alternative Sweeteners Market Revenue (Million), by Country 2024 & 2032
- Figure 35: Asia Pacific Alternative Sweeteners Market Revenue Share (%), by Country 2024 & 2032
- Figure 36: South America Alternative Sweeteners Market Revenue (Million), by Product Type 2024 & 2032
- Figure 37: South America Alternative Sweeteners Market Revenue Share (%), by Product Type 2024 & 2032
- Figure 38: South America Alternative Sweeteners Market Revenue (Million), by Source 2024 & 2032
- Figure 39: South America Alternative Sweeteners Market Revenue Share (%), by Source 2024 & 2032
- Figure 40: South America Alternative Sweeteners Market Revenue (Million), by Application 2024 & 2032
- Figure 41: South America Alternative Sweeteners Market Revenue Share (%), by Application 2024 & 2032
- Figure 42: South America Alternative Sweeteners Market Revenue (Million), by Country 2024 & 2032
- Figure 43: South America Alternative Sweeteners Market Revenue Share (%), by Country 2024 & 2032
- Figure 44: Middle East and Africa Alternative Sweeteners Market Revenue (Million), by Product Type 2024 & 2032
- Figure 45: Middle East and Africa Alternative Sweeteners Market Revenue Share (%), by Product Type 2024 & 2032
- Figure 46: Middle East and Africa Alternative Sweeteners Market Revenue (Million), by Source 2024 & 2032
- Figure 47: Middle East and Africa Alternative Sweeteners Market Revenue Share (%), by Source 2024 & 2032
- Figure 48: Middle East and Africa Alternative Sweeteners Market Revenue (Million), by Application 2024 & 2032
- Figure 49: Middle East and Africa Alternative Sweeteners Market Revenue Share (%), by Application 2024 & 2032
- Figure 50: Middle East and Africa Alternative Sweeteners Market Revenue (Million), by Country 2024 & 2032
- Figure 51: Middle East and Africa Alternative Sweeteners Market Revenue Share (%), by Country 2024 & 2032
List of Tables
- Table 1: Global Alternative Sweeteners Market Revenue Million Forecast, by Region 2019 & 2032
- Table 2: Global Alternative Sweeteners Market Revenue Million Forecast, by Product Type 2019 & 2032
- Table 3: Global Alternative Sweeteners Market Revenue Million Forecast, by Source 2019 & 2032
- Table 4: Global Alternative Sweeteners Market Revenue Million Forecast, by Application 2019 & 2032
- Table 5: Global Alternative Sweeteners Market Revenue Million Forecast, by Region 2019 & 2032
- Table 6: Global Alternative Sweeteners Market Revenue Million Forecast, by Country 2019 & 2032
- Table 7: United States Alternative Sweeteners Market Revenue (Million) Forecast, by Application 2019 & 2032
- Table 8: Canada Alternative Sweeteners Market Revenue (Million) Forecast, by Application 2019 & 2032
- Table 9: Mexico Alternative Sweeteners Market Revenue (Million) Forecast, by Application 2019 & 2032
- Table 10: Rest of North America Alternative Sweeteners Market Revenue (Million) Forecast, by Application 2019 & 2032
- Table 11: Global Alternative Sweeteners Market Revenue Million Forecast, by Country 2019 & 2032
- Table 12: Spain Alternative Sweeteners Market Revenue (Million) Forecast, by Application 2019 & 2032
- Table 13: United Kingdom Alternative Sweeteners Market Revenue (Million) Forecast, by Application 2019 & 2032
- Table 14: Germany Alternative Sweeteners Market Revenue (Million) Forecast, by Application 2019 & 2032
- Table 15: France Alternative Sweeteners Market Revenue (Million) Forecast, by Application 2019 & 2032
- Table 16: Italy Alternative Sweeteners Market Revenue (Million) Forecast, by Application 2019 & 2032
- Table 17: Russia Alternative Sweeteners Market Revenue (Million) Forecast, by Application 2019 & 2032
- Table 18: Rest of Europe Alternative Sweeteners Market Revenue (Million) Forecast, by Application 2019 & 2032
- Table 19: Global Alternative Sweeteners Market Revenue Million Forecast, by Country 2019 & 2032
- Table 20: China Alternative Sweeteners Market Revenue (Million) Forecast, by Application 2019 & 2032
- Table 21: Japan Alternative Sweeteners Market Revenue (Million) Forecast, by Application 2019 & 2032
- Table 22: India Alternative Sweeteners Market Revenue (Million) Forecast, by Application 2019 & 2032
- Table 23: Australia Alternative Sweeteners Market Revenue (Million) Forecast, by Application 2019 & 2032
- Table 24: Rest of Asia Pacific Alternative Sweeteners Market Revenue (Million) Forecast, by Application 2019 & 2032
- Table 25: Global Alternative Sweeteners Market Revenue Million Forecast, by Country 2019 & 2032
- Table 26: Brazil Alternative Sweeteners Market Revenue (Million) Forecast, by Application 2019 & 2032
- Table 27: Argentina Alternative Sweeteners Market Revenue (Million) Forecast, by Application 2019 & 2032
- Table 28: Rest of South America Alternative Sweeteners Market Revenue (Million) Forecast, by Application 2019 & 2032
- Table 29: Global Alternative Sweeteners Market Revenue Million Forecast, by Country 2019 & 2032
- Table 30: South Africa Alternative Sweeteners Market Revenue (Million) Forecast, by Application 2019 & 2032
- Table 31: United Arab Emirates Alternative Sweeteners Market Revenue (Million) Forecast, by Application 2019 & 2032
- Table 32: Rest of Middle East and Africa Alternative Sweeteners Market Revenue (Million) Forecast, by Application 2019 & 2032
- Table 33: Global Alternative Sweeteners Market Revenue Million Forecast, by Product Type 2019 & 2032
- Table 34: Global Alternative Sweeteners Market Revenue Million Forecast, by Source 2019 & 2032
- Table 35: Global Alternative Sweeteners Market Revenue Million Forecast, by Application 2019 & 2032
- Table 36: Global Alternative Sweeteners Market Revenue Million Forecast, by Country 2019 & 2032
- Table 37: United States Alternative Sweeteners Market Revenue (Million) Forecast, by Application 2019 & 2032
- Table 38: Canada Alternative Sweeteners Market Revenue (Million) Forecast, by Application 2019 & 2032
- Table 39: Mexico Alternative Sweeteners Market Revenue (Million) Forecast, by Application 2019 & 2032
- Table 40: Rest of North America Alternative Sweeteners Market Revenue (Million) Forecast, by Application 2019 & 2032
- Table 41: Global Alternative Sweeteners Market Revenue Million Forecast, by Product Type 2019 & 2032
- Table 42: Global Alternative Sweeteners Market Revenue Million Forecast, by Source 2019 & 2032
- Table 43: Global Alternative Sweeteners Market Revenue Million Forecast, by Application 2019 & 2032
- Table 44: Global Alternative Sweeteners Market Revenue Million Forecast, by Country 2019 & 2032
- Table 45: Spain Alternative Sweeteners Market Revenue (Million) Forecast, by Application 2019 & 2032
- Table 46: United Kingdom Alternative Sweeteners Market Revenue (Million) Forecast, by Application 2019 & 2032
- Table 47: Germany Alternative Sweeteners Market Revenue (Million) Forecast, by Application 2019 & 2032
- Table 48: France Alternative Sweeteners Market Revenue (Million) Forecast, by Application 2019 & 2032
- Table 49: Italy Alternative Sweeteners Market Revenue (Million) Forecast, by Application 2019 & 2032
- Table 50: Russia Alternative Sweeteners Market Revenue (Million) Forecast, by Application 2019 & 2032
- Table 51: Rest of Europe Alternative Sweeteners Market Revenue (Million) Forecast, by Application 2019 & 2032
- Table 52: Global Alternative Sweeteners Market Revenue Million Forecast, by Product Type 2019 & 2032
- Table 53: Global Alternative Sweeteners Market Revenue Million Forecast, by Source 2019 & 2032
- Table 54: Global Alternative Sweeteners Market Revenue Million Forecast, by Application 2019 & 2032
- Table 55: Global Alternative Sweeteners Market Revenue Million Forecast, by Country 2019 & 2032
- Table 56: China Alternative Sweeteners Market Revenue (Million) Forecast, by Application 2019 & 2032
- Table 57: Japan Alternative Sweeteners Market Revenue (Million) Forecast, by Application 2019 & 2032
- Table 58: India Alternative Sweeteners Market Revenue (Million) Forecast, by Application 2019 & 2032
- Table 59: Australia Alternative Sweeteners Market Revenue (Million) Forecast, by Application 2019 & 2032
- Table 60: Rest of Asia Pacific Alternative Sweeteners Market Revenue (Million) Forecast, by Application 2019 & 2032
- Table 61: Global Alternative Sweeteners Market Revenue Million Forecast, by Product Type 2019 & 2032
- Table 62: Global Alternative Sweeteners Market Revenue Million Forecast, by Source 2019 & 2032
- Table 63: Global Alternative Sweeteners Market Revenue Million Forecast, by Application 2019 & 2032
- Table 64: Global Alternative Sweeteners Market Revenue Million Forecast, by Country 2019 & 2032
- Table 65: Brazil Alternative Sweeteners Market Revenue (Million) Forecast, by Application 2019 & 2032
- Table 66: Argentina Alternative Sweeteners Market Revenue (Million) Forecast, by Application 2019 & 2032
- Table 67: Rest of South America Alternative Sweeteners Market Revenue (Million) Forecast, by Application 2019 & 2032
- Table 68: Global Alternative Sweeteners Market Revenue Million Forecast, by Product Type 2019 & 2032
- Table 69: Global Alternative Sweeteners Market Revenue Million Forecast, by Source 2019 & 2032
- Table 70: Global Alternative Sweeteners Market Revenue Million Forecast, by Application 2019 & 2032
- Table 71: Global Alternative Sweeteners Market Revenue Million Forecast, by Country 2019 & 2032
- Table 72: South Africa Alternative Sweeteners Market Revenue (Million) Forecast, by Application 2019 & 2032
- Table 73: United Arab Emirates Alternative Sweeteners Market Revenue (Million) Forecast, by Application 2019 & 2032
- Table 74: Rest of Middle East and Africa Alternative Sweeteners Market Revenue (Million) Forecast, by Application 2019 & 2032
Frequently Asked Questions
1. What is the projected Compound Annual Growth Rate (CAGR) of the Alternative Sweeteners Market?
The projected CAGR is approximately 4.30%.
2. Which companies are prominent players in the Alternative Sweeteners Market?
Key companies in the market include Cargill Incorporated, Heartland Food Products Group, Kawarlal & Co Inc *List Not Exhaustive, DuPont de Nemours Inc, Ingredion Inc, Archer Daniels Midland Company, Ajinomoto Co Inc, PureCircle Ltd, Roquette Freres, Stevia First Corporation.
3. What are the main segments of the Alternative Sweeteners Market?
The market segments include Product Type, Source, Application.
4. Can you provide details about the market size?
The market size is estimated to be USD XX Million as of 2022.
5. What are some drivers contributing to market growth?
Increasing Demand for Low-Fat and Low-Calorie Food; Increasing Product Innovation.
6. What are the notable trends driving market growth?
Rising Number of Consumers Affected by Diabetes and Obesity.
7. Are there any restraints impacting market growth?
Higher Production Cost of Fat Replacers.
8. Can you provide examples of recent developments in the market?
N/A
9. What pricing options are available for accessing the report?
Pricing options include single-user, multi-user, and enterprise licenses priced at USD 4750, USD 5250, and USD 8750 respectively.
10. Is the market size provided in terms of value or volume?
The market size is provided in terms of value, measured in Million.
11. Are there any specific market keywords associated with the report?
Yes, the market keyword associated with the report is "Alternative Sweeteners Market," which aids in identifying and referencing the specific market segment covered.
12. How do I determine which pricing option suits my needs best?
The pricing options vary based on user requirements and access needs. Individual users may opt for single-user licenses, while businesses requiring broader access may choose multi-user or enterprise licenses for cost-effective access to the report.
13. Are there any additional resources or data provided in the Alternative Sweeteners Market report?
While the report offers comprehensive insights, it's advisable to review the specific contents or supplementary materials provided to ascertain if additional resources or data are available.
14. How can I stay updated on further developments or reports in the Alternative Sweeteners Market?
To stay informed about further developments, trends, and reports in the Alternative Sweeteners Market, consider subscribing to industry newsletters, following relevant companies and organizations, or regularly checking reputable industry news sources and publications.
Methodology
Step 1 - Identification of Relevant Samples Size from Population Database


Step 2 - Approaches for Defining Global Market Size (Value, Volume* & Price*)

Note*: In applicable scenarios
Step 3 - Data Sources
Primary Research
- Web Analytics
- Survey Reports
- Research Institute
- Latest Research Reports
- Opinion Leaders
Secondary Research
- Annual Reports
- White Paper
- Latest Press Release
- Industry Association
- Paid Database
- Investor Presentations

Step 4 - Data Triangulation
Involves using different sources of information in order to increase the validity of a study
These sources are likely to be stakeholders in a program - participants, other researchers, program staff, other community members, and so on.
Then we put all data in single framework & apply various statistical tools to find out the dynamic on the market.
During the analysis stage, feedback from the stakeholder groups would be compared to determine areas of agreement as well as areas of divergence
