

Key Insights
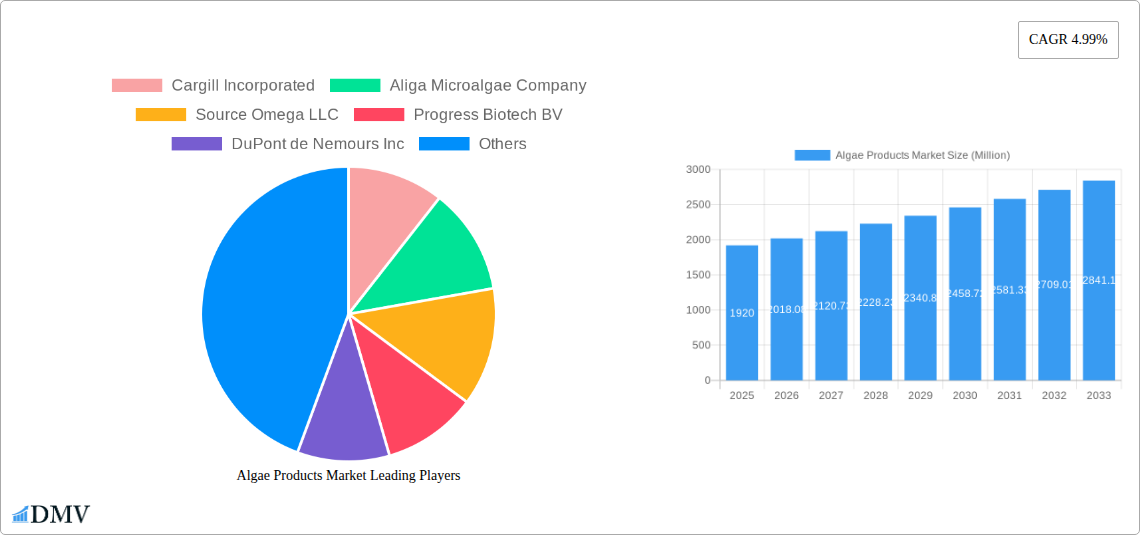
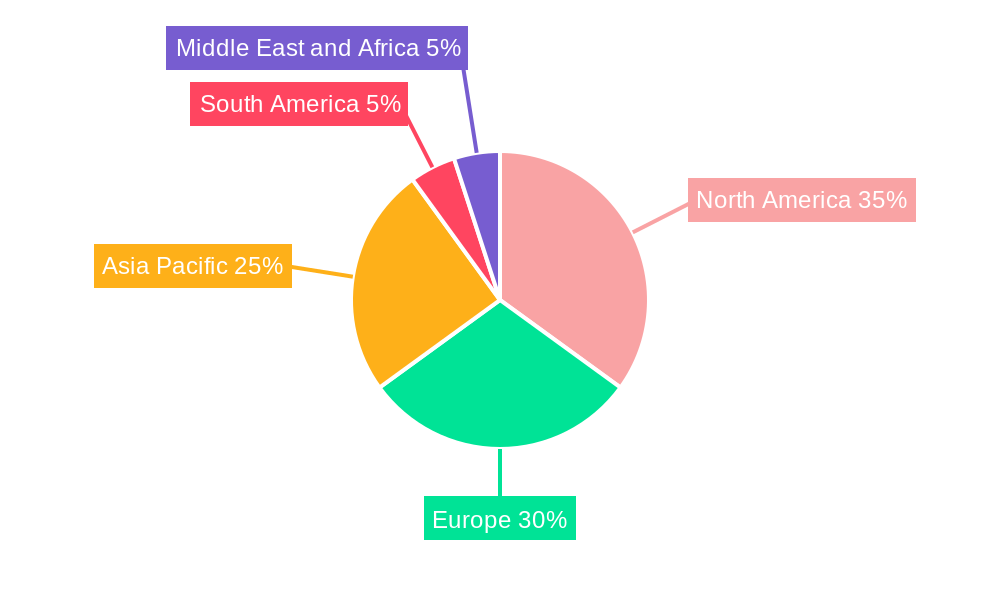
The global algae products market, valued at $1.92 billion in 2025, is projected to experience robust growth, exhibiting a compound annual growth rate (CAGR) of 4.99% from 2025 to 2033. This expansion is driven by the increasing demand for sustainable and eco-friendly ingredients across various sectors, particularly in food and beverage, personal care, and pharmaceuticals. The rising consumer awareness of the health benefits associated with algae-based products, such as their high protein content, rich nutrient profile (including essential fatty acids and vitamins), and potential prebiotic effects, further fuels market growth. Specific product types like algal protein and carrageenan are experiencing significant traction, owing to their versatile applications in food processing and as stabilizers, respectively. The market's geographic distribution reflects strong performance in North America and Europe, fueled by established industries and consumer preference for natural products. However, the Asia-Pacific region is anticipated to showcase significant growth potential in the coming years, driven by expanding populations and burgeoning food and beverage sectors. While challenges such as scalability and cost-effectiveness of algae cultivation remain, ongoing technological advancements and increasing investments in research and development are mitigating these constraints.
The competitive landscape is characterized by a mix of established multinational corporations and specialized algae producers. Companies like Cargill, DuPont, and DSM are leveraging their existing infrastructure and distribution networks to expand their algae product portfolios. Smaller, specialized companies are focusing on innovation in algae cultivation techniques and the development of niche products to cater to specific market needs. Future growth hinges on continued innovation in algae cultivation, product development, and effective marketing strategies that highlight the unique benefits of algae-based products to consumers and businesses alike. The market segmentation by algae type (brown, red, green, blue-green) reflects the diversity of applications and the specific properties of each type. Further market penetration will depend on successfully overcoming challenges in consistent quality control and maintaining a stable supply chain.
Algae Products Market: A Comprehensive Report (2019-2033)
This insightful report provides a deep dive into the Algae Products Market, offering a comprehensive analysis of its current state, future trajectory, and key players. With a study period spanning 2019-2033, a base year of 2025, and a forecast period of 2025-2033, this report is an invaluable resource for stakeholders seeking to understand and capitalize on this rapidly evolving market. The market is projected to reach xx Million by 2033.
Algae Products Market Composition & Trends
This section meticulously examines the competitive landscape of the Algae Products Market, encompassing market concentration, innovation drivers, regulatory frameworks, substitute products, end-user profiles, and mergers & acquisitions (M&A) activity. The report delves into the market share distribution among key players like Cargill Incorporated, DuPont de Nemours Inc, and BASF SE, analyzing their strategic maneuvers and market dominance. Furthermore, it assesses the impact of M&A activities, including deal values and their influence on market consolidation. The analysis considers various factors affecting market dynamics, including:
- Market Concentration: A detailed analysis of market share held by top players, revealing the level of competition and potential for consolidation.
- Innovation Catalysts: An exploration of technological advancements driving innovation in algae cultivation, extraction, and product development.
- Regulatory Landscape: An overview of existing and upcoming regulations impacting the algae products industry across different geographies.
- Substitute Products: An assessment of alternative products and their potential impact on market share and growth.
- End-User Profiles: A segmentation of end-users across diverse sectors (personal care, food & beverage, pharmaceuticals, etc.) and their specific needs and preferences.
- M&A Activities: A review of significant mergers and acquisitions, including deal values and their strategic implications for the market. Examples include the Aliga Microalgae acquisition in 2022. The total value of M&A deals in the Algae Products Market between 2019 and 2024 is estimated at xx Million.
Algae Products Market Industry Evolution
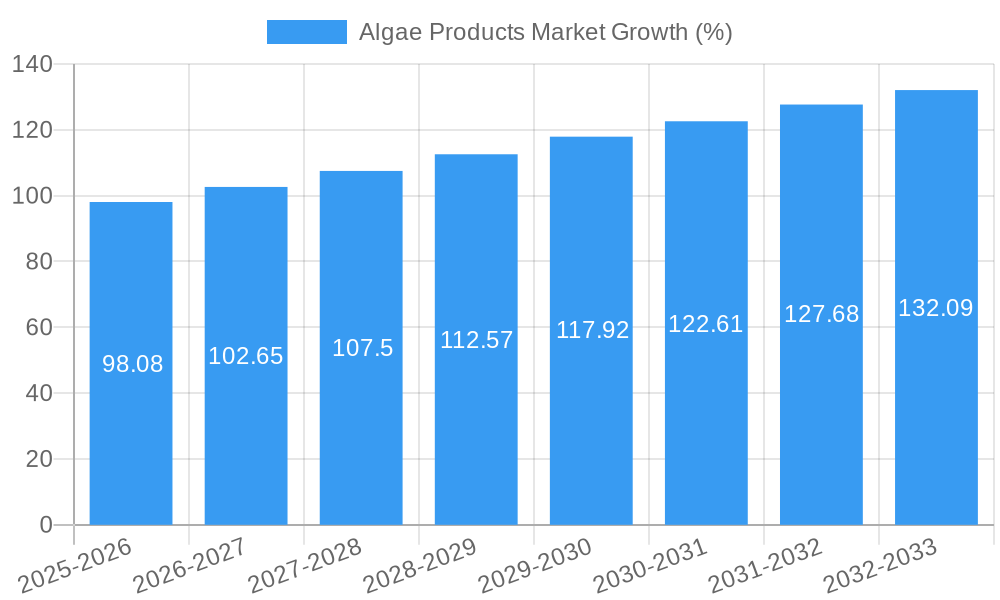
This section presents a detailed analysis of the Algae Products Market's growth trajectory, technological advancements, and evolving consumer preferences from 2019 to 2024 and provides a forecast until 2033. It explores the factors that have shaped the market's evolution, including technological breakthroughs in algae cultivation and processing, the rising demand for sustainable and healthy products, and shifting consumer preferences towards natural and plant-based alternatives. The report examines specific data points, such as compound annual growth rates (CAGRs) and adoption rates for different algae-derived products, providing a clear picture of the market’s historical performance and future potential. The section includes a comprehensive discussion of:
- Market Growth Trajectories: Detailed analysis of historical and projected market growth rates, segmented by product type and application.
- Technological Advancements: An exploration of key innovations, such as improved cultivation techniques, extraction methods, and processing technologies that have enhanced efficiency and reduced costs.
- Shifting Consumer Demands: An examination of changing consumer preferences driving the demand for algae-based products, encompassing health consciousness, sustainability concerns, and ethical sourcing considerations.
Leading Regions, Countries, or Segments in Algae Products Market
This section pinpoints the leading regions, countries, and market segments within the Algae Products Market. Dominant players and their strategies within these regions are analyzed in detail. We examine leading segments across all three categories (Source, Product Type, Application):
Source: The report identifies the dominant source of algae (e.g., brown algae, red algae, green algae, blue-green algae) and analyzes factors contributing to its prominence. This includes an evaluation of the relative abundance, ease of cultivation, and product yield for each source.
Product Type: The report identifies the most successful algal products (e.g., algal protein, alginate, carrageenan, carotenoids, lipids) and explains the factors that drive their success. This involves an assessment of market demand, pricing, and production costs for each product type.
Application: The report highlights the most lucrative application areas (e.g., food & beverage, personal care, pharmaceuticals, animal feed) and provides detailed insight into market drivers specific to each application. This includes an analysis of market size, growth potential, and consumer demand within each sector.
Key Drivers (Examples):
- Significant investments in research and development within specific geographic regions.
- Favorable government regulations and incentives supporting algae cultivation and product development.
- Strong consumer demand for sustainable and health-conscious products in specific markets.
Algae Products Market Product Innovations
This section showcases the latest innovations in algae-derived products, highlighting their unique selling propositions (USPs) and technological advancements. It includes details on novel product formulations, improved extraction methods, enhanced functionalities, and the incorporation of algae-based ingredients in various applications. The report discusses the performance metrics of these new products, demonstrating their effectiveness and competitiveness within the market.
Propelling Factors for Algae Products Market Growth
The Algae Products Market is experiencing robust growth driven by several key factors. Technological advancements in algae cultivation and processing have led to increased efficiency and lower production costs. The rising global demand for sustainable and environmentally friendly products is further propelling market expansion. Furthermore, supportive government policies and initiatives aimed at promoting the development of algae-based industries are creating favorable conditions for market growth. The increasing awareness of the health benefits associated with consuming algae-derived products is also contributing to market expansion.
Obstacles in the Algae Products Market
Despite its growth potential, the Algae Products Market faces several challenges. Scaling up algae cultivation to meet the growing demand remains a significant hurdle. The high initial investment required for establishing large-scale algae production facilities can deter potential market entrants. Furthermore, the fluctuating prices of raw materials and energy can impact the profitability of algae-based product manufacturers. Strict regulatory requirements and standardization issues can create additional barriers to entry and market expansion.
Future Opportunities in Algae Products Market
The Algae Products Market presents numerous exciting opportunities for future growth. Emerging applications of algae-derived products in diverse industries, such as biofuels and bioplastics, offer significant potential for market expansion. The development of novel algae strains with enhanced functionalities and improved yields can unlock new product possibilities. The growing demand for sustainable and plant-based alternatives in various sectors, such as food, cosmetics, and pharmaceuticals, will further stimulate market growth.
Major Players in the Algae Products Market Ecosystem
- Cargill Incorporated (Cargill Incorporated)
- Aliga Microalgae Company
- Source Omega LLC
- Progress Biotech BV
- DuPont de Nemours Inc (DuPont de Nemours Inc)
- Archer Daniels Midland Company (Archer Daniels Midland Company)
- BASF SE (BASF SE)
- Koninklijke DSM N V (Koninklijke DSM N V)
- Algenol Biotech LLC
- Yemoja Ltd
- ACCEL Carrageenan Corporation
Key Developments in Algae Products Market Industry
- September 2022: Aliga Microalgae acquired a large chlorella algae facility in the Netherlands, aiming to commercialize its products.
- April 2022: Koninklijke DSM N.V. expanded its 'life' range of algal omega-3 products with two line extensions.
- September 2021: AAK announced a strategic partnership with Progress Biotech to supply algae-based DHA for infant formula.
Strategic Algae Products Market Forecast
The Algae Products Market is poised for significant growth in the coming years, driven by increasing consumer demand for sustainable and healthy products, technological advancements, and supportive government policies. The market's potential is further amplified by the expanding applications of algae-derived products across various sectors. The continued innovation in algae cultivation techniques and product development will further fuel market expansion, creating lucrative opportunities for existing and new market players.
Algae Products Market Segmentation
-
1. Source
- 1.1. Brown Algae
- 1.2. Red Algae
- 1.3. Green Algae
- 1.4. Blue-green Algae
-
2. Product Type
- 2.1. Algal Protein
- 2.2. Alginate
- 2.3. Carrageenan
- 2.4. Carotenoids
- 2.5. Lipids
- 2.6. Other Product Types
-
3. Application
- 3.1. Personal Care
- 3.2. Food and Beverage
- 3.3. Dietary Supplements
- 3.4. Pharmaceuticals
- 3.5. Animal Feed
- 3.6. Other Applications
Algae Products Market Segmentation By Geography
-
1. North America
- 1.1. United States
- 1.2. Canada
- 1.3. Mexico
- 1.4. Rest of North America
-
2. Europe
- 2.1. Spain
- 2.2. United Kingdom
- 2.3. Germany
- 2.4. France
- 2.5. Italy
- 2.6. Russia
- 2.7. Rest of Europe
-
3. Asia Pacific
- 3.1. China
- 3.2. Japan
- 3.3. India
- 3.4. Australia
- 3.5. Rest of Asia Pacific
-
4. South America
- 4.1. Brazil
- 4.2. Argentina
- 4.3. Rest of South America
-
5. Middle East and Africa
- 5.1. South Africa
- 5.2. United Arab Emirates
- 5.3. Rest of Middle East and Africa
Algae Products Market REPORT HIGHLIGHTS
| Aspects | Details |
|---|---|
| Study Period | 2019-2033 |
| Base Year | 2024 |
| Estimated Year | 2025 |
| Forecast Period | 2025-2033 |
| Historical Period | 2019-2024 |
| Growth Rate | CAGR of 4.99% from 2019-2033 |
| Segmentation |
|
Table of Contents
- 1. Introduction
- 1.1. Research Scope
- 1.2. Market Segmentation
- 1.3. Research Methodology
- 1.4. Definitions and Assumptions
- 2. Executive Summary
- 2.1. Introduction
- 3. Market Dynamics
- 3.1. Introduction
- 3.2. Market Drivers
- 3.2.1. Increasing Demand for Processed Food Products; Technological Advancements Supporting Market Growth
- 3.3. Market Restrains
- 3.3.1. Increasing Cost of Production Due to Rise in Energy and Labor Cost
- 3.4. Market Trends
- 3.4.1. Health Benefits Associated With Algae Products' Consumption
- 4. Market Factor Analysis
- 4.1. Porters Five Forces
- 4.2. Supply/Value Chain
- 4.3. PESTEL analysis
- 4.4. Market Entropy
- 4.5. Patent/Trademark Analysis
- 5. Global Algae Products Market Analysis, Insights and Forecast, 2019-2031
- 5.1. Market Analysis, Insights and Forecast - by Source
- 5.1.1. Brown Algae
- 5.1.2. Red Algae
- 5.1.3. Green Algae
- 5.1.4. Blue-green Algae
- 5.2. Market Analysis, Insights and Forecast - by Product Type
- 5.2.1. Algal Protein
- 5.2.2. Alginate
- 5.2.3. Carrageenan
- 5.2.4. Carotenoids
- 5.2.5. Lipids
- 5.2.6. Other Product Types
- 5.3. Market Analysis, Insights and Forecast - by Application
- 5.3.1. Personal Care
- 5.3.2. Food and Beverage
- 5.3.3. Dietary Supplements
- 5.3.4. Pharmaceuticals
- 5.3.5. Animal Feed
- 5.3.6. Other Applications
- 5.4. Market Analysis, Insights and Forecast - by Region
- 5.4.1. North America
- 5.4.2. Europe
- 5.4.3. Asia Pacific
- 5.4.4. South America
- 5.4.5. Middle East and Africa
- 5.1. Market Analysis, Insights and Forecast - by Source
- 6. North America Algae Products Market Analysis, Insights and Forecast, 2019-2031
- 6.1. Market Analysis, Insights and Forecast - by Source
- 6.1.1. Brown Algae
- 6.1.2. Red Algae
- 6.1.3. Green Algae
- 6.1.4. Blue-green Algae
- 6.2. Market Analysis, Insights and Forecast - by Product Type
- 6.2.1. Algal Protein
- 6.2.2. Alginate
- 6.2.3. Carrageenan
- 6.2.4. Carotenoids
- 6.2.5. Lipids
- 6.2.6. Other Product Types
- 6.3. Market Analysis, Insights and Forecast - by Application
- 6.3.1. Personal Care
- 6.3.2. Food and Beverage
- 6.3.3. Dietary Supplements
- 6.3.4. Pharmaceuticals
- 6.3.5. Animal Feed
- 6.3.6. Other Applications
- 6.1. Market Analysis, Insights and Forecast - by Source
- 7. Europe Algae Products Market Analysis, Insights and Forecast, 2019-2031
- 7.1. Market Analysis, Insights and Forecast - by Source
- 7.1.1. Brown Algae
- 7.1.2. Red Algae
- 7.1.3. Green Algae
- 7.1.4. Blue-green Algae
- 7.2. Market Analysis, Insights and Forecast - by Product Type
- 7.2.1. Algal Protein
- 7.2.2. Alginate
- 7.2.3. Carrageenan
- 7.2.4. Carotenoids
- 7.2.5. Lipids
- 7.2.6. Other Product Types
- 7.3. Market Analysis, Insights and Forecast - by Application
- 7.3.1. Personal Care
- 7.3.2. Food and Beverage
- 7.3.3. Dietary Supplements
- 7.3.4. Pharmaceuticals
- 7.3.5. Animal Feed
- 7.3.6. Other Applications
- 7.1. Market Analysis, Insights and Forecast - by Source
- 8. Asia Pacific Algae Products Market Analysis, Insights and Forecast, 2019-2031
- 8.1. Market Analysis, Insights and Forecast - by Source
- 8.1.1. Brown Algae
- 8.1.2. Red Algae
- 8.1.3. Green Algae
- 8.1.4. Blue-green Algae
- 8.2. Market Analysis, Insights and Forecast - by Product Type
- 8.2.1. Algal Protein
- 8.2.2. Alginate
- 8.2.3. Carrageenan
- 8.2.4. Carotenoids
- 8.2.5. Lipids
- 8.2.6. Other Product Types
- 8.3. Market Analysis, Insights and Forecast - by Application
- 8.3.1. Personal Care
- 8.3.2. Food and Beverage
- 8.3.3. Dietary Supplements
- 8.3.4. Pharmaceuticals
- 8.3.5. Animal Feed
- 8.3.6. Other Applications
- 8.1. Market Analysis, Insights and Forecast - by Source
- 9. South America Algae Products Market Analysis, Insights and Forecast, 2019-2031
- 9.1. Market Analysis, Insights and Forecast - by Source
- 9.1.1. Brown Algae
- 9.1.2. Red Algae
- 9.1.3. Green Algae
- 9.1.4. Blue-green Algae
- 9.2. Market Analysis, Insights and Forecast - by Product Type
- 9.2.1. Algal Protein
- 9.2.2. Alginate
- 9.2.3. Carrageenan
- 9.2.4. Carotenoids
- 9.2.5. Lipids
- 9.2.6. Other Product Types
- 9.3. Market Analysis, Insights and Forecast - by Application
- 9.3.1. Personal Care
- 9.3.2. Food and Beverage
- 9.3.3. Dietary Supplements
- 9.3.4. Pharmaceuticals
- 9.3.5. Animal Feed
- 9.3.6. Other Applications
- 9.1. Market Analysis, Insights and Forecast - by Source
- 10. Middle East and Africa Algae Products Market Analysis, Insights and Forecast, 2019-2031
- 10.1. Market Analysis, Insights and Forecast - by Source
- 10.1.1. Brown Algae
- 10.1.2. Red Algae
- 10.1.3. Green Algae
- 10.1.4. Blue-green Algae
- 10.2. Market Analysis, Insights and Forecast - by Product Type
- 10.2.1. Algal Protein
- 10.2.2. Alginate
- 10.2.3. Carrageenan
- 10.2.4. Carotenoids
- 10.2.5. Lipids
- 10.2.6. Other Product Types
- 10.3. Market Analysis, Insights and Forecast - by Application
- 10.3.1. Personal Care
- 10.3.2. Food and Beverage
- 10.3.3. Dietary Supplements
- 10.3.4. Pharmaceuticals
- 10.3.5. Animal Feed
- 10.3.6. Other Applications
- 10.1. Market Analysis, Insights and Forecast - by Source
- 11. North America Algae Products Market Analysis, Insights and Forecast, 2019-2031
- 11.1. Market Analysis, Insights and Forecast - By Country/Sub-region
- 11.1.1 United States
- 11.1.2 Canada
- 11.1.3 Mexico
- 11.1.4 Rest of North America
- 12. Europe Algae Products Market Analysis, Insights and Forecast, 2019-2031
- 12.1. Market Analysis, Insights and Forecast - By Country/Sub-region
- 12.1.1 Spain
- 12.1.2 United Kingdom
- 12.1.3 Germany
- 12.1.4 France
- 12.1.5 Italy
- 12.1.6 Russia
- 12.1.7 Rest of Europe
- 13. Asia Pacific Algae Products Market Analysis, Insights and Forecast, 2019-2031
- 13.1. Market Analysis, Insights and Forecast - By Country/Sub-region
- 13.1.1 China
- 13.1.2 Japan
- 13.1.3 India
- 13.1.4 Australia
- 13.1.5 Rest of Asia Pacific
- 14. South America Algae Products Market Analysis, Insights and Forecast, 2019-2031
- 14.1. Market Analysis, Insights and Forecast - By Country/Sub-region
- 14.1.1 Brazil
- 14.1.2 Argentina
- 14.1.3 Rest of South America
- 15. Middle East and Africa Algae Products Market Analysis, Insights and Forecast, 2019-2031
- 15.1. Market Analysis, Insights and Forecast - By Country/Sub-region
- 15.1.1 South Africa
- 15.1.2 United Arab Emirates
- 15.1.3 Rest of Middle East and Africa
- 16. Competitive Analysis
- 16.1. Global Market Share Analysis 2024
- 16.2. Company Profiles
- 16.2.1 Cargill Incorporated
- 16.2.1.1. Overview
- 16.2.1.2. Products
- 16.2.1.3. SWOT Analysis
- 16.2.1.4. Recent Developments
- 16.2.1.5. Financials (Based on Availability)
- 16.2.2 Aliga Microalgae Company
- 16.2.2.1. Overview
- 16.2.2.2. Products
- 16.2.2.3. SWOT Analysis
- 16.2.2.4. Recent Developments
- 16.2.2.5. Financials (Based on Availability)
- 16.2.3 Source Omega LLC
- 16.2.3.1. Overview
- 16.2.3.2. Products
- 16.2.3.3. SWOT Analysis
- 16.2.3.4. Recent Developments
- 16.2.3.5. Financials (Based on Availability)
- 16.2.4 Progress Biotech BV
- 16.2.4.1. Overview
- 16.2.4.2. Products
- 16.2.4.3. SWOT Analysis
- 16.2.4.4. Recent Developments
- 16.2.4.5. Financials (Based on Availability)
- 16.2.5 DuPont de Nemours Inc
- 16.2.5.1. Overview
- 16.2.5.2. Products
- 16.2.5.3. SWOT Analysis
- 16.2.5.4. Recent Developments
- 16.2.5.5. Financials (Based on Availability)
- 16.2.6 Archer Daniels Midland Company
- 16.2.6.1. Overview
- 16.2.6.2. Products
- 16.2.6.3. SWOT Analysis
- 16.2.6.4. Recent Developments
- 16.2.6.5. Financials (Based on Availability)
- 16.2.7 BASF SE
- 16.2.7.1. Overview
- 16.2.7.2. Products
- 16.2.7.3. SWOT Analysis
- 16.2.7.4. Recent Developments
- 16.2.7.5. Financials (Based on Availability)
- 16.2.8 Koninklijke DSM N V
- 16.2.8.1. Overview
- 16.2.8.2. Products
- 16.2.8.3. SWOT Analysis
- 16.2.8.4. Recent Developments
- 16.2.8.5. Financials (Based on Availability)
- 16.2.9 Algenol Biotech LLC*List Not Exhaustive
- 16.2.9.1. Overview
- 16.2.9.2. Products
- 16.2.9.3. SWOT Analysis
- 16.2.9.4. Recent Developments
- 16.2.9.5. Financials (Based on Availability)
- 16.2.10 Yemoja Ltd
- 16.2.10.1. Overview
- 16.2.10.2. Products
- 16.2.10.3. SWOT Analysis
- 16.2.10.4. Recent Developments
- 16.2.10.5. Financials (Based on Availability)
- 16.2.11 ACCEL Carrageenan Corporation
- 16.2.11.1. Overview
- 16.2.11.2. Products
- 16.2.11.3. SWOT Analysis
- 16.2.11.4. Recent Developments
- 16.2.11.5. Financials (Based on Availability)
- 16.2.1 Cargill Incorporated
List of Figures
- Figure 1: Global Algae Products Market Revenue Breakdown (Million, %) by Region 2024 & 2032
- Figure 2: Global Algae Products Market Volume Breakdown (k Tons, %) by Region 2024 & 2032
- Figure 3: North America Algae Products Market Revenue (Million), by Country 2024 & 2032
- Figure 4: North America Algae Products Market Volume (k Tons), by Country 2024 & 2032
- Figure 5: North America Algae Products Market Revenue Share (%), by Country 2024 & 2032
- Figure 6: North America Algae Products Market Volume Share (%), by Country 2024 & 2032
- Figure 7: Europe Algae Products Market Revenue (Million), by Country 2024 & 2032
- Figure 8: Europe Algae Products Market Volume (k Tons), by Country 2024 & 2032
- Figure 9: Europe Algae Products Market Revenue Share (%), by Country 2024 & 2032
- Figure 10: Europe Algae Products Market Volume Share (%), by Country 2024 & 2032
- Figure 11: Asia Pacific Algae Products Market Revenue (Million), by Country 2024 & 2032
- Figure 12: Asia Pacific Algae Products Market Volume (k Tons), by Country 2024 & 2032
- Figure 13: Asia Pacific Algae Products Market Revenue Share (%), by Country 2024 & 2032
- Figure 14: Asia Pacific Algae Products Market Volume Share (%), by Country 2024 & 2032
- Figure 15: South America Algae Products Market Revenue (Million), by Country 2024 & 2032
- Figure 16: South America Algae Products Market Volume (k Tons), by Country 2024 & 2032
- Figure 17: South America Algae Products Market Revenue Share (%), by Country 2024 & 2032
- Figure 18: South America Algae Products Market Volume Share (%), by Country 2024 & 2032
- Figure 19: Middle East and Africa Algae Products Market Revenue (Million), by Country 2024 & 2032
- Figure 20: Middle East and Africa Algae Products Market Volume (k Tons), by Country 2024 & 2032
- Figure 21: Middle East and Africa Algae Products Market Revenue Share (%), by Country 2024 & 2032
- Figure 22: Middle East and Africa Algae Products Market Volume Share (%), by Country 2024 & 2032
- Figure 23: North America Algae Products Market Revenue (Million), by Source 2024 & 2032
- Figure 24: North America Algae Products Market Volume (k Tons), by Source 2024 & 2032
- Figure 25: North America Algae Products Market Revenue Share (%), by Source 2024 & 2032
- Figure 26: North America Algae Products Market Volume Share (%), by Source 2024 & 2032
- Figure 27: North America Algae Products Market Revenue (Million), by Product Type 2024 & 2032
- Figure 28: North America Algae Products Market Volume (k Tons), by Product Type 2024 & 2032
- Figure 29: North America Algae Products Market Revenue Share (%), by Product Type 2024 & 2032
- Figure 30: North America Algae Products Market Volume Share (%), by Product Type 2024 & 2032
- Figure 31: North America Algae Products Market Revenue (Million), by Application 2024 & 2032
- Figure 32: North America Algae Products Market Volume (k Tons), by Application 2024 & 2032
- Figure 33: North America Algae Products Market Revenue Share (%), by Application 2024 & 2032
- Figure 34: North America Algae Products Market Volume Share (%), by Application 2024 & 2032
- Figure 35: North America Algae Products Market Revenue (Million), by Country 2024 & 2032
- Figure 36: North America Algae Products Market Volume (k Tons), by Country 2024 & 2032
- Figure 37: North America Algae Products Market Revenue Share (%), by Country 2024 & 2032
- Figure 38: North America Algae Products Market Volume Share (%), by Country 2024 & 2032
- Figure 39: Europe Algae Products Market Revenue (Million), by Source 2024 & 2032
- Figure 40: Europe Algae Products Market Volume (k Tons), by Source 2024 & 2032
- Figure 41: Europe Algae Products Market Revenue Share (%), by Source 2024 & 2032
- Figure 42: Europe Algae Products Market Volume Share (%), by Source 2024 & 2032
- Figure 43: Europe Algae Products Market Revenue (Million), by Product Type 2024 & 2032
- Figure 44: Europe Algae Products Market Volume (k Tons), by Product Type 2024 & 2032
- Figure 45: Europe Algae Products Market Revenue Share (%), by Product Type 2024 & 2032
- Figure 46: Europe Algae Products Market Volume Share (%), by Product Type 2024 & 2032
- Figure 47: Europe Algae Products Market Revenue (Million), by Application 2024 & 2032
- Figure 48: Europe Algae Products Market Volume (k Tons), by Application 2024 & 2032
- Figure 49: Europe Algae Products Market Revenue Share (%), by Application 2024 & 2032
- Figure 50: Europe Algae Products Market Volume Share (%), by Application 2024 & 2032
- Figure 51: Europe Algae Products Market Revenue (Million), by Country 2024 & 2032
- Figure 52: Europe Algae Products Market Volume (k Tons), by Country 2024 & 2032
- Figure 53: Europe Algae Products Market Revenue Share (%), by Country 2024 & 2032
- Figure 54: Europe Algae Products Market Volume Share (%), by Country 2024 & 2032
- Figure 55: Asia Pacific Algae Products Market Revenue (Million), by Source 2024 & 2032
- Figure 56: Asia Pacific Algae Products Market Volume (k Tons), by Source 2024 & 2032
- Figure 57: Asia Pacific Algae Products Market Revenue Share (%), by Source 2024 & 2032
- Figure 58: Asia Pacific Algae Products Market Volume Share (%), by Source 2024 & 2032
- Figure 59: Asia Pacific Algae Products Market Revenue (Million), by Product Type 2024 & 2032
- Figure 60: Asia Pacific Algae Products Market Volume (k Tons), by Product Type 2024 & 2032
- Figure 61: Asia Pacific Algae Products Market Revenue Share (%), by Product Type 2024 & 2032
- Figure 62: Asia Pacific Algae Products Market Volume Share (%), by Product Type 2024 & 2032
- Figure 63: Asia Pacific Algae Products Market Revenue (Million), by Application 2024 & 2032
- Figure 64: Asia Pacific Algae Products Market Volume (k Tons), by Application 2024 & 2032
- Figure 65: Asia Pacific Algae Products Market Revenue Share (%), by Application 2024 & 2032
- Figure 66: Asia Pacific Algae Products Market Volume Share (%), by Application 2024 & 2032
- Figure 67: Asia Pacific Algae Products Market Revenue (Million), by Country 2024 & 2032
- Figure 68: Asia Pacific Algae Products Market Volume (k Tons), by Country 2024 & 2032
- Figure 69: Asia Pacific Algae Products Market Revenue Share (%), by Country 2024 & 2032
- Figure 70: Asia Pacific Algae Products Market Volume Share (%), by Country 2024 & 2032
- Figure 71: South America Algae Products Market Revenue (Million), by Source 2024 & 2032
- Figure 72: South America Algae Products Market Volume (k Tons), by Source 2024 & 2032
- Figure 73: South America Algae Products Market Revenue Share (%), by Source 2024 & 2032
- Figure 74: South America Algae Products Market Volume Share (%), by Source 2024 & 2032
- Figure 75: South America Algae Products Market Revenue (Million), by Product Type 2024 & 2032
- Figure 76: South America Algae Products Market Volume (k Tons), by Product Type 2024 & 2032
- Figure 77: South America Algae Products Market Revenue Share (%), by Product Type 2024 & 2032
- Figure 78: South America Algae Products Market Volume Share (%), by Product Type 2024 & 2032
- Figure 79: South America Algae Products Market Revenue (Million), by Application 2024 & 2032
- Figure 80: South America Algae Products Market Volume (k Tons), by Application 2024 & 2032
- Figure 81: South America Algae Products Market Revenue Share (%), by Application 2024 & 2032
- Figure 82: South America Algae Products Market Volume Share (%), by Application 2024 & 2032
- Figure 83: South America Algae Products Market Revenue (Million), by Country 2024 & 2032
- Figure 84: South America Algae Products Market Volume (k Tons), by Country 2024 & 2032
- Figure 85: South America Algae Products Market Revenue Share (%), by Country 2024 & 2032
- Figure 86: South America Algae Products Market Volume Share (%), by Country 2024 & 2032
- Figure 87: Middle East and Africa Algae Products Market Revenue (Million), by Source 2024 & 2032
- Figure 88: Middle East and Africa Algae Products Market Volume (k Tons), by Source 2024 & 2032
- Figure 89: Middle East and Africa Algae Products Market Revenue Share (%), by Source 2024 & 2032
- Figure 90: Middle East and Africa Algae Products Market Volume Share (%), by Source 2024 & 2032
- Figure 91: Middle East and Africa Algae Products Market Revenue (Million), by Product Type 2024 & 2032
- Figure 92: Middle East and Africa Algae Products Market Volume (k Tons), by Product Type 2024 & 2032
- Figure 93: Middle East and Africa Algae Products Market Revenue Share (%), by Product Type 2024 & 2032
- Figure 94: Middle East and Africa Algae Products Market Volume Share (%), by Product Type 2024 & 2032
- Figure 95: Middle East and Africa Algae Products Market Revenue (Million), by Application 2024 & 2032
- Figure 96: Middle East and Africa Algae Products Market Volume (k Tons), by Application 2024 & 2032
- Figure 97: Middle East and Africa Algae Products Market Revenue Share (%), by Application 2024 & 2032
- Figure 98: Middle East and Africa Algae Products Market Volume Share (%), by Application 2024 & 2032
- Figure 99: Middle East and Africa Algae Products Market Revenue (Million), by Country 2024 & 2032
- Figure 100: Middle East and Africa Algae Products Market Volume (k Tons), by Country 2024 & 2032
- Figure 101: Middle East and Africa Algae Products Market Revenue Share (%), by Country 2024 & 2032
- Figure 102: Middle East and Africa Algae Products Market Volume Share (%), by Country 2024 & 2032
List of Tables
- Table 1: Global Algae Products Market Revenue Million Forecast, by Region 2019 & 2032
- Table 2: Global Algae Products Market Volume k Tons Forecast, by Region 2019 & 2032
- Table 3: Global Algae Products Market Revenue Million Forecast, by Source 2019 & 2032
- Table 4: Global Algae Products Market Volume k Tons Forecast, by Source 2019 & 2032
- Table 5: Global Algae Products Market Revenue Million Forecast, by Product Type 2019 & 2032
- Table 6: Global Algae Products Market Volume k Tons Forecast, by Product Type 2019 & 2032
- Table 7: Global Algae Products Market Revenue Million Forecast, by Application 2019 & 2032
- Table 8: Global Algae Products Market Volume k Tons Forecast, by Application 2019 & 2032
- Table 9: Global Algae Products Market Revenue Million Forecast, by Region 2019 & 2032
- Table 10: Global Algae Products Market Volume k Tons Forecast, by Region 2019 & 2032
- Table 11: Global Algae Products Market Revenue Million Forecast, by Country 2019 & 2032
- Table 12: Global Algae Products Market Volume k Tons Forecast, by Country 2019 & 2032
- Table 13: United States Algae Products Market Revenue (Million) Forecast, by Application 2019 & 2032
- Table 14: United States Algae Products Market Volume (k Tons) Forecast, by Application 2019 & 2032
- Table 15: Canada Algae Products Market Revenue (Million) Forecast, by Application 2019 & 2032
- Table 16: Canada Algae Products Market Volume (k Tons) Forecast, by Application 2019 & 2032
- Table 17: Mexico Algae Products Market Revenue (Million) Forecast, by Application 2019 & 2032
- Table 18: Mexico Algae Products Market Volume (k Tons) Forecast, by Application 2019 & 2032
- Table 19: Rest of North America Algae Products Market Revenue (Million) Forecast, by Application 2019 & 2032
- Table 20: Rest of North America Algae Products Market Volume (k Tons) Forecast, by Application 2019 & 2032
- Table 21: Global Algae Products Market Revenue Million Forecast, by Country 2019 & 2032
- Table 22: Global Algae Products Market Volume k Tons Forecast, by Country 2019 & 2032
- Table 23: Spain Algae Products Market Revenue (Million) Forecast, by Application 2019 & 2032
- Table 24: Spain Algae Products Market Volume (k Tons) Forecast, by Application 2019 & 2032
- Table 25: United Kingdom Algae Products Market Revenue (Million) Forecast, by Application 2019 & 2032
- Table 26: United Kingdom Algae Products Market Volume (k Tons) Forecast, by Application 2019 & 2032
- Table 27: Germany Algae Products Market Revenue (Million) Forecast, by Application 2019 & 2032
- Table 28: Germany Algae Products Market Volume (k Tons) Forecast, by Application 2019 & 2032
- Table 29: France Algae Products Market Revenue (Million) Forecast, by Application 2019 & 2032
- Table 30: France Algae Products Market Volume (k Tons) Forecast, by Application 2019 & 2032
- Table 31: Italy Algae Products Market Revenue (Million) Forecast, by Application 2019 & 2032
- Table 32: Italy Algae Products Market Volume (k Tons) Forecast, by Application 2019 & 2032
- Table 33: Russia Algae Products Market Revenue (Million) Forecast, by Application 2019 & 2032
- Table 34: Russia Algae Products Market Volume (k Tons) Forecast, by Application 2019 & 2032
- Table 35: Rest of Europe Algae Products Market Revenue (Million) Forecast, by Application 2019 & 2032
- Table 36: Rest of Europe Algae Products Market Volume (k Tons) Forecast, by Application 2019 & 2032
- Table 37: Global Algae Products Market Revenue Million Forecast, by Country 2019 & 2032
- Table 38: Global Algae Products Market Volume k Tons Forecast, by Country 2019 & 2032
- Table 39: China Algae Products Market Revenue (Million) Forecast, by Application 2019 & 2032
- Table 40: China Algae Products Market Volume (k Tons) Forecast, by Application 2019 & 2032
- Table 41: Japan Algae Products Market Revenue (Million) Forecast, by Application 2019 & 2032
- Table 42: Japan Algae Products Market Volume (k Tons) Forecast, by Application 2019 & 2032
- Table 43: India Algae Products Market Revenue (Million) Forecast, by Application 2019 & 2032
- Table 44: India Algae Products Market Volume (k Tons) Forecast, by Application 2019 & 2032
- Table 45: Australia Algae Products Market Revenue (Million) Forecast, by Application 2019 & 2032
- Table 46: Australia Algae Products Market Volume (k Tons) Forecast, by Application 2019 & 2032
- Table 47: Rest of Asia Pacific Algae Products Market Revenue (Million) Forecast, by Application 2019 & 2032
- Table 48: Rest of Asia Pacific Algae Products Market Volume (k Tons) Forecast, by Application 2019 & 2032
- Table 49: Global Algae Products Market Revenue Million Forecast, by Country 2019 & 2032
- Table 50: Global Algae Products Market Volume k Tons Forecast, by Country 2019 & 2032
- Table 51: Brazil Algae Products Market Revenue (Million) Forecast, by Application 2019 & 2032
- Table 52: Brazil Algae Products Market Volume (k Tons) Forecast, by Application 2019 & 2032
- Table 53: Argentina Algae Products Market Revenue (Million) Forecast, by Application 2019 & 2032
- Table 54: Argentina Algae Products Market Volume (k Tons) Forecast, by Application 2019 & 2032
- Table 55: Rest of South America Algae Products Market Revenue (Million) Forecast, by Application 2019 & 2032
- Table 56: Rest of South America Algae Products Market Volume (k Tons) Forecast, by Application 2019 & 2032
- Table 57: Global Algae Products Market Revenue Million Forecast, by Country 2019 & 2032
- Table 58: Global Algae Products Market Volume k Tons Forecast, by Country 2019 & 2032
- Table 59: South Africa Algae Products Market Revenue (Million) Forecast, by Application 2019 & 2032
- Table 60: South Africa Algae Products Market Volume (k Tons) Forecast, by Application 2019 & 2032
- Table 61: United Arab Emirates Algae Products Market Revenue (Million) Forecast, by Application 2019 & 2032
- Table 62: United Arab Emirates Algae Products Market Volume (k Tons) Forecast, by Application 2019 & 2032
- Table 63: Rest of Middle East and Africa Algae Products Market Revenue (Million) Forecast, by Application 2019 & 2032
- Table 64: Rest of Middle East and Africa Algae Products Market Volume (k Tons) Forecast, by Application 2019 & 2032
- Table 65: Global Algae Products Market Revenue Million Forecast, by Source 2019 & 2032
- Table 66: Global Algae Products Market Volume k Tons Forecast, by Source 2019 & 2032
- Table 67: Global Algae Products Market Revenue Million Forecast, by Product Type 2019 & 2032
- Table 68: Global Algae Products Market Volume k Tons Forecast, by Product Type 2019 & 2032
- Table 69: Global Algae Products Market Revenue Million Forecast, by Application 2019 & 2032
- Table 70: Global Algae Products Market Volume k Tons Forecast, by Application 2019 & 2032
- Table 71: Global Algae Products Market Revenue Million Forecast, by Country 2019 & 2032
- Table 72: Global Algae Products Market Volume k Tons Forecast, by Country 2019 & 2032
- Table 73: United States Algae Products Market Revenue (Million) Forecast, by Application 2019 & 2032
- Table 74: United States Algae Products Market Volume (k Tons) Forecast, by Application 2019 & 2032
- Table 75: Canada Algae Products Market Revenue (Million) Forecast, by Application 2019 & 2032
- Table 76: Canada Algae Products Market Volume (k Tons) Forecast, by Application 2019 & 2032
- Table 77: Mexico Algae Products Market Revenue (Million) Forecast, by Application 2019 & 2032
- Table 78: Mexico Algae Products Market Volume (k Tons) Forecast, by Application 2019 & 2032
- Table 79: Rest of North America Algae Products Market Revenue (Million) Forecast, by Application 2019 & 2032
- Table 80: Rest of North America Algae Products Market Volume (k Tons) Forecast, by Application 2019 & 2032
- Table 81: Global Algae Products Market Revenue Million Forecast, by Source 2019 & 2032
- Table 82: Global Algae Products Market Volume k Tons Forecast, by Source 2019 & 2032
- Table 83: Global Algae Products Market Revenue Million Forecast, by Product Type 2019 & 2032
- Table 84: Global Algae Products Market Volume k Tons Forecast, by Product Type 2019 & 2032
- Table 85: Global Algae Products Market Revenue Million Forecast, by Application 2019 & 2032
- Table 86: Global Algae Products Market Volume k Tons Forecast, by Application 2019 & 2032
- Table 87: Global Algae Products Market Revenue Million Forecast, by Country 2019 & 2032
- Table 88: Global Algae Products Market Volume k Tons Forecast, by Country 2019 & 2032
- Table 89: Spain Algae Products Market Revenue (Million) Forecast, by Application 2019 & 2032
- Table 90: Spain Algae Products Market Volume (k Tons) Forecast, by Application 2019 & 2032
- Table 91: United Kingdom Algae Products Market Revenue (Million) Forecast, by Application 2019 & 2032
- Table 92: United Kingdom Algae Products Market Volume (k Tons) Forecast, by Application 2019 & 2032
- Table 93: Germany Algae Products Market Revenue (Million) Forecast, by Application 2019 & 2032
- Table 94: Germany Algae Products Market Volume (k Tons) Forecast, by Application 2019 & 2032
- Table 95: France Algae Products Market Revenue (Million) Forecast, by Application 2019 & 2032
- Table 96: France Algae Products Market Volume (k Tons) Forecast, by Application 2019 & 2032
- Table 97: Italy Algae Products Market Revenue (Million) Forecast, by Application 2019 & 2032
- Table 98: Italy Algae Products Market Volume (k Tons) Forecast, by Application 2019 & 2032
- Table 99: Russia Algae Products Market Revenue (Million) Forecast, by Application 2019 & 2032
- Table 100: Russia Algae Products Market Volume (k Tons) Forecast, by Application 2019 & 2032
- Table 101: Rest of Europe Algae Products Market Revenue (Million) Forecast, by Application 2019 & 2032
- Table 102: Rest of Europe Algae Products Market Volume (k Tons) Forecast, by Application 2019 & 2032
- Table 103: Global Algae Products Market Revenue Million Forecast, by Source 2019 & 2032
- Table 104: Global Algae Products Market Volume k Tons Forecast, by Source 2019 & 2032
- Table 105: Global Algae Products Market Revenue Million Forecast, by Product Type 2019 & 2032
- Table 106: Global Algae Products Market Volume k Tons Forecast, by Product Type 2019 & 2032
- Table 107: Global Algae Products Market Revenue Million Forecast, by Application 2019 & 2032
- Table 108: Global Algae Products Market Volume k Tons Forecast, by Application 2019 & 2032
- Table 109: Global Algae Products Market Revenue Million Forecast, by Country 2019 & 2032
- Table 110: Global Algae Products Market Volume k Tons Forecast, by Country 2019 & 2032
- Table 111: China Algae Products Market Revenue (Million) Forecast, by Application 2019 & 2032
- Table 112: China Algae Products Market Volume (k Tons) Forecast, by Application 2019 & 2032
- Table 113: Japan Algae Products Market Revenue (Million) Forecast, by Application 2019 & 2032
- Table 114: Japan Algae Products Market Volume (k Tons) Forecast, by Application 2019 & 2032
- Table 115: India Algae Products Market Revenue (Million) Forecast, by Application 2019 & 2032
- Table 116: India Algae Products Market Volume (k Tons) Forecast, by Application 2019 & 2032
- Table 117: Australia Algae Products Market Revenue (Million) Forecast, by Application 2019 & 2032
- Table 118: Australia Algae Products Market Volume (k Tons) Forecast, by Application 2019 & 2032
- Table 119: Rest of Asia Pacific Algae Products Market Revenue (Million) Forecast, by Application 2019 & 2032
- Table 120: Rest of Asia Pacific Algae Products Market Volume (k Tons) Forecast, by Application 2019 & 2032
- Table 121: Global Algae Products Market Revenue Million Forecast, by Source 2019 & 2032
- Table 122: Global Algae Products Market Volume k Tons Forecast, by Source 2019 & 2032
- Table 123: Global Algae Products Market Revenue Million Forecast, by Product Type 2019 & 2032
- Table 124: Global Algae Products Market Volume k Tons Forecast, by Product Type 2019 & 2032
- Table 125: Global Algae Products Market Revenue Million Forecast, by Application 2019 & 2032
- Table 126: Global Algae Products Market Volume k Tons Forecast, by Application 2019 & 2032
- Table 127: Global Algae Products Market Revenue Million Forecast, by Country 2019 & 2032
- Table 128: Global Algae Products Market Volume k Tons Forecast, by Country 2019 & 2032
- Table 129: Brazil Algae Products Market Revenue (Million) Forecast, by Application 2019 & 2032
- Table 130: Brazil Algae Products Market Volume (k Tons) Forecast, by Application 2019 & 2032
- Table 131: Argentina Algae Products Market Revenue (Million) Forecast, by Application 2019 & 2032
- Table 132: Argentina Algae Products Market Volume (k Tons) Forecast, by Application 2019 & 2032
- Table 133: Rest of South America Algae Products Market Revenue (Million) Forecast, by Application 2019 & 2032
- Table 134: Rest of South America Algae Products Market Volume (k Tons) Forecast, by Application 2019 & 2032
- Table 135: Global Algae Products Market Revenue Million Forecast, by Source 2019 & 2032
- Table 136: Global Algae Products Market Volume k Tons Forecast, by Source 2019 & 2032
- Table 137: Global Algae Products Market Revenue Million Forecast, by Product Type 2019 & 2032
- Table 138: Global Algae Products Market Volume k Tons Forecast, by Product Type 2019 & 2032
- Table 139: Global Algae Products Market Revenue Million Forecast, by Application 2019 & 2032
- Table 140: Global Algae Products Market Volume k Tons Forecast, by Application 2019 & 2032
- Table 141: Global Algae Products Market Revenue Million Forecast, by Country 2019 & 2032
- Table 142: Global Algae Products Market Volume k Tons Forecast, by Country 2019 & 2032
- Table 143: South Africa Algae Products Market Revenue (Million) Forecast, by Application 2019 & 2032
- Table 144: South Africa Algae Products Market Volume (k Tons) Forecast, by Application 2019 & 2032
- Table 145: United Arab Emirates Algae Products Market Revenue (Million) Forecast, by Application 2019 & 2032
- Table 146: United Arab Emirates Algae Products Market Volume (k Tons) Forecast, by Application 2019 & 2032
- Table 147: Rest of Middle East and Africa Algae Products Market Revenue (Million) Forecast, by Application 2019 & 2032
- Table 148: Rest of Middle East and Africa Algae Products Market Volume (k Tons) Forecast, by Application 2019 & 2032
Frequently Asked Questions
1. What is the projected Compound Annual Growth Rate (CAGR) of the Algae Products Market?
The projected CAGR is approximately 4.99%.
2. Which companies are prominent players in the Algae Products Market?
Key companies in the market include Cargill Incorporated, Aliga Microalgae Company, Source Omega LLC, Progress Biotech BV, DuPont de Nemours Inc, Archer Daniels Midland Company, BASF SE, Koninklijke DSM N V, Algenol Biotech LLC*List Not Exhaustive, Yemoja Ltd, ACCEL Carrageenan Corporation.
3. What are the main segments of the Algae Products Market?
The market segments include Source, Product Type, Application.
4. Can you provide details about the market size?
The market size is estimated to be USD 1.92 Million as of 2022.
5. What are some drivers contributing to market growth?
Increasing Demand for Processed Food Products; Technological Advancements Supporting Market Growth.
6. What are the notable trends driving market growth?
Health Benefits Associated With Algae Products' Consumption.
7. Are there any restraints impacting market growth?
Increasing Cost of Production Due to Rise in Energy and Labor Cost.
8. Can you provide examples of recent developments in the market?
In September 2022, in the Netherlands, the Danish company Aliga Microalgae (Aliga) acquired a large chlorella algae facility. The company plans to use a modern production facility to commercialize its chlorella algae products.
9. What pricing options are available for accessing the report?
Pricing options include single-user, multi-user, and enterprise licenses priced at USD 4750, USD 5250, and USD 8750 respectively.
10. Is the market size provided in terms of value or volume?
The market size is provided in terms of value, measured in Million and volume, measured in k Tons.
11. Are there any specific market keywords associated with the report?
Yes, the market keyword associated with the report is "Algae Products Market," which aids in identifying and referencing the specific market segment covered.
12. How do I determine which pricing option suits my needs best?
The pricing options vary based on user requirements and access needs. Individual users may opt for single-user licenses, while businesses requiring broader access may choose multi-user or enterprise licenses for cost-effective access to the report.
13. Are there any additional resources or data provided in the Algae Products Market report?
While the report offers comprehensive insights, it's advisable to review the specific contents or supplementary materials provided to ascertain if additional resources or data are available.
14. How can I stay updated on further developments or reports in the Algae Products Market?
To stay informed about further developments, trends, and reports in the Algae Products Market, consider subscribing to industry newsletters, following relevant companies and organizations, or regularly checking reputable industry news sources and publications.
Methodology
Step 1 - Identification of Relevant Samples Size from Population Database


Step 2 - Approaches for Defining Global Market Size (Value, Volume* & Price*)

Note*: In applicable scenarios
Step 3 - Data Sources
Primary Research
- Web Analytics
- Survey Reports
- Research Institute
- Latest Research Reports
- Opinion Leaders
Secondary Research
- Annual Reports
- White Paper
- Latest Press Release
- Industry Association
- Paid Database
- Investor Presentations

Step 4 - Data Triangulation
Involves using different sources of information in order to increase the validity of a study
These sources are likely to be stakeholders in a program - participants, other researchers, program staff, other community members, and so on.
Then we put all data in single framework & apply various statistical tools to find out the dynamic on the market.
During the analysis stage, feedback from the stakeholder groups would be compared to determine areas of agreement as well as areas of divergence
