

Key Insights
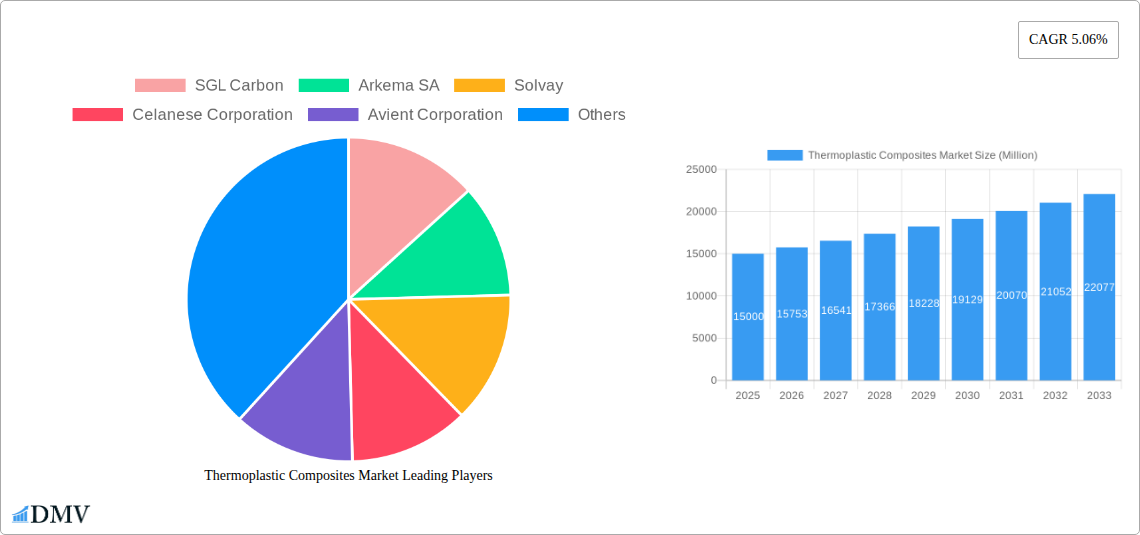
The thermoplastic composites market is experiencing robust growth, driven by increasing demand across diverse end-user industries. A Compound Annual Growth Rate (CAGR) of 5.06% from 2019 to 2024 suggests a significant expansion, projected to continue into the forecast period (2025-2033). This growth is fueled by several key factors. The automotive industry's push for lighter, fuel-efficient vehicles is a major driver, leading to increased adoption of thermoplastic composites in body panels and structural components. Similarly, the aerospace and defense sectors are leveraging these materials for their high strength-to-weight ratio and design flexibility, leading to innovative aircraft and spacecraft designs. Furthermore, the electrical and electronics industry utilizes thermoplastic composites for their insulation properties and ability to withstand high temperatures, making them ideal for various components. The construction industry's adoption is also rising, due to their durability and resistance to corrosion. Within the segment breakdown, short fiber thermoplastics (SFT) currently hold the largest market share, due to their cost-effectiveness and ease of processing. However, long fiber thermoplastics (LFT) and continuous fiber thermoplastics (CFT) are witnessing faster growth rates, driven by their superior mechanical properties. The polypropylene (PP) and polyamide (PA) resin types are dominant, but the use of high-performance materials like polyetheretherketone (PEEK) is growing steadily, reflecting a push towards higher-performance applications. Regionally, North America and Europe are currently leading the market, but the Asia-Pacific region is poised for significant growth, driven by expanding manufacturing sectors and infrastructure development in countries like China and India. The competitive landscape features both established chemical giants and specialized composite manufacturers, indicating a dynamic market with ongoing innovation and consolidation.
The market's future growth will be shaped by ongoing technological advancements, focusing on improved material properties, enhanced manufacturing processes, and cost reductions. Sustainability concerns are also influencing the market, with increasing demand for recycled and bio-based thermoplastic composites. However, challenges remain, including the relatively higher cost compared to traditional materials, as well as the need for specialized processing equipment. Overcoming these barriers through continued research and development, along with collaborative efforts across the value chain, will be critical for sustained market expansion. The market segmentation strategy, encompassing resin type, fiber type, product type, and end-user industry, offers valuable insights for stakeholders seeking targeted growth opportunities. Careful consideration of these segments is essential for strategic decision-making and effective market penetration.
Thermoplastic Composites Market: A Comprehensive Report (2019-2033)
This insightful report provides a comprehensive analysis of the global Thermoplastic Composites market, encompassing market size, growth drivers, challenges, and future opportunities. The study period spans from 2019 to 2033, with 2025 serving as the base and estimated year. The report meticulously analyzes key segments including Resin Type (Polypropylene (PP), Polyamide (PA), Polyetheretherketone (PEEK), Other Resin Types), Fiber Type (Glass Fiber, Carbon Fiber, Other Fiber Types), and Product Type (Short Fiber Thermoplastic (SFT), Long Fiber Thermoplastic (LFT), Continuous Fiber Thermoplastic (CFT), Glass Mat Thermoplastic (GMT)), across diverse end-user industries like Aerospace and Defense, Electrical and Electronics, Automotive, Construction, and Medical. The market is projected to reach xx Million by 2033, exhibiting a robust CAGR. Key players like SGL Carbon, Arkema SA, Solvay, and others are profiled, providing crucial insights into their strategies and market positioning.
Thermoplastic Composites Market Composition & Trends
This section delves into the competitive landscape of the Thermoplastic Composites market, evaluating market concentration, innovation drivers, regulatory influences, and the impact of substitute products. The analysis encompasses end-user preferences and the role of mergers and acquisitions (M&A) activities.
Market Concentration & Competition: The market exhibits a moderately concentrated structure, with a few major players holding significant market share. The xx Million market is largely dominated by SGL Carbon, Arkema SA, and Solvay, collectively commanding approximately xx% of the market share in 2024. Smaller players focus on niche segments and specialized applications.
Innovation Catalysts: Continuous advancements in material science and manufacturing technologies are driving innovation. The focus is on developing lightweight, high-strength composites with improved performance characteristics to cater to the demands of various industries.
Regulatory Landscape & Substitutes: Stringent environmental regulations and growing concerns about sustainability are influencing material choices. The availability of alternative materials like traditional metal composites presents a competitive challenge. However, thermoplastic composites offer superior properties in many applications, leading to their increasing adoption.
M&A Activity: The Thermoplastic Composites market has witnessed significant M&A activity in recent years, particularly during 2022 and 2023 with total deal values estimated at xx Million. These activities reflect the strategic importance of consolidating market share and gaining access to advanced technologies and wider market reach.
Thermoplastic Composites Market Industry Evolution
This section analyzes the historical and projected growth trajectories of the Thermoplastic Composites market, exploring technological advancements and shifts in consumer demand.
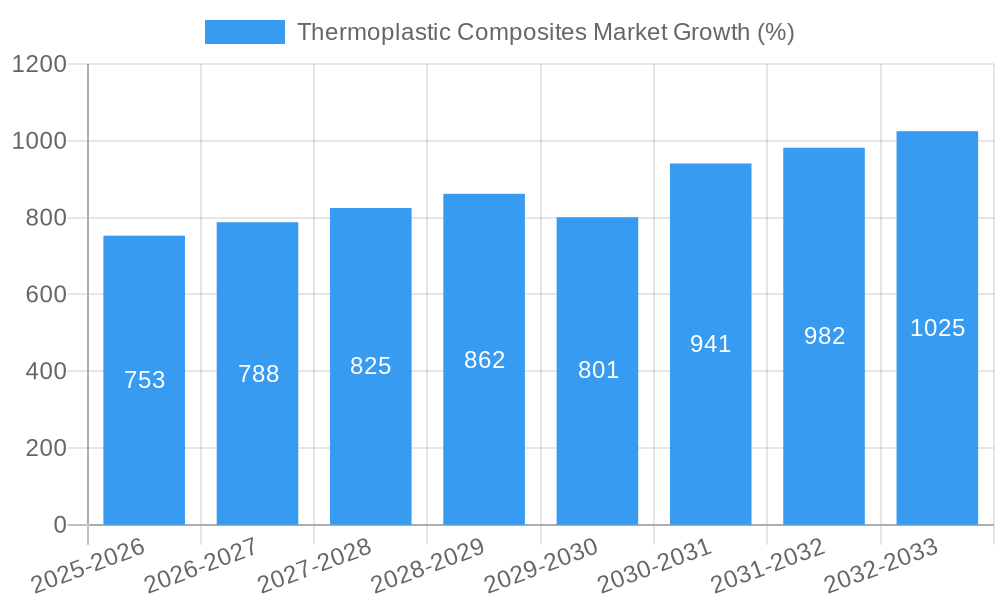
The Thermoplastic Composites market has experienced consistent growth over the historical period (2019-2024), with a CAGR of approximately xx%. This growth is primarily fueled by increasing demand from the automotive and aerospace sectors, driven by the need for lightweight and high-performance materials. Technological advancements, particularly in fiber reinforcement and resin formulations, have further propelled market expansion. The adoption of thermoplastic composites has accelerated in recent years due to their superior processability and recyclability compared to thermoset composites. The automotive industry, in particular, is witnessing a rapid shift towards adopting these materials to meet stricter fuel efficiency and emission standards. Furthermore, the increasing demand for lightweighting in aerospace applications and growing adoption of advanced materials in construction and medical fields are significantly contributing to the growth of this market. The forecast period (2025-2033) anticipates a continued growth trajectory, with a projected CAGR of approximately xx%, driven by emerging applications and technological advancements. Specific adoption rates vary by segment, with the automotive sector showing the fastest growth in thermoplastic composite adoption, at a rate of xx% annually in 2024.
Leading Regions, Countries, or Segments in Thermoplastic Composites Market
This section identifies the leading regions, countries, and segments within the Thermoplastic Composites market.
Dominant Region: North America currently holds the largest market share, followed by Europe and Asia Pacific. Strong demand from the automotive and aerospace industries in North America contributes significantly to this dominance.
Key Drivers:
- High investment in R&D: Significant investment in research and development of advanced thermoplastic composites is driving growth in leading regions.
- Government support and incentives: Favorable government policies and incentives promoting the use of lightweight materials in various industries are boosting market growth.
- Strong presence of major players: A large number of established players with extensive manufacturing capabilities and well-developed supply chains are concentrated in dominant regions.
Dominant Resin Type: Polypropylene (PP) dominates the resin type segment due to its cost-effectiveness and suitable properties for a wide range of applications. However, the demand for high-performance PEEK is rising steadily in niche applications.
Dominant Fiber Type: Glass fiber remains the most prevalent fiber type due to its cost-effectiveness and widespread availability. Carbon fiber is gaining traction in high-performance applications due to its superior strength-to-weight ratio.
Dominant Product Type: Short Fiber Thermoplastic (SFT) currently holds the largest market share due to its versatility and ease of processing. However, the demand for Long Fiber Thermoplastic (LFT) and Continuous Fiber Thermoplastic (CFT) is experiencing significant growth.
Dominant End-user Industry: The automotive industry accounts for the largest share of the end-user segment, driven by lightweighting initiatives and stringent fuel efficiency regulations. The aerospace and defense industry shows high growth potential due to the unique properties of thermoplastic composites.
Thermoplastic Composites Market Product Innovations
Recent innovations focus on enhanced mechanical properties, improved processability, and greater sustainability. The development of new resin systems, such as high-temperature-resistant PEEK-based composites, expands applications to high-demand industries such as aerospace. Furthermore, ongoing advancements in fiber technology, like the use of carbon nanotubes, lead to higher strength-to-weight ratios. These improvements in performance and processability contribute significantly to the expanding adoption of thermoplastic composites across various end-user industries.
Propelling Factors for Thermoplastic Composites Market Growth
Several factors fuel the growth of the thermoplastic composites market. Technological advancements in material science continuously improve the mechanical properties and processability of these composites. The increasing demand for lightweight materials in the automotive and aerospace industries drives significant growth, as these materials offer superior strength-to-weight ratios compared to traditional materials. Furthermore, stringent environmental regulations worldwide promote the adoption of sustainable materials with reduced carbon footprint, providing a significant boost to the market.
Obstacles in the Thermoplastic Composites Market
Despite the considerable growth, the thermoplastic composites market faces challenges. High initial investment costs for processing equipment and the relatively high material prices compared to conventional materials can limit broader adoption. Supply chain disruptions and fluctuations in raw material prices also pose a risk, affecting production costs and overall market stability. Competition from other advanced materials like thermoset composites and metals further limits growth.
Future Opportunities in Thermoplastic Composites Market
Emerging opportunities lie in expanding into new applications and markets. The development of recyclable and bio-based thermoplastic composites addresses growing environmental concerns, opening avenues for market expansion. The increasing focus on sustainable practices will further drive demand for environmentally friendly alternatives, creating a fertile ground for growth. New applications in areas like construction and medical devices also represent significant future opportunities.
Major Players in the Thermoplastic Composites Market Ecosystem
- SGL Carbon
- Arkema SA
- Solvay
- Celanese Corporation
- Avient Corporation
- LANXESS
- BASF SE
- SABIC
- DSM
- Daicel Corporation
- Toray Industries Inc
- Mitsubishi Chemical Group Corporation
- Hexcel Corporation
- AVANCO Group
- TechnoCompound GmbH
- LyondellBasell Industries Holdings BV
Key Developments in Thermoplastic Composites Market Industry
April 2023: LANXESS and Advent International launch a joint venture focused on engineering materials, combining DSM's Engineering Materials and LANXESS's High-Performance Materials businesses. This significantly alters the competitive landscape.
April 2023: Solvay and GKN Aerospace extend their partnership to develop a thermoplastic composites roadmap for aircraft structures, further solidifying Solvay's position as a preferred supplier and boosting the market for PEKK composites and films.
Strategic Thermoplastic Composites Market Forecast
The thermoplastic composites market is poised for substantial growth in the coming years, driven by continuous technological advancements, increasing demand from key end-user industries, and a growing focus on sustainability. The market's potential for expansion into new applications, particularly in sectors emphasizing lightweighting and environmental friendliness, ensures a bright future for this innovative material segment. The projected CAGR over the forecast period reflects significant growth and continued market penetration across diverse sectors.
Thermoplastic Composites Market Segmentation
-
1. Resin Type
- 1.1. Polypropylene (PP)
- 1.2. Polyamide (PA)
- 1.3. Polyetheretherketone (PEEK)
- 1.4. Other Resin Types
-
2. Fiber Type
- 2.1. Glass Fiber
- 2.2. Carbon Fiber
- 2.3. Other Fiber Types
-
3. Product Type
- 3.1. Short Fiber Thermoplastic (SFT)
- 3.2. Long Fiber Thermoplastic (LFT)
- 3.3. Continuous Fiber Thermoplastic (CFT)
- 3.4. Glass Mat Thermoplastic (GMT)
-
4. End-user Industry
- 4.1. Automotive
- 4.2. Construction
- 4.3. Medical
- 4.4. Other End-user Industries
Thermoplastic Composites Market Segmentation By Geography
-
1. Asia Pacific
- 1.1. China
- 1.2. India
- 1.3. Japan
- 1.4. South Korea
- 1.5. ASEAN Countries
- 1.6. Rest of Asia Pacific
-
2. North America
- 2.1. United States
- 2.2. Canada
- 2.3. Mexico
-
3. Europe
- 3.1. Germany
- 3.2. United Kingdom
- 3.3. France
- 3.4. Italy
- 3.5. Rest of Europe
-
4. South America
- 4.1. Brazil
- 4.2. Argentina
- 4.3. Rest of South America
-
5. Middle East and Africa
- 5.1. Saudi Arabia
- 5.2. South Africa
- 5.3. Rest of Middle East and Africa

Thermoplastic Composites Market REPORT HIGHLIGHTS
| Aspects | Details |
|---|---|
| Study Period | 2019-2033 |
| Base Year | 2024 |
| Estimated Year | 2025 |
| Forecast Period | 2025-2033 |
| Historical Period | 2019-2024 |
| Growth Rate | CAGR of 5.06% from 2019-2033 |
| Segmentation |
|
Table of Contents
- 1. Introduction
- 1.1. Research Scope
- 1.2. Market Segmentation
- 1.3. Research Methodology
- 1.4. Definitions and Assumptions
- 2. Executive Summary
- 2.1. Introduction
- 3. Market Dynamics
- 3.1. Introduction
- 3.2. Market Drivers
- 3.2.1. Increasing Demand from the Automotive Industry; Rising Consumption in the Construction Industry
- 3.3. Market Restrains
- 3.3.1. High Cost of Raw Materials and Challenges to Form Thermoplastic Composites; Other Restraints
- 3.4. Market Trends
- 3.4.1. Automotive Industry to Dominate the Market
- 4. Market Factor Analysis
- 4.1. Porters Five Forces
- 4.2. Supply/Value Chain
- 4.3. PESTEL analysis
- 4.4. Market Entropy
- 4.5. Patent/Trademark Analysis
- 5. Global Thermoplastic Composites Market Analysis, Insights and Forecast, 2019-2031
- 5.1. Market Analysis, Insights and Forecast - by Resin Type
- 5.1.1. Polypropylene (PP)
- 5.1.2. Polyamide (PA)
- 5.1.3. Polyetheretherketone (PEEK)
- 5.1.4. Other Resin Types
- 5.2. Market Analysis, Insights and Forecast - by Fiber Type
- 5.2.1. Glass Fiber
- 5.2.2. Carbon Fiber
- 5.2.3. Other Fiber Types
- 5.3. Market Analysis, Insights and Forecast - by Product Type
- 5.3.1. Short Fiber Thermoplastic (SFT)
- 5.3.2. Long Fiber Thermoplastic (LFT)
- 5.3.3. Continuous Fiber Thermoplastic (CFT)
- 5.3.4. Glass Mat Thermoplastic (GMT)
- 5.4. Market Analysis, Insights and Forecast - by End-user Industry
- 5.4.1. Automotive
- 5.4.2. Construction
- 5.4.3. Medical
- 5.4.4. Other End-user Industries
- 5.5. Market Analysis, Insights and Forecast - by Region
- 5.5.1. Asia Pacific
- 5.5.2. North America
- 5.5.3. Europe
- 5.5.4. South America
- 5.5.5. Middle East and Africa
- 5.1. Market Analysis, Insights and Forecast - by Resin Type
- 6. Asia Pacific Thermoplastic Composites Market Analysis, Insights and Forecast, 2019-2031
- 6.1. Market Analysis, Insights and Forecast - by Resin Type
- 6.1.1. Polypropylene (PP)
- 6.1.2. Polyamide (PA)
- 6.1.3. Polyetheretherketone (PEEK)
- 6.1.4. Other Resin Types
- 6.2. Market Analysis, Insights and Forecast - by Fiber Type
- 6.2.1. Glass Fiber
- 6.2.2. Carbon Fiber
- 6.2.3. Other Fiber Types
- 6.3. Market Analysis, Insights and Forecast - by Product Type
- 6.3.1. Short Fiber Thermoplastic (SFT)
- 6.3.2. Long Fiber Thermoplastic (LFT)
- 6.3.3. Continuous Fiber Thermoplastic (CFT)
- 6.3.4. Glass Mat Thermoplastic (GMT)
- 6.4. Market Analysis, Insights and Forecast - by End-user Industry
- 6.4.1. Automotive
- 6.4.2. Construction
- 6.4.3. Medical
- 6.4.4. Other End-user Industries
- 6.1. Market Analysis, Insights and Forecast - by Resin Type
- 7. North America Thermoplastic Composites Market Analysis, Insights and Forecast, 2019-2031
- 7.1. Market Analysis, Insights and Forecast - by Resin Type
- 7.1.1. Polypropylene (PP)
- 7.1.2. Polyamide (PA)
- 7.1.3. Polyetheretherketone (PEEK)
- 7.1.4. Other Resin Types
- 7.2. Market Analysis, Insights and Forecast - by Fiber Type
- 7.2.1. Glass Fiber
- 7.2.2. Carbon Fiber
- 7.2.3. Other Fiber Types
- 7.3. Market Analysis, Insights and Forecast - by Product Type
- 7.3.1. Short Fiber Thermoplastic (SFT)
- 7.3.2. Long Fiber Thermoplastic (LFT)
- 7.3.3. Continuous Fiber Thermoplastic (CFT)
- 7.3.4. Glass Mat Thermoplastic (GMT)
- 7.4. Market Analysis, Insights and Forecast - by End-user Industry
- 7.4.1. Automotive
- 7.4.2. Construction
- 7.4.3. Medical
- 7.4.4. Other End-user Industries
- 7.1. Market Analysis, Insights and Forecast - by Resin Type
- 8. Europe Thermoplastic Composites Market Analysis, Insights and Forecast, 2019-2031
- 8.1. Market Analysis, Insights and Forecast - by Resin Type
- 8.1.1. Polypropylene (PP)
- 8.1.2. Polyamide (PA)
- 8.1.3. Polyetheretherketone (PEEK)
- 8.1.4. Other Resin Types
- 8.2. Market Analysis, Insights and Forecast - by Fiber Type
- 8.2.1. Glass Fiber
- 8.2.2. Carbon Fiber
- 8.2.3. Other Fiber Types
- 8.3. Market Analysis, Insights and Forecast - by Product Type
- 8.3.1. Short Fiber Thermoplastic (SFT)
- 8.3.2. Long Fiber Thermoplastic (LFT)
- 8.3.3. Continuous Fiber Thermoplastic (CFT)
- 8.3.4. Glass Mat Thermoplastic (GMT)
- 8.4. Market Analysis, Insights and Forecast - by End-user Industry
- 8.4.1. Automotive
- 8.4.2. Construction
- 8.4.3. Medical
- 8.4.4. Other End-user Industries
- 8.1. Market Analysis, Insights and Forecast - by Resin Type
- 9. South America Thermoplastic Composites Market Analysis, Insights and Forecast, 2019-2031
- 9.1. Market Analysis, Insights and Forecast - by Resin Type
- 9.1.1. Polypropylene (PP)
- 9.1.2. Polyamide (PA)
- 9.1.3. Polyetheretherketone (PEEK)
- 9.1.4. Other Resin Types
- 9.2. Market Analysis, Insights and Forecast - by Fiber Type
- 9.2.1. Glass Fiber
- 9.2.2. Carbon Fiber
- 9.2.3. Other Fiber Types
- 9.3. Market Analysis, Insights and Forecast - by Product Type
- 9.3.1. Short Fiber Thermoplastic (SFT)
- 9.3.2. Long Fiber Thermoplastic (LFT)
- 9.3.3. Continuous Fiber Thermoplastic (CFT)
- 9.3.4. Glass Mat Thermoplastic (GMT)
- 9.4. Market Analysis, Insights and Forecast - by End-user Industry
- 9.4.1. Automotive
- 9.4.2. Construction
- 9.4.3. Medical
- 9.4.4. Other End-user Industries
- 9.1. Market Analysis, Insights and Forecast - by Resin Type
- 10. Middle East and Africa Thermoplastic Composites Market Analysis, Insights and Forecast, 2019-2031
- 10.1. Market Analysis, Insights and Forecast - by Resin Type
- 10.1.1. Polypropylene (PP)
- 10.1.2. Polyamide (PA)
- 10.1.3. Polyetheretherketone (PEEK)
- 10.1.4. Other Resin Types
- 10.2. Market Analysis, Insights and Forecast - by Fiber Type
- 10.2.1. Glass Fiber
- 10.2.2. Carbon Fiber
- 10.2.3. Other Fiber Types
- 10.3. Market Analysis, Insights and Forecast - by Product Type
- 10.3.1. Short Fiber Thermoplastic (SFT)
- 10.3.2. Long Fiber Thermoplastic (LFT)
- 10.3.3. Continuous Fiber Thermoplastic (CFT)
- 10.3.4. Glass Mat Thermoplastic (GMT)
- 10.4. Market Analysis, Insights and Forecast - by End-user Industry
- 10.4.1. Automotive
- 10.4.2. Construction
- 10.4.3. Medical
- 10.4.4. Other End-user Industries
- 10.1. Market Analysis, Insights and Forecast - by Resin Type
- 11. North America Thermoplastic Composites Market Analysis, Insights and Forecast, 2019-2031
- 11.1. Market Analysis, Insights and Forecast - By Country/Sub-region
- 11.1.1 United States
- 11.1.2 Canada
- 11.1.3 Mexico
- 12. Europe Thermoplastic Composites Market Analysis, Insights and Forecast, 2019-2031
- 12.1. Market Analysis, Insights and Forecast - By Country/Sub-region
- 12.1.1 Germany
- 12.1.2 France
- 12.1.3 Italy
- 12.1.4 United Kingdom
- 12.1.5 Netherlands
- 12.1.6 Rest of Europe
- 13. Asia Pacific Thermoplastic Composites Market Analysis, Insights and Forecast, 2019-2031
- 13.1. Market Analysis, Insights and Forecast - By Country/Sub-region
- 13.1.1 China
- 13.1.2 Japan
- 13.1.3 India
- 13.1.4 South Korea
- 13.1.5 Taiwan
- 13.1.6 Australia
- 13.1.7 Rest of Asia-Pacific
- 14. South America Thermoplastic Composites Market Analysis, Insights and Forecast, 2019-2031
- 14.1. Market Analysis, Insights and Forecast - By Country/Sub-region
- 14.1.1 Brazil
- 14.1.2 Argentina
- 14.1.3 Rest of South America
- 15. MEA Thermoplastic Composites Market Analysis, Insights and Forecast, 2019-2031
- 15.1. Market Analysis, Insights and Forecast - By Country/Sub-region
- 15.1.1 Middle East
- 15.1.2 Africa
- 16. Competitive Analysis
- 16.1. Global Market Share Analysis 2024
- 16.2. Company Profiles
- 16.2.1 SGL Carbon
- 16.2.1.1. Overview
- 16.2.1.2. Products
- 16.2.1.3. SWOT Analysis
- 16.2.1.4. Recent Developments
- 16.2.1.5. Financials (Based on Availability)
- 16.2.2 Arkema SA
- 16.2.2.1. Overview
- 16.2.2.2. Products
- 16.2.2.3. SWOT Analysis
- 16.2.2.4. Recent Developments
- 16.2.2.5. Financials (Based on Availability)
- 16.2.3 Solvay
- 16.2.3.1. Overview
- 16.2.3.2. Products
- 16.2.3.3. SWOT Analysis
- 16.2.3.4. Recent Developments
- 16.2.3.5. Financials (Based on Availability)
- 16.2.4 Celanese Corporation
- 16.2.4.1. Overview
- 16.2.4.2. Products
- 16.2.4.3. SWOT Analysis
- 16.2.4.4. Recent Developments
- 16.2.4.5. Financials (Based on Availability)
- 16.2.5 Avient Corporation
- 16.2.5.1. Overview
- 16.2.5.2. Products
- 16.2.5.3. SWOT Analysis
- 16.2.5.4. Recent Developments
- 16.2.5.5. Financials (Based on Availability)
- 16.2.6 LANXESS
- 16.2.6.1. Overview
- 16.2.6.2. Products
- 16.2.6.3. SWOT Analysis
- 16.2.6.4. Recent Developments
- 16.2.6.5. Financials (Based on Availability)
- 16.2.7 BASF SE
- 16.2.7.1. Overview
- 16.2.7.2. Products
- 16.2.7.3. SWOT Analysis
- 16.2.7.4. Recent Developments
- 16.2.7.5. Financials (Based on Availability)
- 16.2.8 SABIC
- 16.2.8.1. Overview
- 16.2.8.2. Products
- 16.2.8.3. SWOT Analysis
- 16.2.8.4. Recent Developments
- 16.2.8.5. Financials (Based on Availability)
- 16.2.9 DSM
- 16.2.9.1. Overview
- 16.2.9.2. Products
- 16.2.9.3. SWOT Analysis
- 16.2.9.4. Recent Developments
- 16.2.9.5. Financials (Based on Availability)
- 16.2.10 Daicel Corporation
- 16.2.10.1. Overview
- 16.2.10.2. Products
- 16.2.10.3. SWOT Analysis
- 16.2.10.4. Recent Developments
- 16.2.10.5. Financials (Based on Availability)
- 16.2.11 Toray Industries Inc
- 16.2.11.1. Overview
- 16.2.11.2. Products
- 16.2.11.3. SWOT Analysis
- 16.2.11.4. Recent Developments
- 16.2.11.5. Financials (Based on Availability)
- 16.2.12 Mitsubishi Chemical Group Corporation
- 16.2.12.1. Overview
- 16.2.12.2. Products
- 16.2.12.3. SWOT Analysis
- 16.2.12.4. Recent Developments
- 16.2.12.5. Financials (Based on Availability)
- 16.2.13 Hexcel Corporation
- 16.2.13.1. Overview
- 16.2.13.2. Products
- 16.2.13.3. SWOT Analysis
- 16.2.13.4. Recent Developments
- 16.2.13.5. Financials (Based on Availability)
- 16.2.14 AVANCO Group
- 16.2.14.1. Overview
- 16.2.14.2. Products
- 16.2.14.3. SWOT Analysis
- 16.2.14.4. Recent Developments
- 16.2.14.5. Financials (Based on Availability)
- 16.2.15 TechnoCompound GmbH
- 16.2.15.1. Overview
- 16.2.15.2. Products
- 16.2.15.3. SWOT Analysis
- 16.2.15.4. Recent Developments
- 16.2.15.5. Financials (Based on Availability)
- 16.2.16 LyondellBasell Industries Holdings BV
- 16.2.16.1. Overview
- 16.2.16.2. Products
- 16.2.16.3. SWOT Analysis
- 16.2.16.4. Recent Developments
- 16.2.16.5. Financials (Based on Availability)
- 16.2.1 SGL Carbon
List of Figures
- Figure 1: Global Thermoplastic Composites Market Revenue Breakdown (Million, %) by Region 2024 & 2032
- Figure 2: Global Thermoplastic Composites Market Volume Breakdown (K Tons, %) by Region 2024 & 2032
- Figure 3: North America Thermoplastic Composites Market Revenue (Million), by Country 2024 & 2032
- Figure 4: North America Thermoplastic Composites Market Volume (K Tons), by Country 2024 & 2032
- Figure 5: North America Thermoplastic Composites Market Revenue Share (%), by Country 2024 & 2032
- Figure 6: North America Thermoplastic Composites Market Volume Share (%), by Country 2024 & 2032
- Figure 7: Europe Thermoplastic Composites Market Revenue (Million), by Country 2024 & 2032
- Figure 8: Europe Thermoplastic Composites Market Volume (K Tons), by Country 2024 & 2032
- Figure 9: Europe Thermoplastic Composites Market Revenue Share (%), by Country 2024 & 2032
- Figure 10: Europe Thermoplastic Composites Market Volume Share (%), by Country 2024 & 2032
- Figure 11: Asia Pacific Thermoplastic Composites Market Revenue (Million), by Country 2024 & 2032
- Figure 12: Asia Pacific Thermoplastic Composites Market Volume (K Tons), by Country 2024 & 2032
- Figure 13: Asia Pacific Thermoplastic Composites Market Revenue Share (%), by Country 2024 & 2032
- Figure 14: Asia Pacific Thermoplastic Composites Market Volume Share (%), by Country 2024 & 2032
- Figure 15: South America Thermoplastic Composites Market Revenue (Million), by Country 2024 & 2032
- Figure 16: South America Thermoplastic Composites Market Volume (K Tons), by Country 2024 & 2032
- Figure 17: South America Thermoplastic Composites Market Revenue Share (%), by Country 2024 & 2032
- Figure 18: South America Thermoplastic Composites Market Volume Share (%), by Country 2024 & 2032
- Figure 19: MEA Thermoplastic Composites Market Revenue (Million), by Country 2024 & 2032
- Figure 20: MEA Thermoplastic Composites Market Volume (K Tons), by Country 2024 & 2032
- Figure 21: MEA Thermoplastic Composites Market Revenue Share (%), by Country 2024 & 2032
- Figure 22: MEA Thermoplastic Composites Market Volume Share (%), by Country 2024 & 2032
- Figure 23: Asia Pacific Thermoplastic Composites Market Revenue (Million), by Resin Type 2024 & 2032
- Figure 24: Asia Pacific Thermoplastic Composites Market Volume (K Tons), by Resin Type 2024 & 2032
- Figure 25: Asia Pacific Thermoplastic Composites Market Revenue Share (%), by Resin Type 2024 & 2032
- Figure 26: Asia Pacific Thermoplastic Composites Market Volume Share (%), by Resin Type 2024 & 2032
- Figure 27: Asia Pacific Thermoplastic Composites Market Revenue (Million), by Fiber Type 2024 & 2032
- Figure 28: Asia Pacific Thermoplastic Composites Market Volume (K Tons), by Fiber Type 2024 & 2032
- Figure 29: Asia Pacific Thermoplastic Composites Market Revenue Share (%), by Fiber Type 2024 & 2032
- Figure 30: Asia Pacific Thermoplastic Composites Market Volume Share (%), by Fiber Type 2024 & 2032
- Figure 31: Asia Pacific Thermoplastic Composites Market Revenue (Million), by Product Type 2024 & 2032
- Figure 32: Asia Pacific Thermoplastic Composites Market Volume (K Tons), by Product Type 2024 & 2032
- Figure 33: Asia Pacific Thermoplastic Composites Market Revenue Share (%), by Product Type 2024 & 2032
- Figure 34: Asia Pacific Thermoplastic Composites Market Volume Share (%), by Product Type 2024 & 2032
- Figure 35: Asia Pacific Thermoplastic Composites Market Revenue (Million), by End-user Industry 2024 & 2032
- Figure 36: Asia Pacific Thermoplastic Composites Market Volume (K Tons), by End-user Industry 2024 & 2032
- Figure 37: Asia Pacific Thermoplastic Composites Market Revenue Share (%), by End-user Industry 2024 & 2032
- Figure 38: Asia Pacific Thermoplastic Composites Market Volume Share (%), by End-user Industry 2024 & 2032
- Figure 39: Asia Pacific Thermoplastic Composites Market Revenue (Million), by Country 2024 & 2032
- Figure 40: Asia Pacific Thermoplastic Composites Market Volume (K Tons), by Country 2024 & 2032
- Figure 41: Asia Pacific Thermoplastic Composites Market Revenue Share (%), by Country 2024 & 2032
- Figure 42: Asia Pacific Thermoplastic Composites Market Volume Share (%), by Country 2024 & 2032
- Figure 43: North America Thermoplastic Composites Market Revenue (Million), by Resin Type 2024 & 2032
- Figure 44: North America Thermoplastic Composites Market Volume (K Tons), by Resin Type 2024 & 2032
- Figure 45: North America Thermoplastic Composites Market Revenue Share (%), by Resin Type 2024 & 2032
- Figure 46: North America Thermoplastic Composites Market Volume Share (%), by Resin Type 2024 & 2032
- Figure 47: North America Thermoplastic Composites Market Revenue (Million), by Fiber Type 2024 & 2032
- Figure 48: North America Thermoplastic Composites Market Volume (K Tons), by Fiber Type 2024 & 2032
- Figure 49: North America Thermoplastic Composites Market Revenue Share (%), by Fiber Type 2024 & 2032
- Figure 50: North America Thermoplastic Composites Market Volume Share (%), by Fiber Type 2024 & 2032
- Figure 51: North America Thermoplastic Composites Market Revenue (Million), by Product Type 2024 & 2032
- Figure 52: North America Thermoplastic Composites Market Volume (K Tons), by Product Type 2024 & 2032
- Figure 53: North America Thermoplastic Composites Market Revenue Share (%), by Product Type 2024 & 2032
- Figure 54: North America Thermoplastic Composites Market Volume Share (%), by Product Type 2024 & 2032
- Figure 55: North America Thermoplastic Composites Market Revenue (Million), by End-user Industry 2024 & 2032
- Figure 56: North America Thermoplastic Composites Market Volume (K Tons), by End-user Industry 2024 & 2032
- Figure 57: North America Thermoplastic Composites Market Revenue Share (%), by End-user Industry 2024 & 2032
- Figure 58: North America Thermoplastic Composites Market Volume Share (%), by End-user Industry 2024 & 2032
- Figure 59: North America Thermoplastic Composites Market Revenue (Million), by Country 2024 & 2032
- Figure 60: North America Thermoplastic Composites Market Volume (K Tons), by Country 2024 & 2032
- Figure 61: North America Thermoplastic Composites Market Revenue Share (%), by Country 2024 & 2032
- Figure 62: North America Thermoplastic Composites Market Volume Share (%), by Country 2024 & 2032
- Figure 63: Europe Thermoplastic Composites Market Revenue (Million), by Resin Type 2024 & 2032
- Figure 64: Europe Thermoplastic Composites Market Volume (K Tons), by Resin Type 2024 & 2032
- Figure 65: Europe Thermoplastic Composites Market Revenue Share (%), by Resin Type 2024 & 2032
- Figure 66: Europe Thermoplastic Composites Market Volume Share (%), by Resin Type 2024 & 2032
- Figure 67: Europe Thermoplastic Composites Market Revenue (Million), by Fiber Type 2024 & 2032
- Figure 68: Europe Thermoplastic Composites Market Volume (K Tons), by Fiber Type 2024 & 2032
- Figure 69: Europe Thermoplastic Composites Market Revenue Share (%), by Fiber Type 2024 & 2032
- Figure 70: Europe Thermoplastic Composites Market Volume Share (%), by Fiber Type 2024 & 2032
- Figure 71: Europe Thermoplastic Composites Market Revenue (Million), by Product Type 2024 & 2032
- Figure 72: Europe Thermoplastic Composites Market Volume (K Tons), by Product Type 2024 & 2032
- Figure 73: Europe Thermoplastic Composites Market Revenue Share (%), by Product Type 2024 & 2032
- Figure 74: Europe Thermoplastic Composites Market Volume Share (%), by Product Type 2024 & 2032
- Figure 75: Europe Thermoplastic Composites Market Revenue (Million), by End-user Industry 2024 & 2032
- Figure 76: Europe Thermoplastic Composites Market Volume (K Tons), by End-user Industry 2024 & 2032
- Figure 77: Europe Thermoplastic Composites Market Revenue Share (%), by End-user Industry 2024 & 2032
- Figure 78: Europe Thermoplastic Composites Market Volume Share (%), by End-user Industry 2024 & 2032
- Figure 79: Europe Thermoplastic Composites Market Revenue (Million), by Country 2024 & 2032
- Figure 80: Europe Thermoplastic Composites Market Volume (K Tons), by Country 2024 & 2032
- Figure 81: Europe Thermoplastic Composites Market Revenue Share (%), by Country 2024 & 2032
- Figure 82: Europe Thermoplastic Composites Market Volume Share (%), by Country 2024 & 2032
- Figure 83: South America Thermoplastic Composites Market Revenue (Million), by Resin Type 2024 & 2032
- Figure 84: South America Thermoplastic Composites Market Volume (K Tons), by Resin Type 2024 & 2032
- Figure 85: South America Thermoplastic Composites Market Revenue Share (%), by Resin Type 2024 & 2032
- Figure 86: South America Thermoplastic Composites Market Volume Share (%), by Resin Type 2024 & 2032
- Figure 87: South America Thermoplastic Composites Market Revenue (Million), by Fiber Type 2024 & 2032
- Figure 88: South America Thermoplastic Composites Market Volume (K Tons), by Fiber Type 2024 & 2032
- Figure 89: South America Thermoplastic Composites Market Revenue Share (%), by Fiber Type 2024 & 2032
- Figure 90: South America Thermoplastic Composites Market Volume Share (%), by Fiber Type 2024 & 2032
- Figure 91: South America Thermoplastic Composites Market Revenue (Million), by Product Type 2024 & 2032
- Figure 92: South America Thermoplastic Composites Market Volume (K Tons), by Product Type 2024 & 2032
- Figure 93: South America Thermoplastic Composites Market Revenue Share (%), by Product Type 2024 & 2032
- Figure 94: South America Thermoplastic Composites Market Volume Share (%), by Product Type 2024 & 2032
- Figure 95: South America Thermoplastic Composites Market Revenue (Million), by End-user Industry 2024 & 2032
- Figure 96: South America Thermoplastic Composites Market Volume (K Tons), by End-user Industry 2024 & 2032
- Figure 97: South America Thermoplastic Composites Market Revenue Share (%), by End-user Industry 2024 & 2032
- Figure 98: South America Thermoplastic Composites Market Volume Share (%), by End-user Industry 2024 & 2032
- Figure 99: South America Thermoplastic Composites Market Revenue (Million), by Country 2024 & 2032
- Figure 100: South America Thermoplastic Composites Market Volume (K Tons), by Country 2024 & 2032
- Figure 101: South America Thermoplastic Composites Market Revenue Share (%), by Country 2024 & 2032
- Figure 102: South America Thermoplastic Composites Market Volume Share (%), by Country 2024 & 2032
- Figure 103: Middle East and Africa Thermoplastic Composites Market Revenue (Million), by Resin Type 2024 & 2032
- Figure 104: Middle East and Africa Thermoplastic Composites Market Volume (K Tons), by Resin Type 2024 & 2032
- Figure 105: Middle East and Africa Thermoplastic Composites Market Revenue Share (%), by Resin Type 2024 & 2032
- Figure 106: Middle East and Africa Thermoplastic Composites Market Volume Share (%), by Resin Type 2024 & 2032
- Figure 107: Middle East and Africa Thermoplastic Composites Market Revenue (Million), by Fiber Type 2024 & 2032
- Figure 108: Middle East and Africa Thermoplastic Composites Market Volume (K Tons), by Fiber Type 2024 & 2032
- Figure 109: Middle East and Africa Thermoplastic Composites Market Revenue Share (%), by Fiber Type 2024 & 2032
- Figure 110: Middle East and Africa Thermoplastic Composites Market Volume Share (%), by Fiber Type 2024 & 2032
- Figure 111: Middle East and Africa Thermoplastic Composites Market Revenue (Million), by Product Type 2024 & 2032
- Figure 112: Middle East and Africa Thermoplastic Composites Market Volume (K Tons), by Product Type 2024 & 2032
- Figure 113: Middle East and Africa Thermoplastic Composites Market Revenue Share (%), by Product Type 2024 & 2032
- Figure 114: Middle East and Africa Thermoplastic Composites Market Volume Share (%), by Product Type 2024 & 2032
- Figure 115: Middle East and Africa Thermoplastic Composites Market Revenue (Million), by End-user Industry 2024 & 2032
- Figure 116: Middle East and Africa Thermoplastic Composites Market Volume (K Tons), by End-user Industry 2024 & 2032
- Figure 117: Middle East and Africa Thermoplastic Composites Market Revenue Share (%), by End-user Industry 2024 & 2032
- Figure 118: Middle East and Africa Thermoplastic Composites Market Volume Share (%), by End-user Industry 2024 & 2032
- Figure 119: Middle East and Africa Thermoplastic Composites Market Revenue (Million), by Country 2024 & 2032
- Figure 120: Middle East and Africa Thermoplastic Composites Market Volume (K Tons), by Country 2024 & 2032
- Figure 121: Middle East and Africa Thermoplastic Composites Market Revenue Share (%), by Country 2024 & 2032
- Figure 122: Middle East and Africa Thermoplastic Composites Market Volume Share (%), by Country 2024 & 2032
List of Tables
- Table 1: Global Thermoplastic Composites Market Revenue Million Forecast, by Region 2019 & 2032
- Table 2: Global Thermoplastic Composites Market Volume K Tons Forecast, by Region 2019 & 2032
- Table 3: Global Thermoplastic Composites Market Revenue Million Forecast, by Resin Type 2019 & 2032
- Table 4: Global Thermoplastic Composites Market Volume K Tons Forecast, by Resin Type 2019 & 2032
- Table 5: Global Thermoplastic Composites Market Revenue Million Forecast, by Fiber Type 2019 & 2032
- Table 6: Global Thermoplastic Composites Market Volume K Tons Forecast, by Fiber Type 2019 & 2032
- Table 7: Global Thermoplastic Composites Market Revenue Million Forecast, by Product Type 2019 & 2032
- Table 8: Global Thermoplastic Composites Market Volume K Tons Forecast, by Product Type 2019 & 2032
- Table 9: Global Thermoplastic Composites Market Revenue Million Forecast, by End-user Industry 2019 & 2032
- Table 10: Global Thermoplastic Composites Market Volume K Tons Forecast, by End-user Industry 2019 & 2032
- Table 11: Global Thermoplastic Composites Market Revenue Million Forecast, by Region 2019 & 2032
- Table 12: Global Thermoplastic Composites Market Volume K Tons Forecast, by Region 2019 & 2032
- Table 13: Global Thermoplastic Composites Market Revenue Million Forecast, by Country 2019 & 2032
- Table 14: Global Thermoplastic Composites Market Volume K Tons Forecast, by Country 2019 & 2032
- Table 15: United States Thermoplastic Composites Market Revenue (Million) Forecast, by Application 2019 & 2032
- Table 16: United States Thermoplastic Composites Market Volume (K Tons) Forecast, by Application 2019 & 2032
- Table 17: Canada Thermoplastic Composites Market Revenue (Million) Forecast, by Application 2019 & 2032
- Table 18: Canada Thermoplastic Composites Market Volume (K Tons) Forecast, by Application 2019 & 2032
- Table 19: Mexico Thermoplastic Composites Market Revenue (Million) Forecast, by Application 2019 & 2032
- Table 20: Mexico Thermoplastic Composites Market Volume (K Tons) Forecast, by Application 2019 & 2032
- Table 21: Global Thermoplastic Composites Market Revenue Million Forecast, by Country 2019 & 2032
- Table 22: Global Thermoplastic Composites Market Volume K Tons Forecast, by Country 2019 & 2032
- Table 23: Germany Thermoplastic Composites Market Revenue (Million) Forecast, by Application 2019 & 2032
- Table 24: Germany Thermoplastic Composites Market Volume (K Tons) Forecast, by Application 2019 & 2032
- Table 25: France Thermoplastic Composites Market Revenue (Million) Forecast, by Application 2019 & 2032
- Table 26: France Thermoplastic Composites Market Volume (K Tons) Forecast, by Application 2019 & 2032
- Table 27: Italy Thermoplastic Composites Market Revenue (Million) Forecast, by Application 2019 & 2032
- Table 28: Italy Thermoplastic Composites Market Volume (K Tons) Forecast, by Application 2019 & 2032
- Table 29: United Kingdom Thermoplastic Composites Market Revenue (Million) Forecast, by Application 2019 & 2032
- Table 30: United Kingdom Thermoplastic Composites Market Volume (K Tons) Forecast, by Application 2019 & 2032
- Table 31: Netherlands Thermoplastic Composites Market Revenue (Million) Forecast, by Application 2019 & 2032
- Table 32: Netherlands Thermoplastic Composites Market Volume (K Tons) Forecast, by Application 2019 & 2032
- Table 33: Rest of Europe Thermoplastic Composites Market Revenue (Million) Forecast, by Application 2019 & 2032
- Table 34: Rest of Europe Thermoplastic Composites Market Volume (K Tons) Forecast, by Application 2019 & 2032
- Table 35: Global Thermoplastic Composites Market Revenue Million Forecast, by Country 2019 & 2032
- Table 36: Global Thermoplastic Composites Market Volume K Tons Forecast, by Country 2019 & 2032
- Table 37: China Thermoplastic Composites Market Revenue (Million) Forecast, by Application 2019 & 2032
- Table 38: China Thermoplastic Composites Market Volume (K Tons) Forecast, by Application 2019 & 2032
- Table 39: Japan Thermoplastic Composites Market Revenue (Million) Forecast, by Application 2019 & 2032
- Table 40: Japan Thermoplastic Composites Market Volume (K Tons) Forecast, by Application 2019 & 2032
- Table 41: India Thermoplastic Composites Market Revenue (Million) Forecast, by Application 2019 & 2032
- Table 42: India Thermoplastic Composites Market Volume (K Tons) Forecast, by Application 2019 & 2032
- Table 43: South Korea Thermoplastic Composites Market Revenue (Million) Forecast, by Application 2019 & 2032
- Table 44: South Korea Thermoplastic Composites Market Volume (K Tons) Forecast, by Application 2019 & 2032
- Table 45: Taiwan Thermoplastic Composites Market Revenue (Million) Forecast, by Application 2019 & 2032
- Table 46: Taiwan Thermoplastic Composites Market Volume (K Tons) Forecast, by Application 2019 & 2032
- Table 47: Australia Thermoplastic Composites Market Revenue (Million) Forecast, by Application 2019 & 2032
- Table 48: Australia Thermoplastic Composites Market Volume (K Tons) Forecast, by Application 2019 & 2032
- Table 49: Rest of Asia-Pacific Thermoplastic Composites Market Revenue (Million) Forecast, by Application 2019 & 2032
- Table 50: Rest of Asia-Pacific Thermoplastic Composites Market Volume (K Tons) Forecast, by Application 2019 & 2032
- Table 51: Global Thermoplastic Composites Market Revenue Million Forecast, by Country 2019 & 2032
- Table 52: Global Thermoplastic Composites Market Volume K Tons Forecast, by Country 2019 & 2032
- Table 53: Brazil Thermoplastic Composites Market Revenue (Million) Forecast, by Application 2019 & 2032
- Table 54: Brazil Thermoplastic Composites Market Volume (K Tons) Forecast, by Application 2019 & 2032
- Table 55: Argentina Thermoplastic Composites Market Revenue (Million) Forecast, by Application 2019 & 2032
- Table 56: Argentina Thermoplastic Composites Market Volume (K Tons) Forecast, by Application 2019 & 2032
- Table 57: Rest of South America Thermoplastic Composites Market Revenue (Million) Forecast, by Application 2019 & 2032
- Table 58: Rest of South America Thermoplastic Composites Market Volume (K Tons) Forecast, by Application 2019 & 2032
- Table 59: Global Thermoplastic Composites Market Revenue Million Forecast, by Country 2019 & 2032
- Table 60: Global Thermoplastic Composites Market Volume K Tons Forecast, by Country 2019 & 2032
- Table 61: Middle East Thermoplastic Composites Market Revenue (Million) Forecast, by Application 2019 & 2032
- Table 62: Middle East Thermoplastic Composites Market Volume (K Tons) Forecast, by Application 2019 & 2032
- Table 63: Africa Thermoplastic Composites Market Revenue (Million) Forecast, by Application 2019 & 2032
- Table 64: Africa Thermoplastic Composites Market Volume (K Tons) Forecast, by Application 2019 & 2032
- Table 65: Global Thermoplastic Composites Market Revenue Million Forecast, by Resin Type 2019 & 2032
- Table 66: Global Thermoplastic Composites Market Volume K Tons Forecast, by Resin Type 2019 & 2032
- Table 67: Global Thermoplastic Composites Market Revenue Million Forecast, by Fiber Type 2019 & 2032
- Table 68: Global Thermoplastic Composites Market Volume K Tons Forecast, by Fiber Type 2019 & 2032
- Table 69: Global Thermoplastic Composites Market Revenue Million Forecast, by Product Type 2019 & 2032
- Table 70: Global Thermoplastic Composites Market Volume K Tons Forecast, by Product Type 2019 & 2032
- Table 71: Global Thermoplastic Composites Market Revenue Million Forecast, by End-user Industry 2019 & 2032
- Table 72: Global Thermoplastic Composites Market Volume K Tons Forecast, by End-user Industry 2019 & 2032
- Table 73: Global Thermoplastic Composites Market Revenue Million Forecast, by Country 2019 & 2032
- Table 74: Global Thermoplastic Composites Market Volume K Tons Forecast, by Country 2019 & 2032
- Table 75: China Thermoplastic Composites Market Revenue (Million) Forecast, by Application 2019 & 2032
- Table 76: China Thermoplastic Composites Market Volume (K Tons) Forecast, by Application 2019 & 2032
- Table 77: India Thermoplastic Composites Market Revenue (Million) Forecast, by Application 2019 & 2032
- Table 78: India Thermoplastic Composites Market Volume (K Tons) Forecast, by Application 2019 & 2032
- Table 79: Japan Thermoplastic Composites Market Revenue (Million) Forecast, by Application 2019 & 2032
- Table 80: Japan Thermoplastic Composites Market Volume (K Tons) Forecast, by Application 2019 & 2032
- Table 81: South Korea Thermoplastic Composites Market Revenue (Million) Forecast, by Application 2019 & 2032
- Table 82: South Korea Thermoplastic Composites Market Volume (K Tons) Forecast, by Application 2019 & 2032
- Table 83: ASEAN Countries Thermoplastic Composites Market Revenue (Million) Forecast, by Application 2019 & 2032
- Table 84: ASEAN Countries Thermoplastic Composites Market Volume (K Tons) Forecast, by Application 2019 & 2032
- Table 85: Rest of Asia Pacific Thermoplastic Composites Market Revenue (Million) Forecast, by Application 2019 & 2032
- Table 86: Rest of Asia Pacific Thermoplastic Composites Market Volume (K Tons) Forecast, by Application 2019 & 2032
- Table 87: Global Thermoplastic Composites Market Revenue Million Forecast, by Resin Type 2019 & 2032
- Table 88: Global Thermoplastic Composites Market Volume K Tons Forecast, by Resin Type 2019 & 2032
- Table 89: Global Thermoplastic Composites Market Revenue Million Forecast, by Fiber Type 2019 & 2032
- Table 90: Global Thermoplastic Composites Market Volume K Tons Forecast, by Fiber Type 2019 & 2032
- Table 91: Global Thermoplastic Composites Market Revenue Million Forecast, by Product Type 2019 & 2032
- Table 92: Global Thermoplastic Composites Market Volume K Tons Forecast, by Product Type 2019 & 2032
- Table 93: Global Thermoplastic Composites Market Revenue Million Forecast, by End-user Industry 2019 & 2032
- Table 94: Global Thermoplastic Composites Market Volume K Tons Forecast, by End-user Industry 2019 & 2032
- Table 95: Global Thermoplastic Composites Market Revenue Million Forecast, by Country 2019 & 2032
- Table 96: Global Thermoplastic Composites Market Volume K Tons Forecast, by Country 2019 & 2032
- Table 97: United States Thermoplastic Composites Market Revenue (Million) Forecast, by Application 2019 & 2032
- Table 98: United States Thermoplastic Composites Market Volume (K Tons) Forecast, by Application 2019 & 2032
- Table 99: Canada Thermoplastic Composites Market Revenue (Million) Forecast, by Application 2019 & 2032
- Table 100: Canada Thermoplastic Composites Market Volume (K Tons) Forecast, by Application 2019 & 2032
- Table 101: Mexico Thermoplastic Composites Market Revenue (Million) Forecast, by Application 2019 & 2032
- Table 102: Mexico Thermoplastic Composites Market Volume (K Tons) Forecast, by Application 2019 & 2032
- Table 103: Global Thermoplastic Composites Market Revenue Million Forecast, by Resin Type 2019 & 2032
- Table 104: Global Thermoplastic Composites Market Volume K Tons Forecast, by Resin Type 2019 & 2032
- Table 105: Global Thermoplastic Composites Market Revenue Million Forecast, by Fiber Type 2019 & 2032
- Table 106: Global Thermoplastic Composites Market Volume K Tons Forecast, by Fiber Type 2019 & 2032
- Table 107: Global Thermoplastic Composites Market Revenue Million Forecast, by Product Type 2019 & 2032
- Table 108: Global Thermoplastic Composites Market Volume K Tons Forecast, by Product Type 2019 & 2032
- Table 109: Global Thermoplastic Composites Market Revenue Million Forecast, by End-user Industry 2019 & 2032
- Table 110: Global Thermoplastic Composites Market Volume K Tons Forecast, by End-user Industry 2019 & 2032
- Table 111: Global Thermoplastic Composites Market Revenue Million Forecast, by Country 2019 & 2032
- Table 112: Global Thermoplastic Composites Market Volume K Tons Forecast, by Country 2019 & 2032
- Table 113: Germany Thermoplastic Composites Market Revenue (Million) Forecast, by Application 2019 & 2032
- Table 114: Germany Thermoplastic Composites Market Volume (K Tons) Forecast, by Application 2019 & 2032
- Table 115: United Kingdom Thermoplastic Composites Market Revenue (Million) Forecast, by Application 2019 & 2032
- Table 116: United Kingdom Thermoplastic Composites Market Volume (K Tons) Forecast, by Application 2019 & 2032
- Table 117: France Thermoplastic Composites Market Revenue (Million) Forecast, by Application 2019 & 2032
- Table 118: France Thermoplastic Composites Market Volume (K Tons) Forecast, by Application 2019 & 2032
- Table 119: Italy Thermoplastic Composites Market Revenue (Million) Forecast, by Application 2019 & 2032
- Table 120: Italy Thermoplastic Composites Market Volume (K Tons) Forecast, by Application 2019 & 2032
- Table 121: Rest of Europe Thermoplastic Composites Market Revenue (Million) Forecast, by Application 2019 & 2032
- Table 122: Rest of Europe Thermoplastic Composites Market Volume (K Tons) Forecast, by Application 2019 & 2032
- Table 123: Global Thermoplastic Composites Market Revenue Million Forecast, by Resin Type 2019 & 2032
- Table 124: Global Thermoplastic Composites Market Volume K Tons Forecast, by Resin Type 2019 & 2032
- Table 125: Global Thermoplastic Composites Market Revenue Million Forecast, by Fiber Type 2019 & 2032
- Table 126: Global Thermoplastic Composites Market Volume K Tons Forecast, by Fiber Type 2019 & 2032
- Table 127: Global Thermoplastic Composites Market Revenue Million Forecast, by Product Type 2019 & 2032
- Table 128: Global Thermoplastic Composites Market Volume K Tons Forecast, by Product Type 2019 & 2032
- Table 129: Global Thermoplastic Composites Market Revenue Million Forecast, by End-user Industry 2019 & 2032
- Table 130: Global Thermoplastic Composites Market Volume K Tons Forecast, by End-user Industry 2019 & 2032
- Table 131: Global Thermoplastic Composites Market Revenue Million Forecast, by Country 2019 & 2032
- Table 132: Global Thermoplastic Composites Market Volume K Tons Forecast, by Country 2019 & 2032
- Table 133: Brazil Thermoplastic Composites Market Revenue (Million) Forecast, by Application 2019 & 2032
- Table 134: Brazil Thermoplastic Composites Market Volume (K Tons) Forecast, by Application 2019 & 2032
- Table 135: Argentina Thermoplastic Composites Market Revenue (Million) Forecast, by Application 2019 & 2032
- Table 136: Argentina Thermoplastic Composites Market Volume (K Tons) Forecast, by Application 2019 & 2032
- Table 137: Rest of South America Thermoplastic Composites Market Revenue (Million) Forecast, by Application 2019 & 2032
- Table 138: Rest of South America Thermoplastic Composites Market Volume (K Tons) Forecast, by Application 2019 & 2032
- Table 139: Global Thermoplastic Composites Market Revenue Million Forecast, by Resin Type 2019 & 2032
- Table 140: Global Thermoplastic Composites Market Volume K Tons Forecast, by Resin Type 2019 & 2032
- Table 141: Global Thermoplastic Composites Market Revenue Million Forecast, by Fiber Type 2019 & 2032
- Table 142: Global Thermoplastic Composites Market Volume K Tons Forecast, by Fiber Type 2019 & 2032
- Table 143: Global Thermoplastic Composites Market Revenue Million Forecast, by Product Type 2019 & 2032
- Table 144: Global Thermoplastic Composites Market Volume K Tons Forecast, by Product Type 2019 & 2032
- Table 145: Global Thermoplastic Composites Market Revenue Million Forecast, by End-user Industry 2019 & 2032
- Table 146: Global Thermoplastic Composites Market Volume K Tons Forecast, by End-user Industry 2019 & 2032
- Table 147: Global Thermoplastic Composites Market Revenue Million Forecast, by Country 2019 & 2032
- Table 148: Global Thermoplastic Composites Market Volume K Tons Forecast, by Country 2019 & 2032
- Table 149: Saudi Arabia Thermoplastic Composites Market Revenue (Million) Forecast, by Application 2019 & 2032
- Table 150: Saudi Arabia Thermoplastic Composites Market Volume (K Tons) Forecast, by Application 2019 & 2032
- Table 151: South Africa Thermoplastic Composites Market Revenue (Million) Forecast, by Application 2019 & 2032
- Table 152: South Africa Thermoplastic Composites Market Volume (K Tons) Forecast, by Application 2019 & 2032
- Table 153: Rest of Middle East and Africa Thermoplastic Composites Market Revenue (Million) Forecast, by Application 2019 & 2032
- Table 154: Rest of Middle East and Africa Thermoplastic Composites Market Volume (K Tons) Forecast, by Application 2019 & 2032
Frequently Asked Questions
1. What is the projected Compound Annual Growth Rate (CAGR) of the Thermoplastic Composites Market?
The projected CAGR is approximately 5.06%.
2. Which companies are prominent players in the Thermoplastic Composites Market?
Key companies in the market include SGL Carbon, Arkema SA, Solvay, Celanese Corporation, Avient Corporation, LANXESS, BASF SE, SABIC, DSM, Daicel Corporation, Toray Industries Inc, Mitsubishi Chemical Group Corporation, Hexcel Corporation, AVANCO Group, TechnoCompound GmbH, LyondellBasell Industries Holdings BV.
3. What are the main segments of the Thermoplastic Composites Market?
The market segments include Resin Type, Fiber Type, Product Type, End-user Industry.
4. Can you provide details about the market size?
The market size is estimated to be USD XX Million as of 2022.
5. What are some drivers contributing to market growth?
Increasing Demand from the Automotive Industry; Rising Consumption in the Construction Industry.
6. What are the notable trends driving market growth?
Automotive Industry to Dominate the Market.
7. Are there any restraints impacting market growth?
High Cost of Raw Materials and Challenges to Form Thermoplastic Composites; Other Restraints.
8. Can you provide examples of recent developments in the market?
April 2023: LANXESS announced the launch of a joint venture with Advent International focused on engineering materials, which began operations on April 1, 2023. DSM's Engineering Materials segment and LANXESS's former High-Performance Materials business joined forces to establish the new joint venture. LANXESS owns around 40% of the joint venture, while Advent International owns approximately 60%.
9. What pricing options are available for accessing the report?
Pricing options include single-user, multi-user, and enterprise licenses priced at USD 4750, USD 5250, and USD 8750 respectively.
10. Is the market size provided in terms of value or volume?
The market size is provided in terms of value, measured in Million and volume, measured in K Tons.
11. Are there any specific market keywords associated with the report?
Yes, the market keyword associated with the report is "Thermoplastic Composites Market," which aids in identifying and referencing the specific market segment covered.
12. How do I determine which pricing option suits my needs best?
The pricing options vary based on user requirements and access needs. Individual users may opt for single-user licenses, while businesses requiring broader access may choose multi-user or enterprise licenses for cost-effective access to the report.
13. Are there any additional resources or data provided in the Thermoplastic Composites Market report?
While the report offers comprehensive insights, it's advisable to review the specific contents or supplementary materials provided to ascertain if additional resources or data are available.
14. How can I stay updated on further developments or reports in the Thermoplastic Composites Market?
To stay informed about further developments, trends, and reports in the Thermoplastic Composites Market, consider subscribing to industry newsletters, following relevant companies and organizations, or regularly checking reputable industry news sources and publications.
Methodology
Step 1 - Identification of Relevant Samples Size from Population Database


Step 2 - Approaches for Defining Global Market Size (Value, Volume* & Price*)

Note*: In applicable scenarios
Step 3 - Data Sources
Primary Research
- Web Analytics
- Survey Reports
- Research Institute
- Latest Research Reports
- Opinion Leaders
Secondary Research
- Annual Reports
- White Paper
- Latest Press Release
- Industry Association
- Paid Database
- Investor Presentations

Step 4 - Data Triangulation
Involves using different sources of information in order to increase the validity of a study
These sources are likely to be stakeholders in a program - participants, other researchers, program staff, other community members, and so on.
Then we put all data in single framework & apply various statistical tools to find out the dynamic on the market.
During the analysis stage, feedback from the stakeholder groups would be compared to determine areas of agreement as well as areas of divergence
