

Key Insights
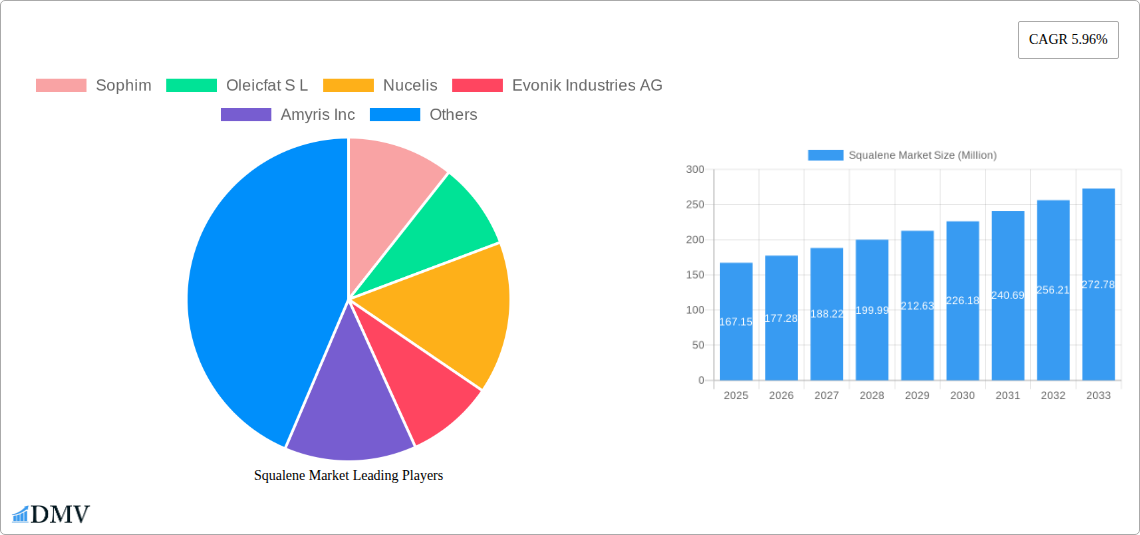
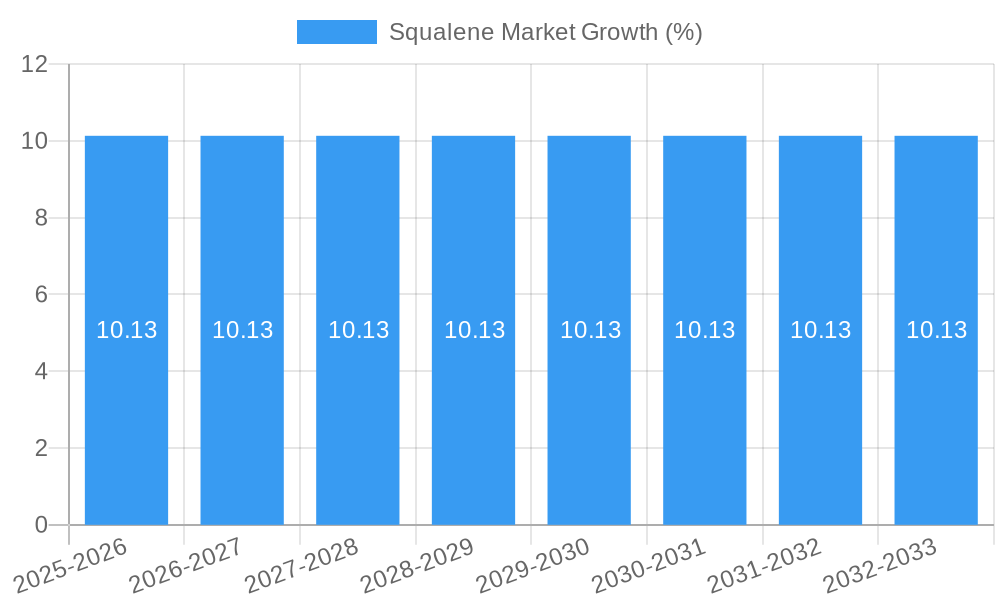
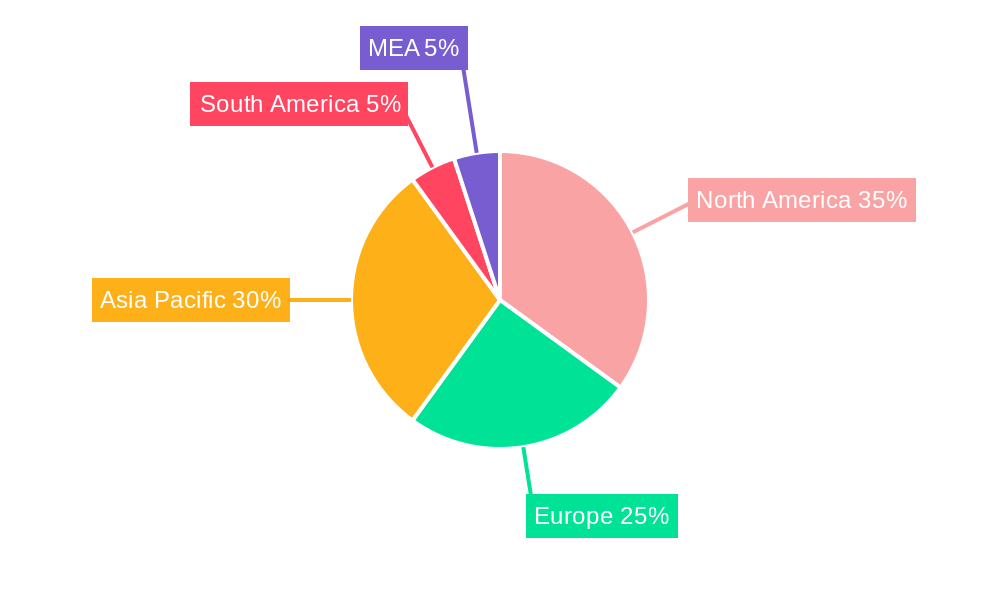
The global squalene market is experiencing robust growth, projected to reach a market size of $167.15 million in 2025 and maintain a Compound Annual Growth Rate (CAGR) of 5.96% from 2025 to 2033. This expansion is fueled by several key drivers. The burgeoning cosmetics industry's increasing demand for natural and effective moisturizing and anti-aging ingredients significantly contributes to squalene's popularity. Furthermore, the growing awareness of squalene's health benefits in food and pharmaceutical applications, particularly as a potent antioxidant and immune system booster, is driving market growth. The diverse sourcing options—animal, vegetable, and biosynthetic—offer manufacturers flexibility and cater to varying consumer preferences and ethical considerations. While the vegetable source segment is expected to dominate due to rising consumer preference for plant-based ingredients and sustainability concerns, the biosynthetic route presents a promising avenue for future growth, offering scalability and consistent quality. However, the market faces challenges such as fluctuating raw material prices and the potential for supply chain disruptions. Despite these restraints, the overall market outlook remains positive, driven by continued innovation in squalene extraction and production techniques, expanding applications across diverse industries, and increased consumer demand for natural, high-quality ingredients. Geographic distribution sees North America and Asia-Pacific as key revenue generators, reflecting robust demand from these regions.
The competitive landscape is characterized by a mix of established players and emerging companies. Key players like Sophim, Evonik Industries AG, and Amyris Inc. are leveraging their expertise and technological advancements to solidify their market positions. The presence of smaller companies focused on niche applications contributes to innovation and market dynamism. Future growth will depend on continued R&D efforts focused on improving production efficiency and exploring new applications of squalene, while also addressing sustainability concerns throughout the supply chain. Strategic partnerships and mergers and acquisitions could play a significant role in shaping the market's future competitive landscape. The increasing focus on traceability and transparency within the supply chain will also be crucial for building consumer trust and facilitating sustainable market expansion.
Squalene Market Report: A Comprehensive Analysis (2019-2033)
This insightful report delivers a comprehensive analysis of the global squalene market, providing stakeholders with critical data and forecasts for informed decision-making. Covering the period from 2019 to 2033, with a focus on 2025, this report meticulously examines market trends, competitive dynamics, and future growth potential. The study period covers 2019-2033, with 2025 as the base and estimated year, and the forecast period spanning 2025-2033. The historical period covered is 2019-2024. The market size is estimated at xx Million in 2025 and is projected to reach xx Million by 2033.
Squalene Market Composition & Trends
This section dives deep into the current state of the squalene market, analyzing its structure and key influencing factors. We evaluate market concentration, identifying major players and their respective market share. Innovation within the squalene market is assessed, examining the role of technological advancements and their impact on product development. The report also provides a detailed overview of the regulatory landscape, including relevant policies and their effects on market growth. Analysis of substitute products and their competitive pressures is included, along with a comprehensive profile of end-user industries such as cosmetics, food, and pharmaceuticals. Furthermore, the report explores M&A activities in the squalene market, including deal values and their strategic implications. Specific data points include:
- Market Concentration: The top 5 players hold approximately xx% of the market share in 2025.
- Innovation Catalysts: Advancements in biotechnology and sustainable sourcing are driving innovation.
- Regulatory Landscape: Stringent regulations regarding animal-derived squalene are shaping market dynamics.
- Substitute Products: Competition from synthetic alternatives is a key factor to consider.
- End-User Profiles: The cosmetics sector represents the largest segment, followed by pharmaceuticals and food.
- M&A Activities: The total value of M&A deals in the period 2019-2024 was approximately xx Million.
Squalene Market Industry Evolution
This section presents a detailed analysis of the squalene market's evolutionary trajectory, examining the historical and projected growth patterns. Growth rates and adoption metrics are provided for key segments. We explore the influence of technological advancements on production methods, including the shift towards sustainable and bio-based squalene sources. The changing consumer preferences, particularly the increasing demand for natural and ethically sourced products, are thoroughly analyzed. We detail the impact of these factors on market size and market share. The analysis covers:
- Market Growth Trajectories: A CAGR of xx% is projected from 2025 to 2033.
- Technological Advancements: The adoption of biosynthetic methods is significantly increasing.
- Shifting Consumer Demands: Growing consumer awareness of sustainable and ethical sourcing is driving market growth.
Leading Regions, Countries, or Segments in Squalene Market
This section identifies the dominant regions, countries, and segments within the squalene market. A detailed analysis is provided for each, exploring the factors contributing to their leadership positions. We focus on the key drivers – investment trends, regulatory support, and market size. The analysis is supported by insightful market share data and projections.
- Dominant Region: North America currently holds the largest market share, driven by strong demand from the cosmetics industry.
- Dominant End-User Industry: The cosmetics industry remains the leading end-user of squalene, driven by its moisturizing and skin-protective properties.
- Dominant Source: The shift towards biosynthetic squalene is gaining momentum, driven by sustainability and ethical concerns.
- Key Drivers for North America: High disposable income, increased awareness of skincare benefits, and strong regulatory support contribute to its market dominance.
- Key Drivers for Biosynthetic Squalene: Growing environmental concerns, ethical considerations associated with shark-derived squalene, and advancements in biotechnology are driving its adoption.
Squalene Market Product Innovations
This section highlights recent product innovations, applications, and performance metrics. The analysis focuses on unique selling propositions and technological advancements. We examine the impact of novel squalene products on the market landscape, including improvements in purity, stability, and cost-effectiveness. The focus is on differentiating features and their market appeal.
Propelling Factors for Squalene Market Growth
Several factors are driving the growth of the squalene market. Technological advancements, specifically in biosynthetic production, are enabling cost-effective and sustainable squalene production. Economic factors such as increasing disposable income and rising consumer spending on health and beauty products are also significant drivers. Moreover, supportive government regulations promoting sustainable practices further boost market expansion.
Obstacles in the Squalene Market
Despite its growth potential, the squalene market faces several obstacles. Regulatory challenges associated with product approval and safety standards can slow down market penetration. Supply chain disruptions, particularly concerning the availability of raw materials, can impact production and pricing. Intense competition among existing players and the emergence of new entrants also present significant challenges.
Future Opportunities in Squalene Market
The future of the squalene market looks promising. Emerging markets in Asia and Africa present significant growth opportunities. Advancements in squalene delivery systems and formulation technologies will further expand its applications. The increasing demand for natural and sustainable products will continue to fuel market growth.
Major Players in the Squalene Market Ecosystem
- Sophim
- Oleicfat S L
- Nucelis
- Evonik Industries AG
- Amyris Inc
- Gracefruit Limited
- Vestan S A
- Arbee
- Efpbiotek
- Kishimoto Special Liver Oil Co Ltd
Key Developments in Squalene Market Industry
- June 2022: Amyris announced the inauguration of the production of 13 molecules, including squalene, at its plant in Brazil. The company also stated that it developed a process to produce sugarcane-derived squalene as an alternative to non-sustainable shark-derived squalene. This significantly impacted the market by introducing a sustainable alternative and increasing production capacity.
- December 2022: Evonik Industries AG launched PhytoSquene, a non-animal-derived squalene suitable for vaccines and other pharmaceutical applications. This launch addressed the growing demand for ethical and secure sourcing of squalene for pharmaceutical use.
- May 2023: Amyris announced its partnership with Croda International Plc (Croda) to supply biotechnology-derived, pharmaceutical-grade squalene used in adjuvants to boost immune responses. This partnership strengthened Amyris's position in the pharmaceutical market and broadened the application of its squalene.
Strategic Squalene Market Forecast
The squalene market is poised for significant growth, driven by the increasing demand for natural and sustainable ingredients in various industries. The continued innovation in biotechnology and the expanding applications of squalene will further propel market expansion. The focus on sustainable sourcing and ethical production will continue to shape market dynamics, creating lucrative opportunities for companies that prioritize these aspects.
Squalene Market Segmentation
-
1. Source
- 1.1. Animal Source
- 1.2. Vegetable Source
- 1.3. Biosynthetic
- 1.4. Other Sources
-
2. End-user Industry
- 2.1. Cosmetics
- 2.2. Food
- 2.3. Pharmaceuticals
- 2.4. Other End-user Industries
Squalene Market Segmentation By Geography
-
1. Asia Pacific
- 1.1. China
- 1.2. India
- 1.3. Japan
- 1.4. South Korea
- 1.5. Malaysia
- 1.6. Thailand
- 1.7. Indonesia
- 1.8. Vietnam
- 1.9. Rest of Asia Pacific
-
2. North America
- 2.1. United States
- 2.2. Canada
- 2.3. Mexico
-
3. Europe
- 3.1. Germany
- 3.2. United Kingdom
- 3.3. France
- 3.4. Italy
- 3.5. Spain
- 3.6. NORDIC Countries
- 3.7. Turkey
- 3.8. Russia
- 3.9. Rest of Europe
-
4. South America
- 4.1. Brazil
- 4.2. Argentina
- 4.3. Colombia
- 4.4. Rest of South America
-
5. Middle East and Africa
- 5.1. Saudi Arabia
- 5.2. Qatar
- 5.3. United Arab Emirates
- 5.4. Nigeria
- 5.5. Egypt
- 5.6. South Africa
- 5.7. Rest of Middle East and Africa
Squalene Market REPORT HIGHLIGHTS
| Aspects | Details |
|---|---|
| Study Period | 2019-2033 |
| Base Year | 2024 |
| Estimated Year | 2025 |
| Forecast Period | 2025-2033 |
| Historical Period | 2019-2024 |
| Growth Rate | CAGR of 5.96% from 2019-2033 |
| Segmentation |
|
Table of Contents
- 1. Introduction
- 1.1. Research Scope
- 1.2. Market Segmentation
- 1.3. Research Methodology
- 1.4. Definitions and Assumptions
- 2. Executive Summary
- 2.1. Introduction
- 3. Market Dynamics
- 3.1. Introduction
- 3.2. Market Drivers
- 3.2.1. Growing Cosmetics Industry; Growing Demand from the Nutraceutical Industry; Growing Consumption in Pharmaceutical Industry
- 3.3. Market Restrains
- 3.3.1. Shark Killing Concerns and Limitations; Other Restraints
- 3.4. Market Trends
- 3.4.1. Cosmetics Industry to Dominate the Market
- 4. Market Factor Analysis
- 4.1. Porters Five Forces
- 4.2. Supply/Value Chain
- 4.3. PESTEL analysis
- 4.4. Market Entropy
- 4.5. Patent/Trademark Analysis
- 5. Global Squalene Market Analysis, Insights and Forecast, 2019-2031
- 5.1. Market Analysis, Insights and Forecast - by Source
- 5.1.1. Animal Source
- 5.1.2. Vegetable Source
- 5.1.3. Biosynthetic
- 5.1.4. Other Sources
- 5.2. Market Analysis, Insights and Forecast - by End-user Industry
- 5.2.1. Cosmetics
- 5.2.2. Food
- 5.2.3. Pharmaceuticals
- 5.2.4. Other End-user Industries
- 5.3. Market Analysis, Insights and Forecast - by Region
- 5.3.1. Asia Pacific
- 5.3.2. North America
- 5.3.3. Europe
- 5.3.4. South America
- 5.3.5. Middle East and Africa
- 5.1. Market Analysis, Insights and Forecast - by Source
- 6. Asia Pacific Squalene Market Analysis, Insights and Forecast, 2019-2031
- 6.1. Market Analysis, Insights and Forecast - by Source
- 6.1.1. Animal Source
- 6.1.2. Vegetable Source
- 6.1.3. Biosynthetic
- 6.1.4. Other Sources
- 6.2. Market Analysis, Insights and Forecast - by End-user Industry
- 6.2.1. Cosmetics
- 6.2.2. Food
- 6.2.3. Pharmaceuticals
- 6.2.4. Other End-user Industries
- 6.1. Market Analysis, Insights and Forecast - by Source
- 7. North America Squalene Market Analysis, Insights and Forecast, 2019-2031
- 7.1. Market Analysis, Insights and Forecast - by Source
- 7.1.1. Animal Source
- 7.1.2. Vegetable Source
- 7.1.3. Biosynthetic
- 7.1.4. Other Sources
- 7.2. Market Analysis, Insights and Forecast - by End-user Industry
- 7.2.1. Cosmetics
- 7.2.2. Food
- 7.2.3. Pharmaceuticals
- 7.2.4. Other End-user Industries
- 7.1. Market Analysis, Insights and Forecast - by Source
- 8. Europe Squalene Market Analysis, Insights and Forecast, 2019-2031
- 8.1. Market Analysis, Insights and Forecast - by Source
- 8.1.1. Animal Source
- 8.1.2. Vegetable Source
- 8.1.3. Biosynthetic
- 8.1.4. Other Sources
- 8.2. Market Analysis, Insights and Forecast - by End-user Industry
- 8.2.1. Cosmetics
- 8.2.2. Food
- 8.2.3. Pharmaceuticals
- 8.2.4. Other End-user Industries
- 8.1. Market Analysis, Insights and Forecast - by Source
- 9. South America Squalene Market Analysis, Insights and Forecast, 2019-2031
- 9.1. Market Analysis, Insights and Forecast - by Source
- 9.1.1. Animal Source
- 9.1.2. Vegetable Source
- 9.1.3. Biosynthetic
- 9.1.4. Other Sources
- 9.2. Market Analysis, Insights and Forecast - by End-user Industry
- 9.2.1. Cosmetics
- 9.2.2. Food
- 9.2.3. Pharmaceuticals
- 9.2.4. Other End-user Industries
- 9.1. Market Analysis, Insights and Forecast - by Source
- 10. Middle East and Africa Squalene Market Analysis, Insights and Forecast, 2019-2031
- 10.1. Market Analysis, Insights and Forecast - by Source
- 10.1.1. Animal Source
- 10.1.2. Vegetable Source
- 10.1.3. Biosynthetic
- 10.1.4. Other Sources
- 10.2. Market Analysis, Insights and Forecast - by End-user Industry
- 10.2.1. Cosmetics
- 10.2.2. Food
- 10.2.3. Pharmaceuticals
- 10.2.4. Other End-user Industries
- 10.1. Market Analysis, Insights and Forecast - by Source
- 11. North America Squalene Market Analysis, Insights and Forecast, 2019-2031
- 11.1. Market Analysis, Insights and Forecast - By Country/Sub-region
- 11.1.1 United States
- 11.1.2 Canada
- 11.1.3 Mexico
- 12. Europe Squalene Market Analysis, Insights and Forecast, 2019-2031
- 12.1. Market Analysis, Insights and Forecast - By Country/Sub-region
- 12.1.1 Germany
- 12.1.2 France
- 12.1.3 Italy
- 12.1.4 United Kingdom
- 12.1.5 Netherlands
- 12.1.6 Rest of Europe
- 13. Asia Pacific Squalene Market Analysis, Insights and Forecast, 2019-2031
- 13.1. Market Analysis, Insights and Forecast - By Country/Sub-region
- 13.1.1 China
- 13.1.2 Japan
- 13.1.3 India
- 13.1.4 South Korea
- 13.1.5 Taiwan
- 13.1.6 Australia
- 13.1.7 Rest of Asia-Pacific
- 14. South America Squalene Market Analysis, Insights and Forecast, 2019-2031
- 14.1. Market Analysis, Insights and Forecast - By Country/Sub-region
- 14.1.1 Brazil
- 14.1.2 Argentina
- 14.1.3 Rest of South America
- 15. MEA Squalene Market Analysis, Insights and Forecast, 2019-2031
- 15.1. Market Analysis, Insights and Forecast - By Country/Sub-region
- 15.1.1 Middle East
- 15.1.2 Africa
- 16. Competitive Analysis
- 16.1. Global Market Share Analysis 2024
- 16.2. Company Profiles
- 16.2.1 Sophim
- 16.2.1.1. Overview
- 16.2.1.2. Products
- 16.2.1.3. SWOT Analysis
- 16.2.1.4. Recent Developments
- 16.2.1.5. Financials (Based on Availability)
- 16.2.2 Oleicfat S L
- 16.2.2.1. Overview
- 16.2.2.2. Products
- 16.2.2.3. SWOT Analysis
- 16.2.2.4. Recent Developments
- 16.2.2.5. Financials (Based on Availability)
- 16.2.3 Nucelis
- 16.2.3.1. Overview
- 16.2.3.2. Products
- 16.2.3.3. SWOT Analysis
- 16.2.3.4. Recent Developments
- 16.2.3.5. Financials (Based on Availability)
- 16.2.4 Evonik Industries AG
- 16.2.4.1. Overview
- 16.2.4.2. Products
- 16.2.4.3. SWOT Analysis
- 16.2.4.4. Recent Developments
- 16.2.4.5. Financials (Based on Availability)
- 16.2.5 Amyris Inc
- 16.2.5.1. Overview
- 16.2.5.2. Products
- 16.2.5.3. SWOT Analysis
- 16.2.5.4. Recent Developments
- 16.2.5.5. Financials (Based on Availability)
- 16.2.6 Gracefruit Limited
- 16.2.6.1. Overview
- 16.2.6.2. Products
- 16.2.6.3. SWOT Analysis
- 16.2.6.4. Recent Developments
- 16.2.6.5. Financials (Based on Availability)
- 16.2.7 Vestan S A
- 16.2.7.1. Overview
- 16.2.7.2. Products
- 16.2.7.3. SWOT Analysis
- 16.2.7.4. Recent Developments
- 16.2.7.5. Financials (Based on Availability)
- 16.2.8 Arbee
- 16.2.8.1. Overview
- 16.2.8.2. Products
- 16.2.8.3. SWOT Analysis
- 16.2.8.4. Recent Developments
- 16.2.8.5. Financials (Based on Availability)
- 16.2.9 Efpbiotek
- 16.2.9.1. Overview
- 16.2.9.2. Products
- 16.2.9.3. SWOT Analysis
- 16.2.9.4. Recent Developments
- 16.2.9.5. Financials (Based on Availability)
- 16.2.10 Kishimoto Special Liver Oil Co Ltd
- 16.2.10.1. Overview
- 16.2.10.2. Products
- 16.2.10.3. SWOT Analysis
- 16.2.10.4. Recent Developments
- 16.2.10.5. Financials (Based on Availability)
- 16.2.1 Sophim
List of Figures
- Figure 1: Global Squalene Market Revenue Breakdown (Million, %) by Region 2024 & 2032
- Figure 2: Global Squalene Market Volume Breakdown (K Tons, %) by Region 2024 & 2032
- Figure 3: North America Squalene Market Revenue (Million), by Country 2024 & 2032
- Figure 4: North America Squalene Market Volume (K Tons), by Country 2024 & 2032
- Figure 5: North America Squalene Market Revenue Share (%), by Country 2024 & 2032
- Figure 6: North America Squalene Market Volume Share (%), by Country 2024 & 2032
- Figure 7: Europe Squalene Market Revenue (Million), by Country 2024 & 2032
- Figure 8: Europe Squalene Market Volume (K Tons), by Country 2024 & 2032
- Figure 9: Europe Squalene Market Revenue Share (%), by Country 2024 & 2032
- Figure 10: Europe Squalene Market Volume Share (%), by Country 2024 & 2032
- Figure 11: Asia Pacific Squalene Market Revenue (Million), by Country 2024 & 2032
- Figure 12: Asia Pacific Squalene Market Volume (K Tons), by Country 2024 & 2032
- Figure 13: Asia Pacific Squalene Market Revenue Share (%), by Country 2024 & 2032
- Figure 14: Asia Pacific Squalene Market Volume Share (%), by Country 2024 & 2032
- Figure 15: South America Squalene Market Revenue (Million), by Country 2024 & 2032
- Figure 16: South America Squalene Market Volume (K Tons), by Country 2024 & 2032
- Figure 17: South America Squalene Market Revenue Share (%), by Country 2024 & 2032
- Figure 18: South America Squalene Market Volume Share (%), by Country 2024 & 2032
- Figure 19: MEA Squalene Market Revenue (Million), by Country 2024 & 2032
- Figure 20: MEA Squalene Market Volume (K Tons), by Country 2024 & 2032
- Figure 21: MEA Squalene Market Revenue Share (%), by Country 2024 & 2032
- Figure 22: MEA Squalene Market Volume Share (%), by Country 2024 & 2032
- Figure 23: Asia Pacific Squalene Market Revenue (Million), by Source 2024 & 2032
- Figure 24: Asia Pacific Squalene Market Volume (K Tons), by Source 2024 & 2032
- Figure 25: Asia Pacific Squalene Market Revenue Share (%), by Source 2024 & 2032
- Figure 26: Asia Pacific Squalene Market Volume Share (%), by Source 2024 & 2032
- Figure 27: Asia Pacific Squalene Market Revenue (Million), by End-user Industry 2024 & 2032
- Figure 28: Asia Pacific Squalene Market Volume (K Tons), by End-user Industry 2024 & 2032
- Figure 29: Asia Pacific Squalene Market Revenue Share (%), by End-user Industry 2024 & 2032
- Figure 30: Asia Pacific Squalene Market Volume Share (%), by End-user Industry 2024 & 2032
- Figure 31: Asia Pacific Squalene Market Revenue (Million), by Country 2024 & 2032
- Figure 32: Asia Pacific Squalene Market Volume (K Tons), by Country 2024 & 2032
- Figure 33: Asia Pacific Squalene Market Revenue Share (%), by Country 2024 & 2032
- Figure 34: Asia Pacific Squalene Market Volume Share (%), by Country 2024 & 2032
- Figure 35: North America Squalene Market Revenue (Million), by Source 2024 & 2032
- Figure 36: North America Squalene Market Volume (K Tons), by Source 2024 & 2032
- Figure 37: North America Squalene Market Revenue Share (%), by Source 2024 & 2032
- Figure 38: North America Squalene Market Volume Share (%), by Source 2024 & 2032
- Figure 39: North America Squalene Market Revenue (Million), by End-user Industry 2024 & 2032
- Figure 40: North America Squalene Market Volume (K Tons), by End-user Industry 2024 & 2032
- Figure 41: North America Squalene Market Revenue Share (%), by End-user Industry 2024 & 2032
- Figure 42: North America Squalene Market Volume Share (%), by End-user Industry 2024 & 2032
- Figure 43: North America Squalene Market Revenue (Million), by Country 2024 & 2032
- Figure 44: North America Squalene Market Volume (K Tons), by Country 2024 & 2032
- Figure 45: North America Squalene Market Revenue Share (%), by Country 2024 & 2032
- Figure 46: North America Squalene Market Volume Share (%), by Country 2024 & 2032
- Figure 47: Europe Squalene Market Revenue (Million), by Source 2024 & 2032
- Figure 48: Europe Squalene Market Volume (K Tons), by Source 2024 & 2032
- Figure 49: Europe Squalene Market Revenue Share (%), by Source 2024 & 2032
- Figure 50: Europe Squalene Market Volume Share (%), by Source 2024 & 2032
- Figure 51: Europe Squalene Market Revenue (Million), by End-user Industry 2024 & 2032
- Figure 52: Europe Squalene Market Volume (K Tons), by End-user Industry 2024 & 2032
- Figure 53: Europe Squalene Market Revenue Share (%), by End-user Industry 2024 & 2032
- Figure 54: Europe Squalene Market Volume Share (%), by End-user Industry 2024 & 2032
- Figure 55: Europe Squalene Market Revenue (Million), by Country 2024 & 2032
- Figure 56: Europe Squalene Market Volume (K Tons), by Country 2024 & 2032
- Figure 57: Europe Squalene Market Revenue Share (%), by Country 2024 & 2032
- Figure 58: Europe Squalene Market Volume Share (%), by Country 2024 & 2032
- Figure 59: South America Squalene Market Revenue (Million), by Source 2024 & 2032
- Figure 60: South America Squalene Market Volume (K Tons), by Source 2024 & 2032
- Figure 61: South America Squalene Market Revenue Share (%), by Source 2024 & 2032
- Figure 62: South America Squalene Market Volume Share (%), by Source 2024 & 2032
- Figure 63: South America Squalene Market Revenue (Million), by End-user Industry 2024 & 2032
- Figure 64: South America Squalene Market Volume (K Tons), by End-user Industry 2024 & 2032
- Figure 65: South America Squalene Market Revenue Share (%), by End-user Industry 2024 & 2032
- Figure 66: South America Squalene Market Volume Share (%), by End-user Industry 2024 & 2032
- Figure 67: South America Squalene Market Revenue (Million), by Country 2024 & 2032
- Figure 68: South America Squalene Market Volume (K Tons), by Country 2024 & 2032
- Figure 69: South America Squalene Market Revenue Share (%), by Country 2024 & 2032
- Figure 70: South America Squalene Market Volume Share (%), by Country 2024 & 2032
- Figure 71: Middle East and Africa Squalene Market Revenue (Million), by Source 2024 & 2032
- Figure 72: Middle East and Africa Squalene Market Volume (K Tons), by Source 2024 & 2032
- Figure 73: Middle East and Africa Squalene Market Revenue Share (%), by Source 2024 & 2032
- Figure 74: Middle East and Africa Squalene Market Volume Share (%), by Source 2024 & 2032
- Figure 75: Middle East and Africa Squalene Market Revenue (Million), by End-user Industry 2024 & 2032
- Figure 76: Middle East and Africa Squalene Market Volume (K Tons), by End-user Industry 2024 & 2032
- Figure 77: Middle East and Africa Squalene Market Revenue Share (%), by End-user Industry 2024 & 2032
- Figure 78: Middle East and Africa Squalene Market Volume Share (%), by End-user Industry 2024 & 2032
- Figure 79: Middle East and Africa Squalene Market Revenue (Million), by Country 2024 & 2032
- Figure 80: Middle East and Africa Squalene Market Volume (K Tons), by Country 2024 & 2032
- Figure 81: Middle East and Africa Squalene Market Revenue Share (%), by Country 2024 & 2032
- Figure 82: Middle East and Africa Squalene Market Volume Share (%), by Country 2024 & 2032
List of Tables
- Table 1: Global Squalene Market Revenue Million Forecast, by Region 2019 & 2032
- Table 2: Global Squalene Market Volume K Tons Forecast, by Region 2019 & 2032
- Table 3: Global Squalene Market Revenue Million Forecast, by Source 2019 & 2032
- Table 4: Global Squalene Market Volume K Tons Forecast, by Source 2019 & 2032
- Table 5: Global Squalene Market Revenue Million Forecast, by End-user Industry 2019 & 2032
- Table 6: Global Squalene Market Volume K Tons Forecast, by End-user Industry 2019 & 2032
- Table 7: Global Squalene Market Revenue Million Forecast, by Region 2019 & 2032
- Table 8: Global Squalene Market Volume K Tons Forecast, by Region 2019 & 2032
- Table 9: Global Squalene Market Revenue Million Forecast, by Country 2019 & 2032
- Table 10: Global Squalene Market Volume K Tons Forecast, by Country 2019 & 2032
- Table 11: United States Squalene Market Revenue (Million) Forecast, by Application 2019 & 2032
- Table 12: United States Squalene Market Volume (K Tons) Forecast, by Application 2019 & 2032
- Table 13: Canada Squalene Market Revenue (Million) Forecast, by Application 2019 & 2032
- Table 14: Canada Squalene Market Volume (K Tons) Forecast, by Application 2019 & 2032
- Table 15: Mexico Squalene Market Revenue (Million) Forecast, by Application 2019 & 2032
- Table 16: Mexico Squalene Market Volume (K Tons) Forecast, by Application 2019 & 2032
- Table 17: Global Squalene Market Revenue Million Forecast, by Country 2019 & 2032
- Table 18: Global Squalene Market Volume K Tons Forecast, by Country 2019 & 2032
- Table 19: Germany Squalene Market Revenue (Million) Forecast, by Application 2019 & 2032
- Table 20: Germany Squalene Market Volume (K Tons) Forecast, by Application 2019 & 2032
- Table 21: France Squalene Market Revenue (Million) Forecast, by Application 2019 & 2032
- Table 22: France Squalene Market Volume (K Tons) Forecast, by Application 2019 & 2032
- Table 23: Italy Squalene Market Revenue (Million) Forecast, by Application 2019 & 2032
- Table 24: Italy Squalene Market Volume (K Tons) Forecast, by Application 2019 & 2032
- Table 25: United Kingdom Squalene Market Revenue (Million) Forecast, by Application 2019 & 2032
- Table 26: United Kingdom Squalene Market Volume (K Tons) Forecast, by Application 2019 & 2032
- Table 27: Netherlands Squalene Market Revenue (Million) Forecast, by Application 2019 & 2032
- Table 28: Netherlands Squalene Market Volume (K Tons) Forecast, by Application 2019 & 2032
- Table 29: Rest of Europe Squalene Market Revenue (Million) Forecast, by Application 2019 & 2032
- Table 30: Rest of Europe Squalene Market Volume (K Tons) Forecast, by Application 2019 & 2032
- Table 31: Global Squalene Market Revenue Million Forecast, by Country 2019 & 2032
- Table 32: Global Squalene Market Volume K Tons Forecast, by Country 2019 & 2032
- Table 33: China Squalene Market Revenue (Million) Forecast, by Application 2019 & 2032
- Table 34: China Squalene Market Volume (K Tons) Forecast, by Application 2019 & 2032
- Table 35: Japan Squalene Market Revenue (Million) Forecast, by Application 2019 & 2032
- Table 36: Japan Squalene Market Volume (K Tons) Forecast, by Application 2019 & 2032
- Table 37: India Squalene Market Revenue (Million) Forecast, by Application 2019 & 2032
- Table 38: India Squalene Market Volume (K Tons) Forecast, by Application 2019 & 2032
- Table 39: South Korea Squalene Market Revenue (Million) Forecast, by Application 2019 & 2032
- Table 40: South Korea Squalene Market Volume (K Tons) Forecast, by Application 2019 & 2032
- Table 41: Taiwan Squalene Market Revenue (Million) Forecast, by Application 2019 & 2032
- Table 42: Taiwan Squalene Market Volume (K Tons) Forecast, by Application 2019 & 2032
- Table 43: Australia Squalene Market Revenue (Million) Forecast, by Application 2019 & 2032
- Table 44: Australia Squalene Market Volume (K Tons) Forecast, by Application 2019 & 2032
- Table 45: Rest of Asia-Pacific Squalene Market Revenue (Million) Forecast, by Application 2019 & 2032
- Table 46: Rest of Asia-Pacific Squalene Market Volume (K Tons) Forecast, by Application 2019 & 2032
- Table 47: Global Squalene Market Revenue Million Forecast, by Country 2019 & 2032
- Table 48: Global Squalene Market Volume K Tons Forecast, by Country 2019 & 2032
- Table 49: Brazil Squalene Market Revenue (Million) Forecast, by Application 2019 & 2032
- Table 50: Brazil Squalene Market Volume (K Tons) Forecast, by Application 2019 & 2032
- Table 51: Argentina Squalene Market Revenue (Million) Forecast, by Application 2019 & 2032
- Table 52: Argentina Squalene Market Volume (K Tons) Forecast, by Application 2019 & 2032
- Table 53: Rest of South America Squalene Market Revenue (Million) Forecast, by Application 2019 & 2032
- Table 54: Rest of South America Squalene Market Volume (K Tons) Forecast, by Application 2019 & 2032
- Table 55: Global Squalene Market Revenue Million Forecast, by Country 2019 & 2032
- Table 56: Global Squalene Market Volume K Tons Forecast, by Country 2019 & 2032
- Table 57: Middle East Squalene Market Revenue (Million) Forecast, by Application 2019 & 2032
- Table 58: Middle East Squalene Market Volume (K Tons) Forecast, by Application 2019 & 2032
- Table 59: Africa Squalene Market Revenue (Million) Forecast, by Application 2019 & 2032
- Table 60: Africa Squalene Market Volume (K Tons) Forecast, by Application 2019 & 2032
- Table 61: Global Squalene Market Revenue Million Forecast, by Source 2019 & 2032
- Table 62: Global Squalene Market Volume K Tons Forecast, by Source 2019 & 2032
- Table 63: Global Squalene Market Revenue Million Forecast, by End-user Industry 2019 & 2032
- Table 64: Global Squalene Market Volume K Tons Forecast, by End-user Industry 2019 & 2032
- Table 65: Global Squalene Market Revenue Million Forecast, by Country 2019 & 2032
- Table 66: Global Squalene Market Volume K Tons Forecast, by Country 2019 & 2032
- Table 67: China Squalene Market Revenue (Million) Forecast, by Application 2019 & 2032
- Table 68: China Squalene Market Volume (K Tons) Forecast, by Application 2019 & 2032
- Table 69: India Squalene Market Revenue (Million) Forecast, by Application 2019 & 2032
- Table 70: India Squalene Market Volume (K Tons) Forecast, by Application 2019 & 2032
- Table 71: Japan Squalene Market Revenue (Million) Forecast, by Application 2019 & 2032
- Table 72: Japan Squalene Market Volume (K Tons) Forecast, by Application 2019 & 2032
- Table 73: South Korea Squalene Market Revenue (Million) Forecast, by Application 2019 & 2032
- Table 74: South Korea Squalene Market Volume (K Tons) Forecast, by Application 2019 & 2032
- Table 75: Malaysia Squalene Market Revenue (Million) Forecast, by Application 2019 & 2032
- Table 76: Malaysia Squalene Market Volume (K Tons) Forecast, by Application 2019 & 2032
- Table 77: Thailand Squalene Market Revenue (Million) Forecast, by Application 2019 & 2032
- Table 78: Thailand Squalene Market Volume (K Tons) Forecast, by Application 2019 & 2032
- Table 79: Indonesia Squalene Market Revenue (Million) Forecast, by Application 2019 & 2032
- Table 80: Indonesia Squalene Market Volume (K Tons) Forecast, by Application 2019 & 2032
- Table 81: Vietnam Squalene Market Revenue (Million) Forecast, by Application 2019 & 2032
- Table 82: Vietnam Squalene Market Volume (K Tons) Forecast, by Application 2019 & 2032
- Table 83: Rest of Asia Pacific Squalene Market Revenue (Million) Forecast, by Application 2019 & 2032
- Table 84: Rest of Asia Pacific Squalene Market Volume (K Tons) Forecast, by Application 2019 & 2032
- Table 85: Global Squalene Market Revenue Million Forecast, by Source 2019 & 2032
- Table 86: Global Squalene Market Volume K Tons Forecast, by Source 2019 & 2032
- Table 87: Global Squalene Market Revenue Million Forecast, by End-user Industry 2019 & 2032
- Table 88: Global Squalene Market Volume K Tons Forecast, by End-user Industry 2019 & 2032
- Table 89: Global Squalene Market Revenue Million Forecast, by Country 2019 & 2032
- Table 90: Global Squalene Market Volume K Tons Forecast, by Country 2019 & 2032
- Table 91: United States Squalene Market Revenue (Million) Forecast, by Application 2019 & 2032
- Table 92: United States Squalene Market Volume (K Tons) Forecast, by Application 2019 & 2032
- Table 93: Canada Squalene Market Revenue (Million) Forecast, by Application 2019 & 2032
- Table 94: Canada Squalene Market Volume (K Tons) Forecast, by Application 2019 & 2032
- Table 95: Mexico Squalene Market Revenue (Million) Forecast, by Application 2019 & 2032
- Table 96: Mexico Squalene Market Volume (K Tons) Forecast, by Application 2019 & 2032
- Table 97: Global Squalene Market Revenue Million Forecast, by Source 2019 & 2032
- Table 98: Global Squalene Market Volume K Tons Forecast, by Source 2019 & 2032
- Table 99: Global Squalene Market Revenue Million Forecast, by End-user Industry 2019 & 2032
- Table 100: Global Squalene Market Volume K Tons Forecast, by End-user Industry 2019 & 2032
- Table 101: Global Squalene Market Revenue Million Forecast, by Country 2019 & 2032
- Table 102: Global Squalene Market Volume K Tons Forecast, by Country 2019 & 2032
- Table 103: Germany Squalene Market Revenue (Million) Forecast, by Application 2019 & 2032
- Table 104: Germany Squalene Market Volume (K Tons) Forecast, by Application 2019 & 2032
- Table 105: United Kingdom Squalene Market Revenue (Million) Forecast, by Application 2019 & 2032
- Table 106: United Kingdom Squalene Market Volume (K Tons) Forecast, by Application 2019 & 2032
- Table 107: France Squalene Market Revenue (Million) Forecast, by Application 2019 & 2032
- Table 108: France Squalene Market Volume (K Tons) Forecast, by Application 2019 & 2032
- Table 109: Italy Squalene Market Revenue (Million) Forecast, by Application 2019 & 2032
- Table 110: Italy Squalene Market Volume (K Tons) Forecast, by Application 2019 & 2032
- Table 111: Spain Squalene Market Revenue (Million) Forecast, by Application 2019 & 2032
- Table 112: Spain Squalene Market Volume (K Tons) Forecast, by Application 2019 & 2032
- Table 113: NORDIC Countries Squalene Market Revenue (Million) Forecast, by Application 2019 & 2032
- Table 114: NORDIC Countries Squalene Market Volume (K Tons) Forecast, by Application 2019 & 2032
- Table 115: Turkey Squalene Market Revenue (Million) Forecast, by Application 2019 & 2032
- Table 116: Turkey Squalene Market Volume (K Tons) Forecast, by Application 2019 & 2032
- Table 117: Russia Squalene Market Revenue (Million) Forecast, by Application 2019 & 2032
- Table 118: Russia Squalene Market Volume (K Tons) Forecast, by Application 2019 & 2032
- Table 119: Rest of Europe Squalene Market Revenue (Million) Forecast, by Application 2019 & 2032
- Table 120: Rest of Europe Squalene Market Volume (K Tons) Forecast, by Application 2019 & 2032
- Table 121: Global Squalene Market Revenue Million Forecast, by Source 2019 & 2032
- Table 122: Global Squalene Market Volume K Tons Forecast, by Source 2019 & 2032
- Table 123: Global Squalene Market Revenue Million Forecast, by End-user Industry 2019 & 2032
- Table 124: Global Squalene Market Volume K Tons Forecast, by End-user Industry 2019 & 2032
- Table 125: Global Squalene Market Revenue Million Forecast, by Country 2019 & 2032
- Table 126: Global Squalene Market Volume K Tons Forecast, by Country 2019 & 2032
- Table 127: Brazil Squalene Market Revenue (Million) Forecast, by Application 2019 & 2032
- Table 128: Brazil Squalene Market Volume (K Tons) Forecast, by Application 2019 & 2032
- Table 129: Argentina Squalene Market Revenue (Million) Forecast, by Application 2019 & 2032
- Table 130: Argentina Squalene Market Volume (K Tons) Forecast, by Application 2019 & 2032
- Table 131: Colombia Squalene Market Revenue (Million) Forecast, by Application 2019 & 2032
- Table 132: Colombia Squalene Market Volume (K Tons) Forecast, by Application 2019 & 2032
- Table 133: Rest of South America Squalene Market Revenue (Million) Forecast, by Application 2019 & 2032
- Table 134: Rest of South America Squalene Market Volume (K Tons) Forecast, by Application 2019 & 2032
- Table 135: Global Squalene Market Revenue Million Forecast, by Source 2019 & 2032
- Table 136: Global Squalene Market Volume K Tons Forecast, by Source 2019 & 2032
- Table 137: Global Squalene Market Revenue Million Forecast, by End-user Industry 2019 & 2032
- Table 138: Global Squalene Market Volume K Tons Forecast, by End-user Industry 2019 & 2032
- Table 139: Global Squalene Market Revenue Million Forecast, by Country 2019 & 2032
- Table 140: Global Squalene Market Volume K Tons Forecast, by Country 2019 & 2032
- Table 141: Saudi Arabia Squalene Market Revenue (Million) Forecast, by Application 2019 & 2032
- Table 142: Saudi Arabia Squalene Market Volume (K Tons) Forecast, by Application 2019 & 2032
- Table 143: Qatar Squalene Market Revenue (Million) Forecast, by Application 2019 & 2032
- Table 144: Qatar Squalene Market Volume (K Tons) Forecast, by Application 2019 & 2032
- Table 145: United Arab Emirates Squalene Market Revenue (Million) Forecast, by Application 2019 & 2032
- Table 146: United Arab Emirates Squalene Market Volume (K Tons) Forecast, by Application 2019 & 2032
- Table 147: Nigeria Squalene Market Revenue (Million) Forecast, by Application 2019 & 2032
- Table 148: Nigeria Squalene Market Volume (K Tons) Forecast, by Application 2019 & 2032
- Table 149: Egypt Squalene Market Revenue (Million) Forecast, by Application 2019 & 2032
- Table 150: Egypt Squalene Market Volume (K Tons) Forecast, by Application 2019 & 2032
- Table 151: South Africa Squalene Market Revenue (Million) Forecast, by Application 2019 & 2032
- Table 152: South Africa Squalene Market Volume (K Tons) Forecast, by Application 2019 & 2032
- Table 153: Rest of Middle East and Africa Squalene Market Revenue (Million) Forecast, by Application 2019 & 2032
- Table 154: Rest of Middle East and Africa Squalene Market Volume (K Tons) Forecast, by Application 2019 & 2032
Frequently Asked Questions
1. What is the projected Compound Annual Growth Rate (CAGR) of the Squalene Market?
The projected CAGR is approximately 5.96%.
2. Which companies are prominent players in the Squalene Market?
Key companies in the market include Sophim, Oleicfat S L, Nucelis, Evonik Industries AG, Amyris Inc, Gracefruit Limited, Vestan S A, Arbee, Efpbiotek, Kishimoto Special Liver Oil Co Ltd.
3. What are the main segments of the Squalene Market?
The market segments include Source, End-user Industry.
4. Can you provide details about the market size?
The market size is estimated to be USD 167.15 Million as of 2022.
5. What are some drivers contributing to market growth?
Growing Cosmetics Industry; Growing Demand from the Nutraceutical Industry; Growing Consumption in Pharmaceutical Industry.
6. What are the notable trends driving market growth?
Cosmetics Industry to Dominate the Market.
7. Are there any restraints impacting market growth?
Shark Killing Concerns and Limitations; Other Restraints.
8. Can you provide examples of recent developments in the market?
May 2023: Amyris announced its partnership with Croda International Plc (Croda) to supply biotechnology-derived, pharmaceutical-grade squalene used in adjuvants to boost immune responses.
9. What pricing options are available for accessing the report?
Pricing options include single-user, multi-user, and enterprise licenses priced at USD 4750, USD 5250, and USD 8750 respectively.
10. Is the market size provided in terms of value or volume?
The market size is provided in terms of value, measured in Million and volume, measured in K Tons.
11. Are there any specific market keywords associated with the report?
Yes, the market keyword associated with the report is "Squalene Market," which aids in identifying and referencing the specific market segment covered.
12. How do I determine which pricing option suits my needs best?
The pricing options vary based on user requirements and access needs. Individual users may opt for single-user licenses, while businesses requiring broader access may choose multi-user or enterprise licenses for cost-effective access to the report.
13. Are there any additional resources or data provided in the Squalene Market report?
While the report offers comprehensive insights, it's advisable to review the specific contents or supplementary materials provided to ascertain if additional resources or data are available.
14. How can I stay updated on further developments or reports in the Squalene Market?
To stay informed about further developments, trends, and reports in the Squalene Market, consider subscribing to industry newsletters, following relevant companies and organizations, or regularly checking reputable industry news sources and publications.
Methodology
Step 1 - Identification of Relevant Samples Size from Population Database


Step 2 - Approaches for Defining Global Market Size (Value, Volume* & Price*)

Note*: In applicable scenarios
Step 3 - Data Sources
Primary Research
- Web Analytics
- Survey Reports
- Research Institute
- Latest Research Reports
- Opinion Leaders
Secondary Research
- Annual Reports
- White Paper
- Latest Press Release
- Industry Association
- Paid Database
- Investor Presentations

Step 4 - Data Triangulation
Involves using different sources of information in order to increase the validity of a study
These sources are likely to be stakeholders in a program - participants, other researchers, program staff, other community members, and so on.
Then we put all data in single framework & apply various statistical tools to find out the dynamic on the market.
During the analysis stage, feedback from the stakeholder groups would be compared to determine areas of agreement as well as areas of divergence
