

Key Insights
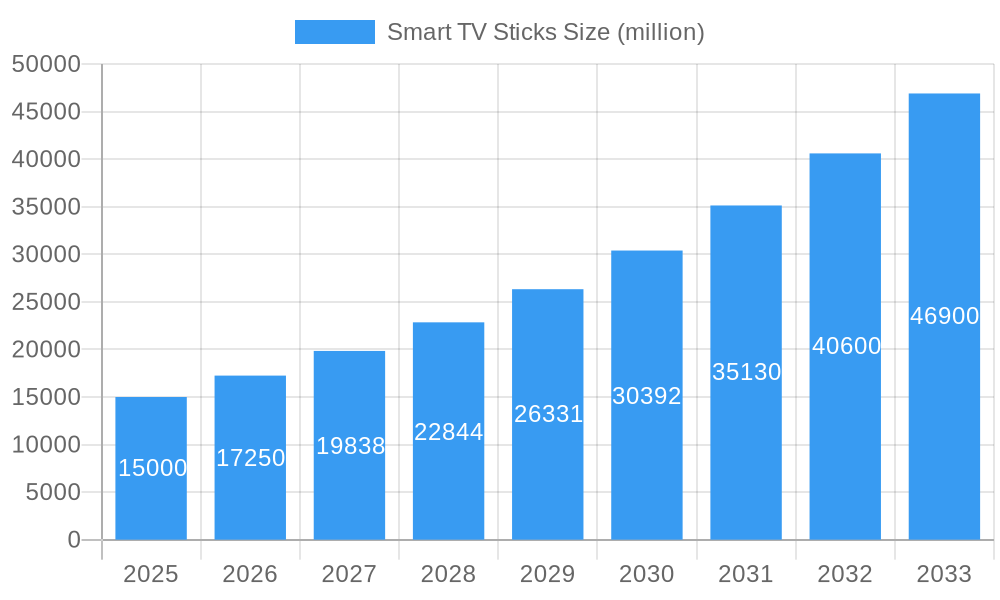
The global smart TV stick market is experiencing robust growth, driven by increasing demand for affordable streaming solutions and the proliferation of over-the-top (OTT) content platforms. The market, estimated at $15 billion in 2025, is projected to exhibit a Compound Annual Growth Rate (CAGR) of 15% from 2025 to 2033, reaching approximately $45 billion by 2033. This expansion is fueled by several key factors: the rising adoption of smart TVs and connected devices, the increasing availability of high-speed internet, and the growing popularity of streaming services like Netflix, Amazon Prime Video, and Disney+. Consumers are increasingly opting for the convenience and affordability of smart TV sticks over purchasing expensive smart TVs, particularly in emerging markets. The market is segmented by various factors including resolution (e.g., HD, 4K, 8K), operating system (e.g., Android TV, Roku OS), and price point, creating diverse options catering to a wide range of consumer needs and budgets. Key players like Roku, Amazon (Fire Stick), and Google (Chromecast) are constantly innovating to enhance user experience, adding features like voice control and enhanced streaming capabilities.
Smart TV Sticks Market Size (In Billion)
Despite the positive market outlook, certain challenges persist. Competition among established players and new entrants is intensifying, leading to price wars and requiring continuous innovation. Furthermore, reliance on stable internet connectivity remains a barrier, particularly in regions with limited infrastructure. The increasing popularity of integrated smart TV functionalities directly in televisions could also potentially curb the market growth, albeit not significantly in the near to mid-term. However, the overall market trend suggests significant expansion fueled by continuous technological advancements, the affordability of smart TV sticks, and the ever-growing appetite for convenient and cost-effective streaming entertainment. The strategic partnerships between content providers and smart TV stick manufacturers further strengthen the market's growth trajectory.
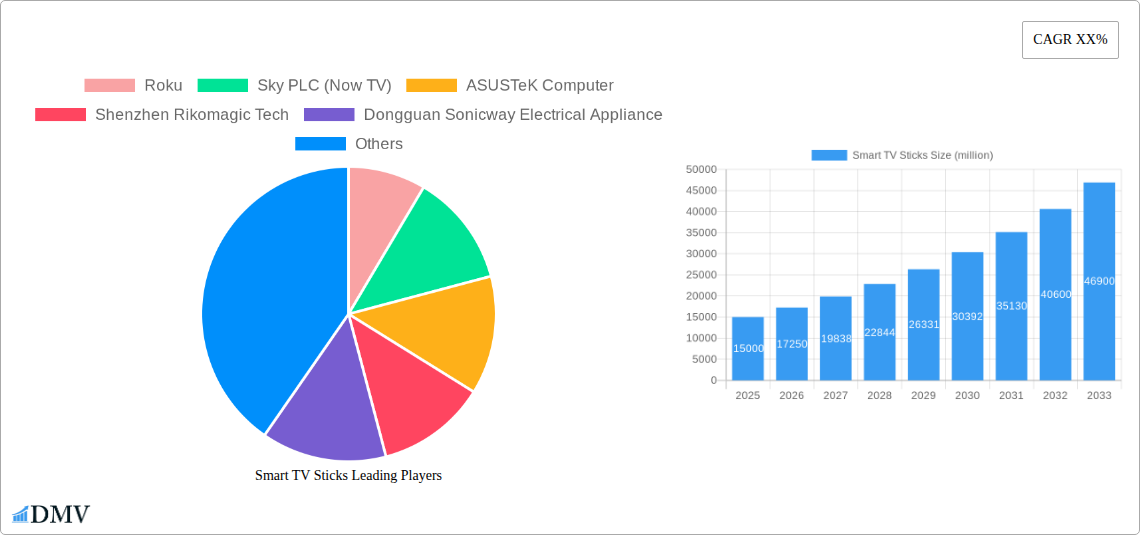
Smart TV Sticks Company Market Share
Smart TV Sticks Market Report: A Comprehensive Analysis (2019-2033)
This insightful report provides a comprehensive analysis of the global Smart TV Sticks market, projecting a market value exceeding $XX million by 2033. The study period covers 2019-2033, with 2025 as the base and estimated year. The forecast period spans 2025-2033, and the historical period encompasses 2019-2024. This report is crucial for stakeholders seeking to understand market dynamics, technological advancements, and future opportunities in this rapidly evolving sector. Key players like Roku, Sky PLC (Now TV), ASUSTeK Computer, and others are analyzed, offering strategic insights for investment and growth.
Smart TV Sticks Market Composition & Trends
The global Smart TV Sticks market exhibits a moderately consolidated structure, with a few major players holding significant market share. Roku, for instance, commands an estimated XX% market share in 2025, while Sky PLC (Now TV) holds approximately XX%. The remaining share is distributed among numerous smaller players, including Shenzhen Rikomagic Tech, Dongguan Sonicway Electrical Appliance, Shenzhen Tomato Technology, and CloudWalker Streaming Technologies. Market concentration is expected to remain relatively stable throughout the forecast period, although strategic acquisitions and technological innovations may slightly alter the competitive landscape.
Innovation is a key driver, with companies continually enhancing streaming capabilities, integrating voice assistants, and improving user interfaces. Regulatory landscapes vary across regions, impacting market access and compliance requirements. Substitute products include smart TVs with built-in streaming capabilities, impacting the overall growth of the Smart TV stick market. The primary end-users are households seeking affordable access to streaming services, supplemented by businesses utilizing Smart TV sticks for digital signage and entertainment purposes. M&A activity has been relatively modest in recent years, with total deal values estimated at $XX million during the historical period, primarily driven by smaller players consolidating their position in niche markets.
- Market Share Distribution (2025): Roku (XX%), Sky PLC (Now TV) (XX%), Others (XX%)
- M&A Deal Value (2019-2024): $XX million
- Key Innovation Drivers: Enhanced streaming capabilities, voice assistant integration, improved user interfaces.
Smart TV Sticks Industry Evolution
The Smart TV Sticks market has experienced significant growth during the historical period (2019-2024), driven by increasing internet penetration, affordable pricing, and the rise of streaming services. Annual growth rates averaged approximately XX% during this period. This trajectory is projected to continue, albeit at a slightly moderated pace, throughout the forecast period (2025-2033). Technological advancements, such as higher processing power, improved Wi-Fi capabilities, and 4K resolution support, are driving higher adoption rates. Consumer demand is shifting towards devices with enhanced features, seamless integration with smart home ecosystems, and robust security features. The market is witnessing a gradual shift towards premium-priced sticks with improved functionalities and better hardware. Market saturation in developed regions might lead to slower growth in these areas compared to developing markets with greater potential for penetration. Adoption metrics indicate a substantial increase in household penetration, particularly in regions with high smartphone and internet usage. The global adoption rate for Smart TV Sticks is expected to reach XX% by 2033.
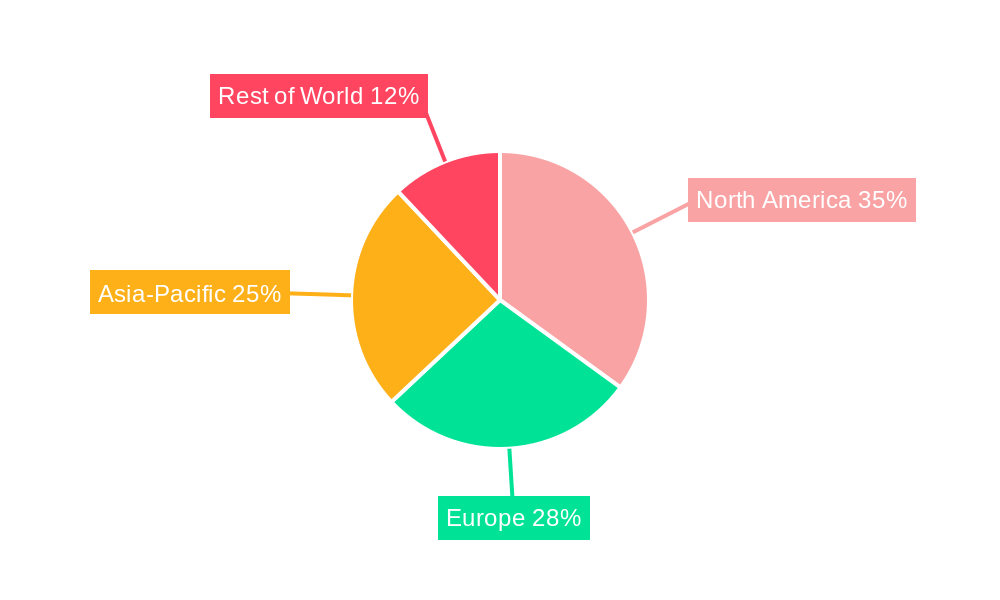
Leading Regions, Countries, or Segments in Smart TV Sticks
North America currently dominates the Smart TV Sticks market, accounting for approximately XX% of global sales in 2025. This dominance is attributed to high internet penetration, strong consumer spending power, and early adoption of streaming services.
- Key Drivers for North American Dominance:
- High internet penetration and smartphone usage.
- Strong consumer spending power and willingness to adopt new technologies.
- Established streaming service ecosystem.
- Favorable regulatory environment.
- Significant investments in technological advancements.
Europe and Asia-Pacific follow, exhibiting substantial growth potential, especially in emerging economies. The market segments are primarily driven by the consumer segment's demand for affordability and accessibility to various entertainment and streaming options. Growth in specific countries like India and Brazil is projected to increase exponentially in coming years due to their massive population size. Government initiatives focused on improving digital infrastructure further accelerate market growth in these regions. The diverse technological landscapes within regions also play a key role in shaping growth, including the adoption rate of 4K and 8K resolution displays.
Smart TV Sticks Product Innovations
Recent product innovations focus on enhanced processing power for smoother 4K streaming, improved Wi-Fi 6 support for faster connectivity, and voice-activated remote controls for intuitive user experience. Many devices are integrating advanced features like HDR support for enhanced visuals, Dolby Atmos for immersive audio, and enhanced security protocols for user data protection. Unique selling propositions often include superior streaming quality, broader app compatibility, and seamless integration with existing smart home ecosystems. These technological advancements are driving market growth and boosting consumer demand for superior Smart TV Sticks.
Propelling Factors for Smart TV Sticks Growth
Several factors contribute to the growth of the Smart TV Sticks market. Technological advancements like improved streaming capabilities and enhanced user interfaces create a strong pull among consumers. Economic factors, such as the increasing affordability of Smart TV Sticks and the rising popularity of subscription-based streaming services, also significantly impact growth. Furthermore, supportive regulatory environments in several regions, particularly concerning internet accessibility and digital content distribution, fuel market expansion. The growing availability of high-speed internet is another critical factor. The rise of affordable, high-quality streaming services is another major factor.
Obstacles in the Smart TV Sticks Market
The Smart TV Sticks market faces several challenges. Regulatory hurdles related to content licensing and digital rights management can constrain growth in certain regions. Supply chain disruptions, particularly concerning crucial components like processors and memory chips, can impact production capacity and availability. Intense competition among manufacturers, especially in the lower-priced segment, leads to price wars and squeezed profit margins. These issues, along with the high dependence on the robustness of third-party streaming services for performance and reliability, present considerable headwinds for market expansion. Furthermore, the evolution of embedded streaming capabilities in the majority of smart TVs is a significant long-term factor.
Future Opportunities in Smart TV Sticks
Emerging opportunities exist in expanding into untapped markets with limited internet penetration. Technological innovations like support for next-generation streaming protocols and integration with augmented reality (AR) and virtual reality (VR) applications will create new market segments. Emerging consumer trends towards personalized content and user-generated content may drive further innovation and product diversification. The increasing demand for seamless cross-device compatibility will also spur development. The integration of smart home and IoT devices is another key area of opportunity.
Major Players in the Smart TV Sticks Ecosystem
- Roku
- Sky PLC (Now TV)
- ASUSTeK Computer
- Shenzhen Rikomagic Tech
- Dongguan Sonicway Electrical Appliance
- Shenzhen Tomato Technology
- CloudWalker Streaming Technologies
Key Developments in Smart TV Sticks Industry
- 2022 Q4: Roku launched its new 4K streaming stick with enhanced processing power and voice control.
- 2023 Q1: Amazon announced its enhanced Fire TV Stick with improved Wi-Fi capabilities.
- 2023 Q2: Google unveiled its new Chromecast with Google TV, showcasing enhanced user experience.
- 2024 Q3: Sky PLC made various strategic partnerships.
- 2025 Q1: ASUSTeK Computer entered the market with its innovative device.
Strategic Smart TV Sticks Market Forecast
The Smart TV Sticks market is poised for continued growth driven by technological innovation, increasing affordability, and the expansion of streaming services. While competition remains intense, companies focusing on differentiated product features, strong branding, and strategic partnerships will capture the greatest market share. The market will witness a shift toward premium products with enhanced features and seamless integration with smart home ecosystems. The penetration of the market in developing countries presents immense potential for growth throughout the forecast period. The focus on high-quality streaming experience will also impact the adoption rate, driving further growth in sales and revenue.
Smart TV Sticks Segmentation
-
1. Application
- 1.1. Household
- 1.2. Commercial
-
2. Types
- 2.1. Non-4K
- 2.2. 4K and Above
Smart TV Sticks Segmentation By Geography
-
1. North America
- 1.1. United States
- 1.2. Canada
- 1.3. Mexico
-
2. South America
- 2.1. Brazil
- 2.2. Argentina
- 2.3. Rest of South America
-
3. Europe
- 3.1. United Kingdom
- 3.2. Germany
- 3.3. France
- 3.4. Italy
- 3.5. Spain
- 3.6. Russia
- 3.7. Benelux
- 3.8. Nordics
- 3.9. Rest of Europe
-
4. Middle East & Africa
- 4.1. Turkey
- 4.2. Israel
- 4.3. GCC
- 4.4. North Africa
- 4.5. South Africa
- 4.6. Rest of Middle East & Africa
-
5. Asia Pacific
- 5.1. China
- 5.2. India
- 5.3. Japan
- 5.4. South Korea
- 5.5. ASEAN
- 5.6. Oceania
- 5.7. Rest of Asia Pacific
Smart TV Sticks Regional Market Share
Geographic Coverage of Smart TV Sticks
Smart TV Sticks REPORT HIGHLIGHTS
| Aspects | Details |
|---|---|
| Study Period | 2020-2034 |
| Base Year | 2025 |
| Estimated Year | 2026 |
| Forecast Period | 2026-2034 |
| Historical Period | 2020-2025 |
| Growth Rate | CAGR of XX% from 2020-2034 |
| Segmentation |
|
Table of Contents
- 1. Introduction
- 1.1. Research Scope
- 1.2. Market Segmentation
- 1.3. Research Methodology
- 1.4. Definitions and Assumptions
- 2. Executive Summary
- 2.1. Introduction
- 3. Market Dynamics
- 3.1. Introduction
- 3.2. Market Drivers
- 3.3. Market Restrains
- 3.4. Market Trends
- 4. Market Factor Analysis
- 4.1. Porters Five Forces
- 4.2. Supply/Value Chain
- 4.3. PESTEL analysis
- 4.4. Market Entropy
- 4.5. Patent/Trademark Analysis
- 5. Global Smart TV Sticks Analysis, Insights and Forecast, 2020-2032
- 5.1. Market Analysis, Insights and Forecast - by Application
- 5.1.1. Household
- 5.1.2. Commercial
- 5.2. Market Analysis, Insights and Forecast - by Types
- 5.2.1. Non-4K
- 5.2.2. 4K and Above
- 5.3. Market Analysis, Insights and Forecast - by Region
- 5.3.1. North America
- 5.3.2. South America
- 5.3.3. Europe
- 5.3.4. Middle East & Africa
- 5.3.5. Asia Pacific
- 5.1. Market Analysis, Insights and Forecast - by Application
- 6. North America Smart TV Sticks Analysis, Insights and Forecast, 2020-2032
- 6.1. Market Analysis, Insights and Forecast - by Application
- 6.1.1. Household
- 6.1.2. Commercial
- 6.2. Market Analysis, Insights and Forecast - by Types
- 6.2.1. Non-4K
- 6.2.2. 4K and Above
- 6.1. Market Analysis, Insights and Forecast - by Application
- 7. South America Smart TV Sticks Analysis, Insights and Forecast, 2020-2032
- 7.1. Market Analysis, Insights and Forecast - by Application
- 7.1.1. Household
- 7.1.2. Commercial
- 7.2. Market Analysis, Insights and Forecast - by Types
- 7.2.1. Non-4K
- 7.2.2. 4K and Above
- 7.1. Market Analysis, Insights and Forecast - by Application
- 8. Europe Smart TV Sticks Analysis, Insights and Forecast, 2020-2032
- 8.1. Market Analysis, Insights and Forecast - by Application
- 8.1.1. Household
- 8.1.2. Commercial
- 8.2. Market Analysis, Insights and Forecast - by Types
- 8.2.1. Non-4K
- 8.2.2. 4K and Above
- 8.1. Market Analysis, Insights and Forecast - by Application
- 9. Middle East & Africa Smart TV Sticks Analysis, Insights and Forecast, 2020-2032
- 9.1. Market Analysis, Insights and Forecast - by Application
- 9.1.1. Household
- 9.1.2. Commercial
- 9.2. Market Analysis, Insights and Forecast - by Types
- 9.2.1. Non-4K
- 9.2.2. 4K and Above
- 9.1. Market Analysis, Insights and Forecast - by Application
- 10. Asia Pacific Smart TV Sticks Analysis, Insights and Forecast, 2020-2032
- 10.1. Market Analysis, Insights and Forecast - by Application
- 10.1.1. Household
- 10.1.2. Commercial
- 10.2. Market Analysis, Insights and Forecast - by Types
- 10.2.1. Non-4K
- 10.2.2. 4K and Above
- 10.1. Market Analysis, Insights and Forecast - by Application
- 11. Competitive Analysis
- 11.1. Global Market Share Analysis 2025
- 11.2. Company Profiles
- 11.2.1 Roku
- 11.2.1.1. Overview
- 11.2.1.2. Products
- 11.2.1.3. SWOT Analysis
- 11.2.1.4. Recent Developments
- 11.2.1.5. Financials (Based on Availability)
- 11.2.2 Sky PLC (Now TV)
- 11.2.2.1. Overview
- 11.2.2.2. Products
- 11.2.2.3. SWOT Analysis
- 11.2.2.4. Recent Developments
- 11.2.2.5. Financials (Based on Availability)
- 11.2.3 ASUSTeK Computer
- 11.2.3.1. Overview
- 11.2.3.2. Products
- 11.2.3.3. SWOT Analysis
- 11.2.3.4. Recent Developments
- 11.2.3.5. Financials (Based on Availability)
- 11.2.4 Shenzhen Rikomagic Tech
- 11.2.4.1. Overview
- 11.2.4.2. Products
- 11.2.4.3. SWOT Analysis
- 11.2.4.4. Recent Developments
- 11.2.4.5. Financials (Based on Availability)
- 11.2.5 Dongguan Sonicway Electrical Appliance
- 11.2.5.1. Overview
- 11.2.5.2. Products
- 11.2.5.3. SWOT Analysis
- 11.2.5.4. Recent Developments
- 11.2.5.5. Financials (Based on Availability)
- 11.2.6 Shenzhen Tomato Technology
- 11.2.6.1. Overview
- 11.2.6.2. Products
- 11.2.6.3. SWOT Analysis
- 11.2.6.4. Recent Developments
- 11.2.6.5. Financials (Based on Availability)
- 11.2.7 CloudWalker Streaming Technologies
- 11.2.7.1. Overview
- 11.2.7.2. Products
- 11.2.7.3. SWOT Analysis
- 11.2.7.4. Recent Developments
- 11.2.7.5. Financials (Based on Availability)
- 11.2.1 Roku
List of Figures
- Figure 1: Global Smart TV Sticks Revenue Breakdown (million, %) by Region 2025 & 2033
- Figure 2: Global Smart TV Sticks Volume Breakdown (K, %) by Region 2025 & 2033
- Figure 3: North America Smart TV Sticks Revenue (million), by Application 2025 & 2033
- Figure 4: North America Smart TV Sticks Volume (K), by Application 2025 & 2033
- Figure 5: North America Smart TV Sticks Revenue Share (%), by Application 2025 & 2033
- Figure 6: North America Smart TV Sticks Volume Share (%), by Application 2025 & 2033
- Figure 7: North America Smart TV Sticks Revenue (million), by Types 2025 & 2033
- Figure 8: North America Smart TV Sticks Volume (K), by Types 2025 & 2033
- Figure 9: North America Smart TV Sticks Revenue Share (%), by Types 2025 & 2033
- Figure 10: North America Smart TV Sticks Volume Share (%), by Types 2025 & 2033
- Figure 11: North America Smart TV Sticks Revenue (million), by Country 2025 & 2033
- Figure 12: North America Smart TV Sticks Volume (K), by Country 2025 & 2033
- Figure 13: North America Smart TV Sticks Revenue Share (%), by Country 2025 & 2033
- Figure 14: North America Smart TV Sticks Volume Share (%), by Country 2025 & 2033
- Figure 15: South America Smart TV Sticks Revenue (million), by Application 2025 & 2033
- Figure 16: South America Smart TV Sticks Volume (K), by Application 2025 & 2033
- Figure 17: South America Smart TV Sticks Revenue Share (%), by Application 2025 & 2033
- Figure 18: South America Smart TV Sticks Volume Share (%), by Application 2025 & 2033
- Figure 19: South America Smart TV Sticks Revenue (million), by Types 2025 & 2033
- Figure 20: South America Smart TV Sticks Volume (K), by Types 2025 & 2033
- Figure 21: South America Smart TV Sticks Revenue Share (%), by Types 2025 & 2033
- Figure 22: South America Smart TV Sticks Volume Share (%), by Types 2025 & 2033
- Figure 23: South America Smart TV Sticks Revenue (million), by Country 2025 & 2033
- Figure 24: South America Smart TV Sticks Volume (K), by Country 2025 & 2033
- Figure 25: South America Smart TV Sticks Revenue Share (%), by Country 2025 & 2033
- Figure 26: South America Smart TV Sticks Volume Share (%), by Country 2025 & 2033
- Figure 27: Europe Smart TV Sticks Revenue (million), by Application 2025 & 2033
- Figure 28: Europe Smart TV Sticks Volume (K), by Application 2025 & 2033
- Figure 29: Europe Smart TV Sticks Revenue Share (%), by Application 2025 & 2033
- Figure 30: Europe Smart TV Sticks Volume Share (%), by Application 2025 & 2033
- Figure 31: Europe Smart TV Sticks Revenue (million), by Types 2025 & 2033
- Figure 32: Europe Smart TV Sticks Volume (K), by Types 2025 & 2033
- Figure 33: Europe Smart TV Sticks Revenue Share (%), by Types 2025 & 2033
- Figure 34: Europe Smart TV Sticks Volume Share (%), by Types 2025 & 2033
- Figure 35: Europe Smart TV Sticks Revenue (million), by Country 2025 & 2033
- Figure 36: Europe Smart TV Sticks Volume (K), by Country 2025 & 2033
- Figure 37: Europe Smart TV Sticks Revenue Share (%), by Country 2025 & 2033
- Figure 38: Europe Smart TV Sticks Volume Share (%), by Country 2025 & 2033
- Figure 39: Middle East & Africa Smart TV Sticks Revenue (million), by Application 2025 & 2033
- Figure 40: Middle East & Africa Smart TV Sticks Volume (K), by Application 2025 & 2033
- Figure 41: Middle East & Africa Smart TV Sticks Revenue Share (%), by Application 2025 & 2033
- Figure 42: Middle East & Africa Smart TV Sticks Volume Share (%), by Application 2025 & 2033
- Figure 43: Middle East & Africa Smart TV Sticks Revenue (million), by Types 2025 & 2033
- Figure 44: Middle East & Africa Smart TV Sticks Volume (K), by Types 2025 & 2033
- Figure 45: Middle East & Africa Smart TV Sticks Revenue Share (%), by Types 2025 & 2033
- Figure 46: Middle East & Africa Smart TV Sticks Volume Share (%), by Types 2025 & 2033
- Figure 47: Middle East & Africa Smart TV Sticks Revenue (million), by Country 2025 & 2033
- Figure 48: Middle East & Africa Smart TV Sticks Volume (K), by Country 2025 & 2033
- Figure 49: Middle East & Africa Smart TV Sticks Revenue Share (%), by Country 2025 & 2033
- Figure 50: Middle East & Africa Smart TV Sticks Volume Share (%), by Country 2025 & 2033
- Figure 51: Asia Pacific Smart TV Sticks Revenue (million), by Application 2025 & 2033
- Figure 52: Asia Pacific Smart TV Sticks Volume (K), by Application 2025 & 2033
- Figure 53: Asia Pacific Smart TV Sticks Revenue Share (%), by Application 2025 & 2033
- Figure 54: Asia Pacific Smart TV Sticks Volume Share (%), by Application 2025 & 2033
- Figure 55: Asia Pacific Smart TV Sticks Revenue (million), by Types 2025 & 2033
- Figure 56: Asia Pacific Smart TV Sticks Volume (K), by Types 2025 & 2033
- Figure 57: Asia Pacific Smart TV Sticks Revenue Share (%), by Types 2025 & 2033
- Figure 58: Asia Pacific Smart TV Sticks Volume Share (%), by Types 2025 & 2033
- Figure 59: Asia Pacific Smart TV Sticks Revenue (million), by Country 2025 & 2033
- Figure 60: Asia Pacific Smart TV Sticks Volume (K), by Country 2025 & 2033
- Figure 61: Asia Pacific Smart TV Sticks Revenue Share (%), by Country 2025 & 2033
- Figure 62: Asia Pacific Smart TV Sticks Volume Share (%), by Country 2025 & 2033
List of Tables
- Table 1: Global Smart TV Sticks Revenue million Forecast, by Application 2020 & 2033
- Table 2: Global Smart TV Sticks Volume K Forecast, by Application 2020 & 2033
- Table 3: Global Smart TV Sticks Revenue million Forecast, by Types 2020 & 2033
- Table 4: Global Smart TV Sticks Volume K Forecast, by Types 2020 & 2033
- Table 5: Global Smart TV Sticks Revenue million Forecast, by Region 2020 & 2033
- Table 6: Global Smart TV Sticks Volume K Forecast, by Region 2020 & 2033
- Table 7: Global Smart TV Sticks Revenue million Forecast, by Application 2020 & 2033
- Table 8: Global Smart TV Sticks Volume K Forecast, by Application 2020 & 2033
- Table 9: Global Smart TV Sticks Revenue million Forecast, by Types 2020 & 2033
- Table 10: Global Smart TV Sticks Volume K Forecast, by Types 2020 & 2033
- Table 11: Global Smart TV Sticks Revenue million Forecast, by Country 2020 & 2033
- Table 12: Global Smart TV Sticks Volume K Forecast, by Country 2020 & 2033
- Table 13: United States Smart TV Sticks Revenue (million) Forecast, by Application 2020 & 2033
- Table 14: United States Smart TV Sticks Volume (K) Forecast, by Application 2020 & 2033
- Table 15: Canada Smart TV Sticks Revenue (million) Forecast, by Application 2020 & 2033
- Table 16: Canada Smart TV Sticks Volume (K) Forecast, by Application 2020 & 2033
- Table 17: Mexico Smart TV Sticks Revenue (million) Forecast, by Application 2020 & 2033
- Table 18: Mexico Smart TV Sticks Volume (K) Forecast, by Application 2020 & 2033
- Table 19: Global Smart TV Sticks Revenue million Forecast, by Application 2020 & 2033
- Table 20: Global Smart TV Sticks Volume K Forecast, by Application 2020 & 2033
- Table 21: Global Smart TV Sticks Revenue million Forecast, by Types 2020 & 2033
- Table 22: Global Smart TV Sticks Volume K Forecast, by Types 2020 & 2033
- Table 23: Global Smart TV Sticks Revenue million Forecast, by Country 2020 & 2033
- Table 24: Global Smart TV Sticks Volume K Forecast, by Country 2020 & 2033
- Table 25: Brazil Smart TV Sticks Revenue (million) Forecast, by Application 2020 & 2033
- Table 26: Brazil Smart TV Sticks Volume (K) Forecast, by Application 2020 & 2033
- Table 27: Argentina Smart TV Sticks Revenue (million) Forecast, by Application 2020 & 2033
- Table 28: Argentina Smart TV Sticks Volume (K) Forecast, by Application 2020 & 2033
- Table 29: Rest of South America Smart TV Sticks Revenue (million) Forecast, by Application 2020 & 2033
- Table 30: Rest of South America Smart TV Sticks Volume (K) Forecast, by Application 2020 & 2033
- Table 31: Global Smart TV Sticks Revenue million Forecast, by Application 2020 & 2033
- Table 32: Global Smart TV Sticks Volume K Forecast, by Application 2020 & 2033
- Table 33: Global Smart TV Sticks Revenue million Forecast, by Types 2020 & 2033
- Table 34: Global Smart TV Sticks Volume K Forecast, by Types 2020 & 2033
- Table 35: Global Smart TV Sticks Revenue million Forecast, by Country 2020 & 2033
- Table 36: Global Smart TV Sticks Volume K Forecast, by Country 2020 & 2033
- Table 37: United Kingdom Smart TV Sticks Revenue (million) Forecast, by Application 2020 & 2033
- Table 38: United Kingdom Smart TV Sticks Volume (K) Forecast, by Application 2020 & 2033
- Table 39: Germany Smart TV Sticks Revenue (million) Forecast, by Application 2020 & 2033
- Table 40: Germany Smart TV Sticks Volume (K) Forecast, by Application 2020 & 2033
- Table 41: France Smart TV Sticks Revenue (million) Forecast, by Application 2020 & 2033
- Table 42: France Smart TV Sticks Volume (K) Forecast, by Application 2020 & 2033
- Table 43: Italy Smart TV Sticks Revenue (million) Forecast, by Application 2020 & 2033
- Table 44: Italy Smart TV Sticks Volume (K) Forecast, by Application 2020 & 2033
- Table 45: Spain Smart TV Sticks Revenue (million) Forecast, by Application 2020 & 2033
- Table 46: Spain Smart TV Sticks Volume (K) Forecast, by Application 2020 & 2033
- Table 47: Russia Smart TV Sticks Revenue (million) Forecast, by Application 2020 & 2033
- Table 48: Russia Smart TV Sticks Volume (K) Forecast, by Application 2020 & 2033
- Table 49: Benelux Smart TV Sticks Revenue (million) Forecast, by Application 2020 & 2033
- Table 50: Benelux Smart TV Sticks Volume (K) Forecast, by Application 2020 & 2033
- Table 51: Nordics Smart TV Sticks Revenue (million) Forecast, by Application 2020 & 2033
- Table 52: Nordics Smart TV Sticks Volume (K) Forecast, by Application 2020 & 2033
- Table 53: Rest of Europe Smart TV Sticks Revenue (million) Forecast, by Application 2020 & 2033
- Table 54: Rest of Europe Smart TV Sticks Volume (K) Forecast, by Application 2020 & 2033
- Table 55: Global Smart TV Sticks Revenue million Forecast, by Application 2020 & 2033
- Table 56: Global Smart TV Sticks Volume K Forecast, by Application 2020 & 2033
- Table 57: Global Smart TV Sticks Revenue million Forecast, by Types 2020 & 2033
- Table 58: Global Smart TV Sticks Volume K Forecast, by Types 2020 & 2033
- Table 59: Global Smart TV Sticks Revenue million Forecast, by Country 2020 & 2033
- Table 60: Global Smart TV Sticks Volume K Forecast, by Country 2020 & 2033
- Table 61: Turkey Smart TV Sticks Revenue (million) Forecast, by Application 2020 & 2033
- Table 62: Turkey Smart TV Sticks Volume (K) Forecast, by Application 2020 & 2033
- Table 63: Israel Smart TV Sticks Revenue (million) Forecast, by Application 2020 & 2033
- Table 64: Israel Smart TV Sticks Volume (K) Forecast, by Application 2020 & 2033
- Table 65: GCC Smart TV Sticks Revenue (million) Forecast, by Application 2020 & 2033
- Table 66: GCC Smart TV Sticks Volume (K) Forecast, by Application 2020 & 2033
- Table 67: North Africa Smart TV Sticks Revenue (million) Forecast, by Application 2020 & 2033
- Table 68: North Africa Smart TV Sticks Volume (K) Forecast, by Application 2020 & 2033
- Table 69: South Africa Smart TV Sticks Revenue (million) Forecast, by Application 2020 & 2033
- Table 70: South Africa Smart TV Sticks Volume (K) Forecast, by Application 2020 & 2033
- Table 71: Rest of Middle East & Africa Smart TV Sticks Revenue (million) Forecast, by Application 2020 & 2033
- Table 72: Rest of Middle East & Africa Smart TV Sticks Volume (K) Forecast, by Application 2020 & 2033
- Table 73: Global Smart TV Sticks Revenue million Forecast, by Application 2020 & 2033
- Table 74: Global Smart TV Sticks Volume K Forecast, by Application 2020 & 2033
- Table 75: Global Smart TV Sticks Revenue million Forecast, by Types 2020 & 2033
- Table 76: Global Smart TV Sticks Volume K Forecast, by Types 2020 & 2033
- Table 77: Global Smart TV Sticks Revenue million Forecast, by Country 2020 & 2033
- Table 78: Global Smart TV Sticks Volume K Forecast, by Country 2020 & 2033
- Table 79: China Smart TV Sticks Revenue (million) Forecast, by Application 2020 & 2033
- Table 80: China Smart TV Sticks Volume (K) Forecast, by Application 2020 & 2033
- Table 81: India Smart TV Sticks Revenue (million) Forecast, by Application 2020 & 2033
- Table 82: India Smart TV Sticks Volume (K) Forecast, by Application 2020 & 2033
- Table 83: Japan Smart TV Sticks Revenue (million) Forecast, by Application 2020 & 2033
- Table 84: Japan Smart TV Sticks Volume (K) Forecast, by Application 2020 & 2033
- Table 85: South Korea Smart TV Sticks Revenue (million) Forecast, by Application 2020 & 2033
- Table 86: South Korea Smart TV Sticks Volume (K) Forecast, by Application 2020 & 2033
- Table 87: ASEAN Smart TV Sticks Revenue (million) Forecast, by Application 2020 & 2033
- Table 88: ASEAN Smart TV Sticks Volume (K) Forecast, by Application 2020 & 2033
- Table 89: Oceania Smart TV Sticks Revenue (million) Forecast, by Application 2020 & 2033
- Table 90: Oceania Smart TV Sticks Volume (K) Forecast, by Application 2020 & 2033
- Table 91: Rest of Asia Pacific Smart TV Sticks Revenue (million) Forecast, by Application 2020 & 2033
- Table 92: Rest of Asia Pacific Smart TV Sticks Volume (K) Forecast, by Application 2020 & 2033
Frequently Asked Questions
1. What is the projected Compound Annual Growth Rate (CAGR) of the Smart TV Sticks?
The projected CAGR is approximately XX%.
2. Which companies are prominent players in the Smart TV Sticks?
Key companies in the market include Roku, Sky PLC (Now TV), ASUSTeK Computer, Shenzhen Rikomagic Tech, Dongguan Sonicway Electrical Appliance, Shenzhen Tomato Technology, CloudWalker Streaming Technologies.
3. What are the main segments of the Smart TV Sticks?
The market segments include Application, Types.
4. Can you provide details about the market size?
The market size is estimated to be USD XXX million as of 2022.
5. What are some drivers contributing to market growth?
N/A
6. What are the notable trends driving market growth?
N/A
7. Are there any restraints impacting market growth?
N/A
8. Can you provide examples of recent developments in the market?
N/A
9. What pricing options are available for accessing the report?
Pricing options include single-user, multi-user, and enterprise licenses priced at USD 3350.00, USD 5025.00, and USD 6700.00 respectively.
10. Is the market size provided in terms of value or volume?
The market size is provided in terms of value, measured in million and volume, measured in K.
11. Are there any specific market keywords associated with the report?
Yes, the market keyword associated with the report is "Smart TV Sticks," which aids in identifying and referencing the specific market segment covered.
12. How do I determine which pricing option suits my needs best?
The pricing options vary based on user requirements and access needs. Individual users may opt for single-user licenses, while businesses requiring broader access may choose multi-user or enterprise licenses for cost-effective access to the report.
13. Are there any additional resources or data provided in the Smart TV Sticks report?
While the report offers comprehensive insights, it's advisable to review the specific contents or supplementary materials provided to ascertain if additional resources or data are available.
14. How can I stay updated on further developments or reports in the Smart TV Sticks?
To stay informed about further developments, trends, and reports in the Smart TV Sticks, consider subscribing to industry newsletters, following relevant companies and organizations, or regularly checking reputable industry news sources and publications.
Methodology
Step 1 - Identification of Relevant Samples Size from Population Database


Step 2 - Approaches for Defining Global Market Size (Value, Volume* & Price*)

Note*: In applicable scenarios
Step 3 - Data Sources
Primary Research
- Web Analytics
- Survey Reports
- Research Institute
- Latest Research Reports
- Opinion Leaders
Secondary Research
- Annual Reports
- White Paper
- Latest Press Release
- Industry Association
- Paid Database
- Investor Presentations

Step 4 - Data Triangulation
Involves using different sources of information in order to increase the validity of a study
These sources are likely to be stakeholders in a program - participants, other researchers, program staff, other community members, and so on.
Then we put all data in single framework & apply various statistical tools to find out the dynamic on the market.
During the analysis stage, feedback from the stakeholder groups would be compared to determine areas of agreement as well as areas of divergence