

Key Insights
The global rail composites market is experiencing robust growth, driven by the increasing demand for lightweight, high-strength materials in the railway industry. A compound annual growth rate (CAGR) exceeding 5% from 2019 to 2033 signifies a significant expansion. This surge is fueled by several key factors. Firstly, the ongoing global shift towards sustainable transportation solutions necessitates the adoption of lighter weight materials to improve fuel efficiency and reduce carbon emissions. Composites, with their superior strength-to-weight ratio compared to traditional materials like steel, are ideally suited to meet this demand. Secondly, the rising investment in high-speed rail infrastructure projects worldwide is bolstering the market. High-speed trains require components that can withstand immense stress and vibration, making the durability and performance of composites exceptionally valuable. Finally, the continuous advancements in composite materials technology, leading to enhanced performance characteristics and cost-effectiveness, are further propelling market growth. The market segmentation reveals strong demand across various resin and fiber types, with epoxy and glass fiber currently dominating, but the market is expected to witness increased adoption of carbon fiber composites for niche applications requiring superior strength and stiffness.
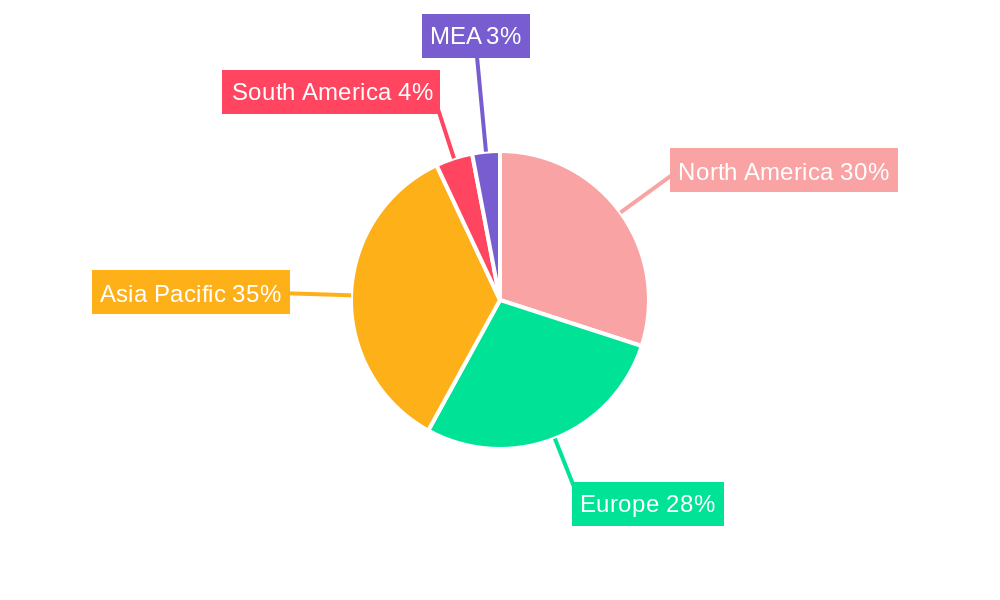
Regional analysis suggests a diverse landscape with North America and Europe currently holding significant market shares due to established rail networks and high adoption rates. However, the Asia-Pacific region is poised for substantial growth, driven by rapid infrastructure development and increasing investment in railways within countries like China and India. The competitive landscape is marked by the presence of both established global players and regional manufacturers. Key industry players are focusing on strategic collaborations, product innovations, and expansion into new geographical markets to gain a competitive edge. The restraints on market growth primarily include the relatively high initial cost of composite materials compared to traditional materials and the need for specialized manufacturing processes. However, ongoing technological advancements and economies of scale are gradually mitigating these challenges, ultimately ensuring the continued expansion of the rail composites market.
Rail Composites Market: A Comprehensive Analysis (2019-2033)
This insightful report provides a detailed analysis of the global Rail Composites Market, offering a comprehensive overview of its current state, future trends, and key players. The study period spans from 2019 to 2033, with 2025 serving as the base and estimated year. The report utilizes a robust methodology to forecast market growth from 2025 to 2033, providing invaluable insights for stakeholders across the value chain. Market sizing is provided in Millions.
Rail Composites Market Composition & Trends
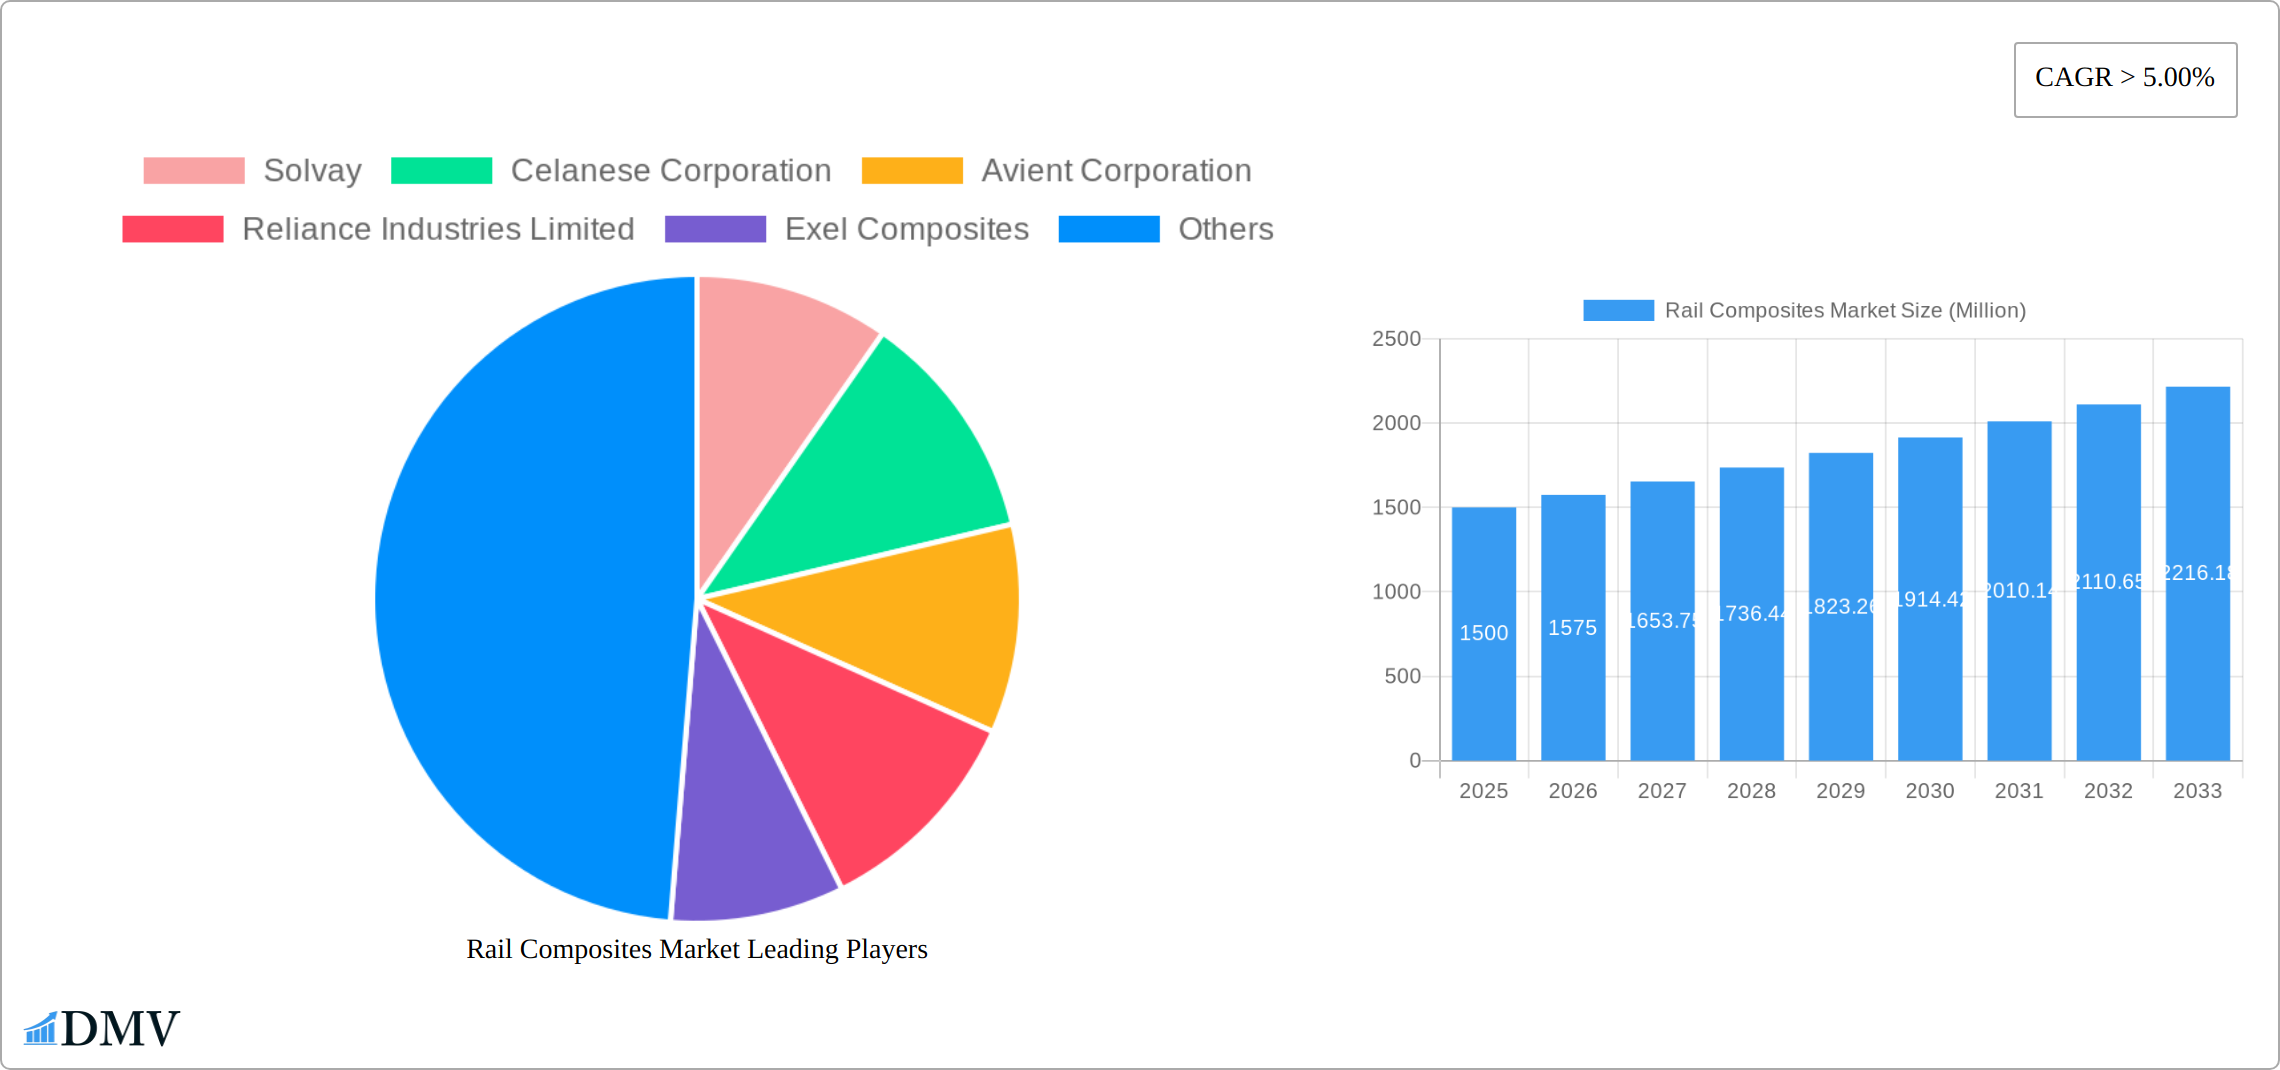
The Rail Composites Market is experiencing significant growth driven by increasing demand for lightweight, high-strength materials in the rail industry. Market concentration is moderately high, with key players like Solvay, Celanese Corporation, and BASF SE holding substantial market share. However, the market is also witnessing the emergence of several innovative companies, fostering competition and driving technological advancements. Regulatory landscapes, particularly concerning environmental regulations and safety standards, are shaping market dynamics. Substitute products, such as traditional steel and aluminum, pose a challenge, but the superior properties of composites—including higher strength-to-weight ratios and corrosion resistance—are driving adoption. End-users primarily include rail vehicle manufacturers and infrastructure developers. M&A activities have been moderate, with deal values averaging around xx Million in recent years.
- Market Share Distribution (2024): Solvay (15%), Celanese (12%), BASF SE (10%), Others (63%)
- M&A Deal Value (2019-2024): Averaging xx Million annually.
- Innovation Catalysts: Lightweighting initiatives, improved material properties, and government support for sustainable transportation.
- Regulatory Landscape: Focus on safety, recyclability, and environmental impact.
Rail Composites Market Industry Evolution
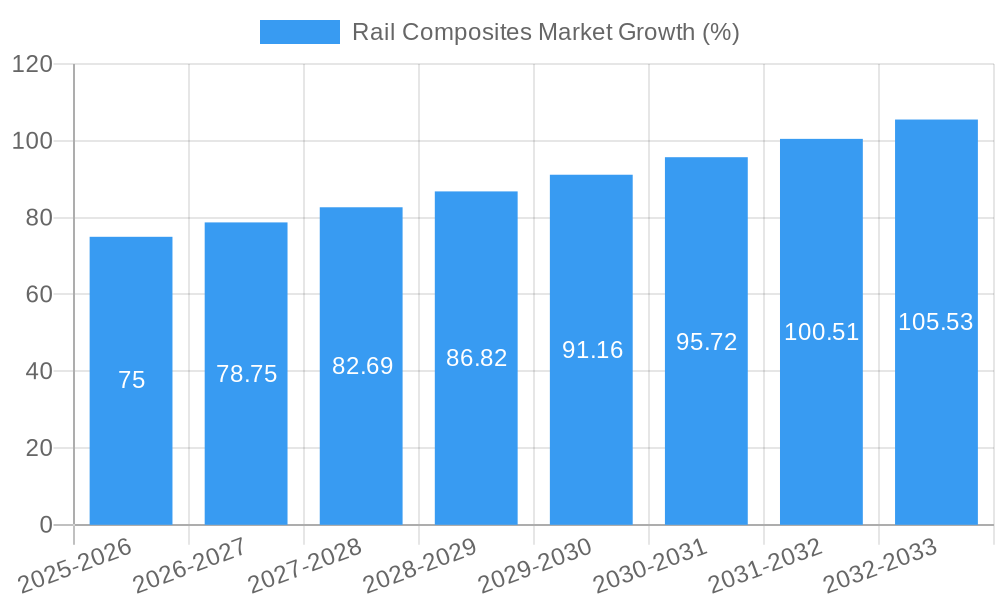
The rail composites market has experienced remarkable growth from 2019 to 2024, achieving a Compound Annual Growth Rate (CAGR) of xx%. This upward trajectory is projected to continue throughout the forecast period (2025-2033), propelled by several key factors. Significant advancements in materials science, such as the development of high-strength, lightweight fibers and innovative resin systems, are driving the adoption of composites in rail applications. The industry's commitment to sustainability is also a major force, with increased demand for fuel-efficient and environmentally friendly solutions leading to a greater focus on lightweighting and reduced emissions. Furthermore, the desire for improved passenger comfort and aesthetically pleasing designs is influencing the integration of composites into new and refurbished rolling stock. This trend is clearly demonstrated by the substantial increase in composite component adoption in new rolling stock; xx% of new rolling stock incorporated composite components in 2024. Ongoing research and development efforts are focused on enhancing the durability, fire resistance, recyclability, and overall lifecycle performance of composite materials used in the rail industry.
Leading Regions, Countries, or Segments in Rail Composites Market
The North American region currently holds the largest market share, driven by substantial investments in rail infrastructure upgrades and a strong focus on sustainability initiatives. Within the material segments, Epoxy resin currently dominates due to its superior performance characteristics, followed by Polyester and Vinyl Ester resins. Glass fiber remains the most prevalent fiber type due to its cost-effectiveness, although Carbon fiber is gaining traction in high-performance applications. Exterior applications (e.g., car bodies, underframes) represent a larger market segment compared to interior applications (e.g., seating, interiors).
- Key Drivers for North America: Significant investments in rail infrastructure modernization, stringent environmental regulations promoting lightweighting, and a robust manufacturing base.
- Epoxy Resin Dominance: Superior strength-to-weight ratio, excellent adhesion, and good chemical resistance.
- Glass Fiber Prevalence: Cost-effectiveness and ease of processing.
- Exterior Application Focus: Higher demand driven by the need for lightweight, durable, and weather-resistant components.
Rail Composites Market Product Innovations
Recent innovations are revolutionizing the performance and capabilities of rail composites. The focus is on developing high-performance materials with significantly enhanced properties. This includes improvements in impact resistance, fire retardancy, and recyclability, often achieved through novel resin systems and advanced fiber architectures. The development of self-healing composites offers exceptional durability and extends the lifespan of components, reducing maintenance costs and minimizing downtime. The incorporation of recycled materials demonstrates a strong commitment to sustainability and circular economy principles. These advancements offer significant unique selling propositions (USPs) to manufacturers, including substantial weight reduction, improved safety features, and enhanced aesthetic appeal, ultimately contributing to the overall competitiveness and desirability of composite-based rail solutions.
Propelling Factors for Rail Composites Market Growth
Technological advancements in composite materials, such as the development of stronger and lighter fibers and resins, are a major driver. Economic factors, including increasing fuel costs and the need for energy efficiency in rail transportation, are also boosting demand. Government regulations aimed at reducing emissions and improving fuel economy are incentivizing the adoption of lightweight composite materials. The growing focus on sustainability, particularly within the rail industry, is further accelerating market growth.
Obstacles in the Rail Composites Market Market
High initial material costs compared to traditional materials can act as a barrier to adoption. Supply chain disruptions and the availability of raw materials can also impact market growth. The complexity of composite manufacturing and the need for specialized expertise can also pose challenges. Competitive pressures from existing materials like steel and aluminum, along with technological barriers to fully recyclable composites, present further obstacles.
Future Opportunities in Rail Composites Market
Expansion into emerging markets with growing rail infrastructure projects presents significant growth potential. Development of novel composite materials with improved properties, such as self-healing capabilities and enhanced durability, offers exciting opportunities. Exploring new applications of composite materials within the rail industry, such as in noise reduction systems and advanced braking systems, will also drive market expansion. The rise of high-speed rail and mass transit systems will further fuel demand.
Major Players in the Rail Composites Market Ecosystem
- Solvay
- Celanese Corporation
- Avient Corporation
- Reliance Industries Limited
- Exel Composites
- LANXESS
- BASF SE
- Kineco Limited
- Toray Industries Inc
- Hexcel Corporation
- Gurit
- TEIJIN LIMITED
- Mitsubishi Chemical Advanced Materials
Key Developments in Rail Composites Market Industry
- May 2021: Celanese announced a three-year plan to expand its LFT (long-fiber thermoplastics) capacity in Nanjing, China, scheduled for completion by the second half of 2023. This expansion significantly bolsters the supply of a crucial material for rail composite applications, supporting the industry's growth trajectory.
- [Add other key developments here with dates and concise descriptions. Example: October 2022: Company X launched a new fire-retardant composite material specifically designed for rail carriages.]
Strategic Rail Composites Market Market Forecast
The rail composites market is poised for robust and sustained growth, driven by the increasing demand for lightweight, high-performance materials in the rail sector. Future opportunities are abundant, driven by continuous technological advancements, expansion into new geographic markets, and the ever-growing emphasis on sustainability. The market is projected to experience a CAGR of xx% during the forecast period (2025-2033), reaching a market value of xx Million by 2033. This positive outlook is underpinned by ongoing innovation, supportive regulatory environments, and substantial global investment in rail infrastructure modernization and expansion. Further growth will be influenced by factors such as government policies promoting sustainable transportation, increasing urbanization leading to higher passenger demand, and the ongoing adoption of advanced manufacturing techniques within the rail industry.
Rail Composites Market Segmentation
-
1. Resin Type
- 1.1. Epoxy
- 1.2. Polyester
- 1.3. Phenolic
- 1.4. Vinyl Ester
- 1.5. Other Resin Types
-
2. Fiber Type
- 2.1. Glass Fiber
- 2.2. Carbon Fiber
- 2.3. Other Fiber Types
-
3. Application
- 3.1. Exterior
- 3.2. Interior
Rail Composites Market Segmentation By Geography
-
1. Asia Pacific
- 1.1. China
- 1.2. India
- 1.3. Japan
- 1.4. South Korea
- 1.5. Rest of Asia Pacific
-
2. North America
- 2.1. United States
- 2.2. Canada
- 2.3. Mexico
-
3. Europe
- 3.1. Germany
- 3.2. United Kingdom
- 3.3. Italy
- 3.4. France
- 3.5. Rest of Europe
- 4. Rest of the World
Rail Composites Market REPORT HIGHLIGHTS
| Aspects | Details |
|---|---|
| Study Period | 2019-2033 |
| Base Year | 2024 |
| Estimated Year | 2025 |
| Forecast Period | 2025-2033 |
| Historical Period | 2019-2024 |
| Growth Rate | CAGR of > 5.00% from 2019-2033 |
| Segmentation |
|
Table of Contents
- 1. Introduction
- 1.1. Research Scope
- 1.2. Market Segmentation
- 1.3. Research Methodology
- 1.4. Definitions and Assumptions
- 2. Executive Summary
- 2.1. Introduction
- 3. Market Dynamics
- 3.1. Introduction
- 3.2. Market Drivers
- 3.2.1. Increasing Railway Projects in the Asia-Pacific Region; Rapidly Increasing Demand for High-speed Rail
- 3.3. Market Restrains
- 3.3.1 Lack of Railway Infrastructure in Vietnam
- 3.3.2 Indonesia
- 3.3.3 and Thailand; Restrictions on Composite Materials for Railway Application
- 3.4. Market Trends
- 3.4.1. Exterior Application to Dominate the Market
- 4. Market Factor Analysis
- 4.1. Porters Five Forces
- 4.2. Supply/Value Chain
- 4.3. PESTEL analysis
- 4.4. Market Entropy
- 4.5. Patent/Trademark Analysis
- 5. Global Rail Composites Market Analysis, Insights and Forecast, 2019-2031
- 5.1. Market Analysis, Insights and Forecast - by Resin Type
- 5.1.1. Epoxy
- 5.1.2. Polyester
- 5.1.3. Phenolic
- 5.1.4. Vinyl Ester
- 5.1.5. Other Resin Types
- 5.2. Market Analysis, Insights and Forecast - by Fiber Type
- 5.2.1. Glass Fiber
- 5.2.2. Carbon Fiber
- 5.2.3. Other Fiber Types
- 5.3. Market Analysis, Insights and Forecast - by Application
- 5.3.1. Exterior
- 5.3.2. Interior
- 5.4. Market Analysis, Insights and Forecast - by Region
- 5.4.1. Asia Pacific
- 5.4.2. North America
- 5.4.3. Europe
- 5.4.4. Rest of the World
- 5.1. Market Analysis, Insights and Forecast - by Resin Type
- 6. Asia Pacific Rail Composites Market Analysis, Insights and Forecast, 2019-2031
- 6.1. Market Analysis, Insights and Forecast - by Resin Type
- 6.1.1. Epoxy
- 6.1.2. Polyester
- 6.1.3. Phenolic
- 6.1.4. Vinyl Ester
- 6.1.5. Other Resin Types
- 6.2. Market Analysis, Insights and Forecast - by Fiber Type
- 6.2.1. Glass Fiber
- 6.2.2. Carbon Fiber
- 6.2.3. Other Fiber Types
- 6.3. Market Analysis, Insights and Forecast - by Application
- 6.3.1. Exterior
- 6.3.2. Interior
- 6.1. Market Analysis, Insights and Forecast - by Resin Type
- 7. North America Rail Composites Market Analysis, Insights and Forecast, 2019-2031
- 7.1. Market Analysis, Insights and Forecast - by Resin Type
- 7.1.1. Epoxy
- 7.1.2. Polyester
- 7.1.3. Phenolic
- 7.1.4. Vinyl Ester
- 7.1.5. Other Resin Types
- 7.2. Market Analysis, Insights and Forecast - by Fiber Type
- 7.2.1. Glass Fiber
- 7.2.2. Carbon Fiber
- 7.2.3. Other Fiber Types
- 7.3. Market Analysis, Insights and Forecast - by Application
- 7.3.1. Exterior
- 7.3.2. Interior
- 7.1. Market Analysis, Insights and Forecast - by Resin Type
- 8. Europe Rail Composites Market Analysis, Insights and Forecast, 2019-2031
- 8.1. Market Analysis, Insights and Forecast - by Resin Type
- 8.1.1. Epoxy
- 8.1.2. Polyester
- 8.1.3. Phenolic
- 8.1.4. Vinyl Ester
- 8.1.5. Other Resin Types
- 8.2. Market Analysis, Insights and Forecast - by Fiber Type
- 8.2.1. Glass Fiber
- 8.2.2. Carbon Fiber
- 8.2.3. Other Fiber Types
- 8.3. Market Analysis, Insights and Forecast - by Application
- 8.3.1. Exterior
- 8.3.2. Interior
- 8.1. Market Analysis, Insights and Forecast - by Resin Type
- 9. Rest of the World Rail Composites Market Analysis, Insights and Forecast, 2019-2031
- 9.1. Market Analysis, Insights and Forecast - by Resin Type
- 9.1.1. Epoxy
- 9.1.2. Polyester
- 9.1.3. Phenolic
- 9.1.4. Vinyl Ester
- 9.1.5. Other Resin Types
- 9.2. Market Analysis, Insights and Forecast - by Fiber Type
- 9.2.1. Glass Fiber
- 9.2.2. Carbon Fiber
- 9.2.3. Other Fiber Types
- 9.3. Market Analysis, Insights and Forecast - by Application
- 9.3.1. Exterior
- 9.3.2. Interior
- 9.1. Market Analysis, Insights and Forecast - by Resin Type
- 10. North America Rail Composites Market Analysis, Insights and Forecast, 2019-2031
- 10.1. Market Analysis, Insights and Forecast - By Country/Sub-region
- 10.1.1 United States
- 10.1.2 Canada
- 10.1.3 Mexico
- 11. Europe Rail Composites Market Analysis, Insights and Forecast, 2019-2031
- 11.1. Market Analysis, Insights and Forecast - By Country/Sub-region
- 11.1.1 Germany
- 11.1.2 United Kingdom
- 11.1.3 France
- 11.1.4 Spain
- 11.1.5 Italy
- 11.1.6 Spain
- 11.1.7 Belgium
- 11.1.8 Netherland
- 11.1.9 Nordics
- 11.1.10 Rest of Europe
- 12. Asia Pacific Rail Composites Market Analysis, Insights and Forecast, 2019-2031
- 12.1. Market Analysis, Insights and Forecast - By Country/Sub-region
- 12.1.1 China
- 12.1.2 Japan
- 12.1.3 India
- 12.1.4 South Korea
- 12.1.5 Southeast Asia
- 12.1.6 Australia
- 12.1.7 Indonesia
- 12.1.8 Phillipes
- 12.1.9 Singapore
- 12.1.10 Thailandc
- 12.1.11 Rest of Asia Pacific
- 13. South America Rail Composites Market Analysis, Insights and Forecast, 2019-2031
- 13.1. Market Analysis, Insights and Forecast - By Country/Sub-region
- 13.1.1 Brazil
- 13.1.2 Argentina
- 13.1.3 Peru
- 13.1.4 Chile
- 13.1.5 Colombia
- 13.1.6 Ecuador
- 13.1.7 Venezuela
- 13.1.8 Rest of South America
- 14. North America Rail Composites Market Analysis, Insights and Forecast, 2019-2031
- 14.1. Market Analysis, Insights and Forecast - By Country/Sub-region
- 14.1.1 United States
- 14.1.2 Canada
- 14.1.3 Mexico
- 15. MEA Rail Composites Market Analysis, Insights and Forecast, 2019-2031
- 15.1. Market Analysis, Insights and Forecast - By Country/Sub-region
- 15.1.1 United Arab Emirates
- 15.1.2 Saudi Arabia
- 15.1.3 South Africa
- 15.1.4 Rest of Middle East and Africa
- 16. Competitive Analysis
- 16.1. Global Market Share Analysis 2024
- 16.2. Company Profiles
- 16.2.1 Solvay
- 16.2.1.1. Overview
- 16.2.1.2. Products
- 16.2.1.3. SWOT Analysis
- 16.2.1.4. Recent Developments
- 16.2.1.5. Financials (Based on Availability)
- 16.2.2 Celanese Corporation
- 16.2.2.1. Overview
- 16.2.2.2. Products
- 16.2.2.3. SWOT Analysis
- 16.2.2.4. Recent Developments
- 16.2.2.5. Financials (Based on Availability)
- 16.2.3 Avient Corporation
- 16.2.3.1. Overview
- 16.2.3.2. Products
- 16.2.3.3. SWOT Analysis
- 16.2.3.4. Recent Developments
- 16.2.3.5. Financials (Based on Availability)
- 16.2.4 Reliance Industries Limited
- 16.2.4.1. Overview
- 16.2.4.2. Products
- 16.2.4.3. SWOT Analysis
- 16.2.4.4. Recent Developments
- 16.2.4.5. Financials (Based on Availability)
- 16.2.5 Exel Composites
- 16.2.5.1. Overview
- 16.2.5.2. Products
- 16.2.5.3. SWOT Analysis
- 16.2.5.4. Recent Developments
- 16.2.5.5. Financials (Based on Availability)
- 16.2.6 LANXESS
- 16.2.6.1. Overview
- 16.2.6.2. Products
- 16.2.6.3. SWOT Analysis
- 16.2.6.4. Recent Developments
- 16.2.6.5. Financials (Based on Availability)
- 16.2.7 BASF SE
- 16.2.7.1. Overview
- 16.2.7.2. Products
- 16.2.7.3. SWOT Analysis
- 16.2.7.4. Recent Developments
- 16.2.7.5. Financials (Based on Availability)
- 16.2.8 Kineco Limited
- 16.2.8.1. Overview
- 16.2.8.2. Products
- 16.2.8.3. SWOT Analysis
- 16.2.8.4. Recent Developments
- 16.2.8.5. Financials (Based on Availability)
- 16.2.9 Toray Industries Inc
- 16.2.9.1. Overview
- 16.2.9.2. Products
- 16.2.9.3. SWOT Analysis
- 16.2.9.4. Recent Developments
- 16.2.9.5. Financials (Based on Availability)
- 16.2.10 Hexcel Corporation
- 16.2.10.1. Overview
- 16.2.10.2. Products
- 16.2.10.3. SWOT Analysis
- 16.2.10.4. Recent Developments
- 16.2.10.5. Financials (Based on Availability)
- 16.2.11 Gurit
- 16.2.11.1. Overview
- 16.2.11.2. Products
- 16.2.11.3. SWOT Analysis
- 16.2.11.4. Recent Developments
- 16.2.11.5. Financials (Based on Availability)
- 16.2.12 TEIJIN LIMITED
- 16.2.12.1. Overview
- 16.2.12.2. Products
- 16.2.12.3. SWOT Analysis
- 16.2.12.4. Recent Developments
- 16.2.12.5. Financials (Based on Availability)
- 16.2.13 Mitsubishi Chemical Advanced Materials
- 16.2.13.1. Overview
- 16.2.13.2. Products
- 16.2.13.3. SWOT Analysis
- 16.2.13.4. Recent Developments
- 16.2.13.5. Financials (Based on Availability)
- 16.2.1 Solvay
List of Figures
- Figure 1: Global Rail Composites Market Revenue Breakdown (Million, %) by Region 2024 & 2032
- Figure 2: Global Rail Composites Market Volume Breakdown (K Tons, %) by Region 2024 & 2032
- Figure 3: North America Rail Composites Market Revenue (Million), by Country 2024 & 2032
- Figure 4: North America Rail Composites Market Volume (K Tons), by Country 2024 & 2032
- Figure 5: North America Rail Composites Market Revenue Share (%), by Country 2024 & 2032
- Figure 6: North America Rail Composites Market Volume Share (%), by Country 2024 & 2032
- Figure 7: Europe Rail Composites Market Revenue (Million), by Country 2024 & 2032
- Figure 8: Europe Rail Composites Market Volume (K Tons), by Country 2024 & 2032
- Figure 9: Europe Rail Composites Market Revenue Share (%), by Country 2024 & 2032
- Figure 10: Europe Rail Composites Market Volume Share (%), by Country 2024 & 2032
- Figure 11: Asia Pacific Rail Composites Market Revenue (Million), by Country 2024 & 2032
- Figure 12: Asia Pacific Rail Composites Market Volume (K Tons), by Country 2024 & 2032
- Figure 13: Asia Pacific Rail Composites Market Revenue Share (%), by Country 2024 & 2032
- Figure 14: Asia Pacific Rail Composites Market Volume Share (%), by Country 2024 & 2032
- Figure 15: South America Rail Composites Market Revenue (Million), by Country 2024 & 2032
- Figure 16: South America Rail Composites Market Volume (K Tons), by Country 2024 & 2032
- Figure 17: South America Rail Composites Market Revenue Share (%), by Country 2024 & 2032
- Figure 18: South America Rail Composites Market Volume Share (%), by Country 2024 & 2032
- Figure 19: North America Rail Composites Market Revenue (Million), by Country 2024 & 2032
- Figure 20: North America Rail Composites Market Volume (K Tons), by Country 2024 & 2032
- Figure 21: North America Rail Composites Market Revenue Share (%), by Country 2024 & 2032
- Figure 22: North America Rail Composites Market Volume Share (%), by Country 2024 & 2032
- Figure 23: MEA Rail Composites Market Revenue (Million), by Country 2024 & 2032
- Figure 24: MEA Rail Composites Market Volume (K Tons), by Country 2024 & 2032
- Figure 25: MEA Rail Composites Market Revenue Share (%), by Country 2024 & 2032
- Figure 26: MEA Rail Composites Market Volume Share (%), by Country 2024 & 2032
- Figure 27: Asia Pacific Rail Composites Market Revenue (Million), by Resin Type 2024 & 2032
- Figure 28: Asia Pacific Rail Composites Market Volume (K Tons), by Resin Type 2024 & 2032
- Figure 29: Asia Pacific Rail Composites Market Revenue Share (%), by Resin Type 2024 & 2032
- Figure 30: Asia Pacific Rail Composites Market Volume Share (%), by Resin Type 2024 & 2032
- Figure 31: Asia Pacific Rail Composites Market Revenue (Million), by Fiber Type 2024 & 2032
- Figure 32: Asia Pacific Rail Composites Market Volume (K Tons), by Fiber Type 2024 & 2032
- Figure 33: Asia Pacific Rail Composites Market Revenue Share (%), by Fiber Type 2024 & 2032
- Figure 34: Asia Pacific Rail Composites Market Volume Share (%), by Fiber Type 2024 & 2032
- Figure 35: Asia Pacific Rail Composites Market Revenue (Million), by Application 2024 & 2032
- Figure 36: Asia Pacific Rail Composites Market Volume (K Tons), by Application 2024 & 2032
- Figure 37: Asia Pacific Rail Composites Market Revenue Share (%), by Application 2024 & 2032
- Figure 38: Asia Pacific Rail Composites Market Volume Share (%), by Application 2024 & 2032
- Figure 39: Asia Pacific Rail Composites Market Revenue (Million), by Country 2024 & 2032
- Figure 40: Asia Pacific Rail Composites Market Volume (K Tons), by Country 2024 & 2032
- Figure 41: Asia Pacific Rail Composites Market Revenue Share (%), by Country 2024 & 2032
- Figure 42: Asia Pacific Rail Composites Market Volume Share (%), by Country 2024 & 2032
- Figure 43: North America Rail Composites Market Revenue (Million), by Resin Type 2024 & 2032
- Figure 44: North America Rail Composites Market Volume (K Tons), by Resin Type 2024 & 2032
- Figure 45: North America Rail Composites Market Revenue Share (%), by Resin Type 2024 & 2032
- Figure 46: North America Rail Composites Market Volume Share (%), by Resin Type 2024 & 2032
- Figure 47: North America Rail Composites Market Revenue (Million), by Fiber Type 2024 & 2032
- Figure 48: North America Rail Composites Market Volume (K Tons), by Fiber Type 2024 & 2032
- Figure 49: North America Rail Composites Market Revenue Share (%), by Fiber Type 2024 & 2032
- Figure 50: North America Rail Composites Market Volume Share (%), by Fiber Type 2024 & 2032
- Figure 51: North America Rail Composites Market Revenue (Million), by Application 2024 & 2032
- Figure 52: North America Rail Composites Market Volume (K Tons), by Application 2024 & 2032
- Figure 53: North America Rail Composites Market Revenue Share (%), by Application 2024 & 2032
- Figure 54: North America Rail Composites Market Volume Share (%), by Application 2024 & 2032
- Figure 55: North America Rail Composites Market Revenue (Million), by Country 2024 & 2032
- Figure 56: North America Rail Composites Market Volume (K Tons), by Country 2024 & 2032
- Figure 57: North America Rail Composites Market Revenue Share (%), by Country 2024 & 2032
- Figure 58: North America Rail Composites Market Volume Share (%), by Country 2024 & 2032
- Figure 59: Europe Rail Composites Market Revenue (Million), by Resin Type 2024 & 2032
- Figure 60: Europe Rail Composites Market Volume (K Tons), by Resin Type 2024 & 2032
- Figure 61: Europe Rail Composites Market Revenue Share (%), by Resin Type 2024 & 2032
- Figure 62: Europe Rail Composites Market Volume Share (%), by Resin Type 2024 & 2032
- Figure 63: Europe Rail Composites Market Revenue (Million), by Fiber Type 2024 & 2032
- Figure 64: Europe Rail Composites Market Volume (K Tons), by Fiber Type 2024 & 2032
- Figure 65: Europe Rail Composites Market Revenue Share (%), by Fiber Type 2024 & 2032
- Figure 66: Europe Rail Composites Market Volume Share (%), by Fiber Type 2024 & 2032
- Figure 67: Europe Rail Composites Market Revenue (Million), by Application 2024 & 2032
- Figure 68: Europe Rail Composites Market Volume (K Tons), by Application 2024 & 2032
- Figure 69: Europe Rail Composites Market Revenue Share (%), by Application 2024 & 2032
- Figure 70: Europe Rail Composites Market Volume Share (%), by Application 2024 & 2032
- Figure 71: Europe Rail Composites Market Revenue (Million), by Country 2024 & 2032
- Figure 72: Europe Rail Composites Market Volume (K Tons), by Country 2024 & 2032
- Figure 73: Europe Rail Composites Market Revenue Share (%), by Country 2024 & 2032
- Figure 74: Europe Rail Composites Market Volume Share (%), by Country 2024 & 2032
- Figure 75: Rest of the World Rail Composites Market Revenue (Million), by Resin Type 2024 & 2032
- Figure 76: Rest of the World Rail Composites Market Volume (K Tons), by Resin Type 2024 & 2032
- Figure 77: Rest of the World Rail Composites Market Revenue Share (%), by Resin Type 2024 & 2032
- Figure 78: Rest of the World Rail Composites Market Volume Share (%), by Resin Type 2024 & 2032
- Figure 79: Rest of the World Rail Composites Market Revenue (Million), by Fiber Type 2024 & 2032
- Figure 80: Rest of the World Rail Composites Market Volume (K Tons), by Fiber Type 2024 & 2032
- Figure 81: Rest of the World Rail Composites Market Revenue Share (%), by Fiber Type 2024 & 2032
- Figure 82: Rest of the World Rail Composites Market Volume Share (%), by Fiber Type 2024 & 2032
- Figure 83: Rest of the World Rail Composites Market Revenue (Million), by Application 2024 & 2032
- Figure 84: Rest of the World Rail Composites Market Volume (K Tons), by Application 2024 & 2032
- Figure 85: Rest of the World Rail Composites Market Revenue Share (%), by Application 2024 & 2032
- Figure 86: Rest of the World Rail Composites Market Volume Share (%), by Application 2024 & 2032
- Figure 87: Rest of the World Rail Composites Market Revenue (Million), by Country 2024 & 2032
- Figure 88: Rest of the World Rail Composites Market Volume (K Tons), by Country 2024 & 2032
- Figure 89: Rest of the World Rail Composites Market Revenue Share (%), by Country 2024 & 2032
- Figure 90: Rest of the World Rail Composites Market Volume Share (%), by Country 2024 & 2032
List of Tables
- Table 1: Global Rail Composites Market Revenue Million Forecast, by Region 2019 & 2032
- Table 2: Global Rail Composites Market Volume K Tons Forecast, by Region 2019 & 2032
- Table 3: Global Rail Composites Market Revenue Million Forecast, by Resin Type 2019 & 2032
- Table 4: Global Rail Composites Market Volume K Tons Forecast, by Resin Type 2019 & 2032
- Table 5: Global Rail Composites Market Revenue Million Forecast, by Fiber Type 2019 & 2032
- Table 6: Global Rail Composites Market Volume K Tons Forecast, by Fiber Type 2019 & 2032
- Table 7: Global Rail Composites Market Revenue Million Forecast, by Application 2019 & 2032
- Table 8: Global Rail Composites Market Volume K Tons Forecast, by Application 2019 & 2032
- Table 9: Global Rail Composites Market Revenue Million Forecast, by Region 2019 & 2032
- Table 10: Global Rail Composites Market Volume K Tons Forecast, by Region 2019 & 2032
- Table 11: Global Rail Composites Market Revenue Million Forecast, by Country 2019 & 2032
- Table 12: Global Rail Composites Market Volume K Tons Forecast, by Country 2019 & 2032
- Table 13: United States Rail Composites Market Revenue (Million) Forecast, by Application 2019 & 2032
- Table 14: United States Rail Composites Market Volume (K Tons) Forecast, by Application 2019 & 2032
- Table 15: Canada Rail Composites Market Revenue (Million) Forecast, by Application 2019 & 2032
- Table 16: Canada Rail Composites Market Volume (K Tons) Forecast, by Application 2019 & 2032
- Table 17: Mexico Rail Composites Market Revenue (Million) Forecast, by Application 2019 & 2032
- Table 18: Mexico Rail Composites Market Volume (K Tons) Forecast, by Application 2019 & 2032
- Table 19: Global Rail Composites Market Revenue Million Forecast, by Country 2019 & 2032
- Table 20: Global Rail Composites Market Volume K Tons Forecast, by Country 2019 & 2032
- Table 21: Germany Rail Composites Market Revenue (Million) Forecast, by Application 2019 & 2032
- Table 22: Germany Rail Composites Market Volume (K Tons) Forecast, by Application 2019 & 2032
- Table 23: United Kingdom Rail Composites Market Revenue (Million) Forecast, by Application 2019 & 2032
- Table 24: United Kingdom Rail Composites Market Volume (K Tons) Forecast, by Application 2019 & 2032
- Table 25: France Rail Composites Market Revenue (Million) Forecast, by Application 2019 & 2032
- Table 26: France Rail Composites Market Volume (K Tons) Forecast, by Application 2019 & 2032
- Table 27: Spain Rail Composites Market Revenue (Million) Forecast, by Application 2019 & 2032
- Table 28: Spain Rail Composites Market Volume (K Tons) Forecast, by Application 2019 & 2032
- Table 29: Italy Rail Composites Market Revenue (Million) Forecast, by Application 2019 & 2032
- Table 30: Italy Rail Composites Market Volume (K Tons) Forecast, by Application 2019 & 2032
- Table 31: Spain Rail Composites Market Revenue (Million) Forecast, by Application 2019 & 2032
- Table 32: Spain Rail Composites Market Volume (K Tons) Forecast, by Application 2019 & 2032
- Table 33: Belgium Rail Composites Market Revenue (Million) Forecast, by Application 2019 & 2032
- Table 34: Belgium Rail Composites Market Volume (K Tons) Forecast, by Application 2019 & 2032
- Table 35: Netherland Rail Composites Market Revenue (Million) Forecast, by Application 2019 & 2032
- Table 36: Netherland Rail Composites Market Volume (K Tons) Forecast, by Application 2019 & 2032
- Table 37: Nordics Rail Composites Market Revenue (Million) Forecast, by Application 2019 & 2032
- Table 38: Nordics Rail Composites Market Volume (K Tons) Forecast, by Application 2019 & 2032
- Table 39: Rest of Europe Rail Composites Market Revenue (Million) Forecast, by Application 2019 & 2032
- Table 40: Rest of Europe Rail Composites Market Volume (K Tons) Forecast, by Application 2019 & 2032
- Table 41: Global Rail Composites Market Revenue Million Forecast, by Country 2019 & 2032
- Table 42: Global Rail Composites Market Volume K Tons Forecast, by Country 2019 & 2032
- Table 43: China Rail Composites Market Revenue (Million) Forecast, by Application 2019 & 2032
- Table 44: China Rail Composites Market Volume (K Tons) Forecast, by Application 2019 & 2032
- Table 45: Japan Rail Composites Market Revenue (Million) Forecast, by Application 2019 & 2032
- Table 46: Japan Rail Composites Market Volume (K Tons) Forecast, by Application 2019 & 2032
- Table 47: India Rail Composites Market Revenue (Million) Forecast, by Application 2019 & 2032
- Table 48: India Rail Composites Market Volume (K Tons) Forecast, by Application 2019 & 2032
- Table 49: South Korea Rail Composites Market Revenue (Million) Forecast, by Application 2019 & 2032
- Table 50: South Korea Rail Composites Market Volume (K Tons) Forecast, by Application 2019 & 2032
- Table 51: Southeast Asia Rail Composites Market Revenue (Million) Forecast, by Application 2019 & 2032
- Table 52: Southeast Asia Rail Composites Market Volume (K Tons) Forecast, by Application 2019 & 2032
- Table 53: Australia Rail Composites Market Revenue (Million) Forecast, by Application 2019 & 2032
- Table 54: Australia Rail Composites Market Volume (K Tons) Forecast, by Application 2019 & 2032
- Table 55: Indonesia Rail Composites Market Revenue (Million) Forecast, by Application 2019 & 2032
- Table 56: Indonesia Rail Composites Market Volume (K Tons) Forecast, by Application 2019 & 2032
- Table 57: Phillipes Rail Composites Market Revenue (Million) Forecast, by Application 2019 & 2032
- Table 58: Phillipes Rail Composites Market Volume (K Tons) Forecast, by Application 2019 & 2032
- Table 59: Singapore Rail Composites Market Revenue (Million) Forecast, by Application 2019 & 2032
- Table 60: Singapore Rail Composites Market Volume (K Tons) Forecast, by Application 2019 & 2032
- Table 61: Thailandc Rail Composites Market Revenue (Million) Forecast, by Application 2019 & 2032
- Table 62: Thailandc Rail Composites Market Volume (K Tons) Forecast, by Application 2019 & 2032
- Table 63: Rest of Asia Pacific Rail Composites Market Revenue (Million) Forecast, by Application 2019 & 2032
- Table 64: Rest of Asia Pacific Rail Composites Market Volume (K Tons) Forecast, by Application 2019 & 2032
- Table 65: Global Rail Composites Market Revenue Million Forecast, by Country 2019 & 2032
- Table 66: Global Rail Composites Market Volume K Tons Forecast, by Country 2019 & 2032
- Table 67: Brazil Rail Composites Market Revenue (Million) Forecast, by Application 2019 & 2032
- Table 68: Brazil Rail Composites Market Volume (K Tons) Forecast, by Application 2019 & 2032
- Table 69: Argentina Rail Composites Market Revenue (Million) Forecast, by Application 2019 & 2032
- Table 70: Argentina Rail Composites Market Volume (K Tons) Forecast, by Application 2019 & 2032
- Table 71: Peru Rail Composites Market Revenue (Million) Forecast, by Application 2019 & 2032
- Table 72: Peru Rail Composites Market Volume (K Tons) Forecast, by Application 2019 & 2032
- Table 73: Chile Rail Composites Market Revenue (Million) Forecast, by Application 2019 & 2032
- Table 74: Chile Rail Composites Market Volume (K Tons) Forecast, by Application 2019 & 2032
- Table 75: Colombia Rail Composites Market Revenue (Million) Forecast, by Application 2019 & 2032
- Table 76: Colombia Rail Composites Market Volume (K Tons) Forecast, by Application 2019 & 2032
- Table 77: Ecuador Rail Composites Market Revenue (Million) Forecast, by Application 2019 & 2032
- Table 78: Ecuador Rail Composites Market Volume (K Tons) Forecast, by Application 2019 & 2032
- Table 79: Venezuela Rail Composites Market Revenue (Million) Forecast, by Application 2019 & 2032
- Table 80: Venezuela Rail Composites Market Volume (K Tons) Forecast, by Application 2019 & 2032
- Table 81: Rest of South America Rail Composites Market Revenue (Million) Forecast, by Application 2019 & 2032
- Table 82: Rest of South America Rail Composites Market Volume (K Tons) Forecast, by Application 2019 & 2032
- Table 83: Global Rail Composites Market Revenue Million Forecast, by Country 2019 & 2032
- Table 84: Global Rail Composites Market Volume K Tons Forecast, by Country 2019 & 2032
- Table 85: United States Rail Composites Market Revenue (Million) Forecast, by Application 2019 & 2032
- Table 86: United States Rail Composites Market Volume (K Tons) Forecast, by Application 2019 & 2032
- Table 87: Canada Rail Composites Market Revenue (Million) Forecast, by Application 2019 & 2032
- Table 88: Canada Rail Composites Market Volume (K Tons) Forecast, by Application 2019 & 2032
- Table 89: Mexico Rail Composites Market Revenue (Million) Forecast, by Application 2019 & 2032
- Table 90: Mexico Rail Composites Market Volume (K Tons) Forecast, by Application 2019 & 2032
- Table 91: Global Rail Composites Market Revenue Million Forecast, by Country 2019 & 2032
- Table 92: Global Rail Composites Market Volume K Tons Forecast, by Country 2019 & 2032
- Table 93: United Arab Emirates Rail Composites Market Revenue (Million) Forecast, by Application 2019 & 2032
- Table 94: United Arab Emirates Rail Composites Market Volume (K Tons) Forecast, by Application 2019 & 2032
- Table 95: Saudi Arabia Rail Composites Market Revenue (Million) Forecast, by Application 2019 & 2032
- Table 96: Saudi Arabia Rail Composites Market Volume (K Tons) Forecast, by Application 2019 & 2032
- Table 97: South Africa Rail Composites Market Revenue (Million) Forecast, by Application 2019 & 2032
- Table 98: South Africa Rail Composites Market Volume (K Tons) Forecast, by Application 2019 & 2032
- Table 99: Rest of Middle East and Africa Rail Composites Market Revenue (Million) Forecast, by Application 2019 & 2032
- Table 100: Rest of Middle East and Africa Rail Composites Market Volume (K Tons) Forecast, by Application 2019 & 2032
- Table 101: Global Rail Composites Market Revenue Million Forecast, by Resin Type 2019 & 2032
- Table 102: Global Rail Composites Market Volume K Tons Forecast, by Resin Type 2019 & 2032
- Table 103: Global Rail Composites Market Revenue Million Forecast, by Fiber Type 2019 & 2032
- Table 104: Global Rail Composites Market Volume K Tons Forecast, by Fiber Type 2019 & 2032
- Table 105: Global Rail Composites Market Revenue Million Forecast, by Application 2019 & 2032
- Table 106: Global Rail Composites Market Volume K Tons Forecast, by Application 2019 & 2032
- Table 107: Global Rail Composites Market Revenue Million Forecast, by Country 2019 & 2032
- Table 108: Global Rail Composites Market Volume K Tons Forecast, by Country 2019 & 2032
- Table 109: China Rail Composites Market Revenue (Million) Forecast, by Application 2019 & 2032
- Table 110: China Rail Composites Market Volume (K Tons) Forecast, by Application 2019 & 2032
- Table 111: India Rail Composites Market Revenue (Million) Forecast, by Application 2019 & 2032
- Table 112: India Rail Composites Market Volume (K Tons) Forecast, by Application 2019 & 2032
- Table 113: Japan Rail Composites Market Revenue (Million) Forecast, by Application 2019 & 2032
- Table 114: Japan Rail Composites Market Volume (K Tons) Forecast, by Application 2019 & 2032
- Table 115: South Korea Rail Composites Market Revenue (Million) Forecast, by Application 2019 & 2032
- Table 116: South Korea Rail Composites Market Volume (K Tons) Forecast, by Application 2019 & 2032
- Table 117: Rest of Asia Pacific Rail Composites Market Revenue (Million) Forecast, by Application 2019 & 2032
- Table 118: Rest of Asia Pacific Rail Composites Market Volume (K Tons) Forecast, by Application 2019 & 2032
- Table 119: Global Rail Composites Market Revenue Million Forecast, by Resin Type 2019 & 2032
- Table 120: Global Rail Composites Market Volume K Tons Forecast, by Resin Type 2019 & 2032
- Table 121: Global Rail Composites Market Revenue Million Forecast, by Fiber Type 2019 & 2032
- Table 122: Global Rail Composites Market Volume K Tons Forecast, by Fiber Type 2019 & 2032
- Table 123: Global Rail Composites Market Revenue Million Forecast, by Application 2019 & 2032
- Table 124: Global Rail Composites Market Volume K Tons Forecast, by Application 2019 & 2032
- Table 125: Global Rail Composites Market Revenue Million Forecast, by Country 2019 & 2032
- Table 126: Global Rail Composites Market Volume K Tons Forecast, by Country 2019 & 2032
- Table 127: United States Rail Composites Market Revenue (Million) Forecast, by Application 2019 & 2032
- Table 128: United States Rail Composites Market Volume (K Tons) Forecast, by Application 2019 & 2032
- Table 129: Canada Rail Composites Market Revenue (Million) Forecast, by Application 2019 & 2032
- Table 130: Canada Rail Composites Market Volume (K Tons) Forecast, by Application 2019 & 2032
- Table 131: Mexico Rail Composites Market Revenue (Million) Forecast, by Application 2019 & 2032
- Table 132: Mexico Rail Composites Market Volume (K Tons) Forecast, by Application 2019 & 2032
- Table 133: Global Rail Composites Market Revenue Million Forecast, by Resin Type 2019 & 2032
- Table 134: Global Rail Composites Market Volume K Tons Forecast, by Resin Type 2019 & 2032
- Table 135: Global Rail Composites Market Revenue Million Forecast, by Fiber Type 2019 & 2032
- Table 136: Global Rail Composites Market Volume K Tons Forecast, by Fiber Type 2019 & 2032
- Table 137: Global Rail Composites Market Revenue Million Forecast, by Application 2019 & 2032
- Table 138: Global Rail Composites Market Volume K Tons Forecast, by Application 2019 & 2032
- Table 139: Global Rail Composites Market Revenue Million Forecast, by Country 2019 & 2032
- Table 140: Global Rail Composites Market Volume K Tons Forecast, by Country 2019 & 2032
- Table 141: Germany Rail Composites Market Revenue (Million) Forecast, by Application 2019 & 2032
- Table 142: Germany Rail Composites Market Volume (K Tons) Forecast, by Application 2019 & 2032
- Table 143: United Kingdom Rail Composites Market Revenue (Million) Forecast, by Application 2019 & 2032
- Table 144: United Kingdom Rail Composites Market Volume (K Tons) Forecast, by Application 2019 & 2032
- Table 145: Italy Rail Composites Market Revenue (Million) Forecast, by Application 2019 & 2032
- Table 146: Italy Rail Composites Market Volume (K Tons) Forecast, by Application 2019 & 2032
- Table 147: France Rail Composites Market Revenue (Million) Forecast, by Application 2019 & 2032
- Table 148: France Rail Composites Market Volume (K Tons) Forecast, by Application 2019 & 2032
- Table 149: Rest of Europe Rail Composites Market Revenue (Million) Forecast, by Application 2019 & 2032
- Table 150: Rest of Europe Rail Composites Market Volume (K Tons) Forecast, by Application 2019 & 2032
- Table 151: Global Rail Composites Market Revenue Million Forecast, by Resin Type 2019 & 2032
- Table 152: Global Rail Composites Market Volume K Tons Forecast, by Resin Type 2019 & 2032
- Table 153: Global Rail Composites Market Revenue Million Forecast, by Fiber Type 2019 & 2032
- Table 154: Global Rail Composites Market Volume K Tons Forecast, by Fiber Type 2019 & 2032
- Table 155: Global Rail Composites Market Revenue Million Forecast, by Application 2019 & 2032
- Table 156: Global Rail Composites Market Volume K Tons Forecast, by Application 2019 & 2032
- Table 157: Global Rail Composites Market Revenue Million Forecast, by Country 2019 & 2032
- Table 158: Global Rail Composites Market Volume K Tons Forecast, by Country 2019 & 2032
Frequently Asked Questions
1. What is the projected Compound Annual Growth Rate (CAGR) of the Rail Composites Market?
The projected CAGR is approximately > 5.00%.
2. Which companies are prominent players in the Rail Composites Market?
Key companies in the market include Solvay, Celanese Corporation, Avient Corporation, Reliance Industries Limited, Exel Composites, LANXESS, BASF SE, Kineco Limited, Toray Industries Inc , Hexcel Corporation, Gurit, TEIJIN LIMITED, Mitsubishi Chemical Advanced Materials.
3. What are the main segments of the Rail Composites Market?
The market segments include Resin Type, Fiber Type, Application.
4. Can you provide details about the market size?
The market size is estimated to be USD XX Million as of 2022.
5. What are some drivers contributing to market growth?
Increasing Railway Projects in the Asia-Pacific Region; Rapidly Increasing Demand for High-speed Rail.
6. What are the notable trends driving market growth?
Exterior Application to Dominate the Market.
7. Are there any restraints impacting market growth?
Lack of Railway Infrastructure in Vietnam. Indonesia. and Thailand; Restrictions on Composite Materials for Railway Application.
8. Can you provide examples of recent developments in the market?
In May 2021, Celanese announced its plan to initiate a three-year plan to expand its LFT (long-fiber thermoplastics ) capacity in Nanjing, China. This is expected to be completed by the second half of 2023.
9. What pricing options are available for accessing the report?
Pricing options include single-user, multi-user, and enterprise licenses priced at USD 4750, USD 5250, and USD 8750 respectively.
10. Is the market size provided in terms of value or volume?
The market size is provided in terms of value, measured in Million and volume, measured in K Tons.
11. Are there any specific market keywords associated with the report?
Yes, the market keyword associated with the report is "Rail Composites Market," which aids in identifying and referencing the specific market segment covered.
12. How do I determine which pricing option suits my needs best?
The pricing options vary based on user requirements and access needs. Individual users may opt for single-user licenses, while businesses requiring broader access may choose multi-user or enterprise licenses for cost-effective access to the report.
13. Are there any additional resources or data provided in the Rail Composites Market report?
While the report offers comprehensive insights, it's advisable to review the specific contents or supplementary materials provided to ascertain if additional resources or data are available.
14. How can I stay updated on further developments or reports in the Rail Composites Market?
To stay informed about further developments, trends, and reports in the Rail Composites Market, consider subscribing to industry newsletters, following relevant companies and organizations, or regularly checking reputable industry news sources and publications.
Methodology
Step 1 - Identification of Relevant Samples Size from Population Database


Step 2 - Approaches for Defining Global Market Size (Value, Volume* & Price*)

Note*: In applicable scenarios
Step 3 - Data Sources
Primary Research
- Web Analytics
- Survey Reports
- Research Institute
- Latest Research Reports
- Opinion Leaders
Secondary Research
- Annual Reports
- White Paper
- Latest Press Release
- Industry Association
- Paid Database
- Investor Presentations

Step 4 - Data Triangulation
Involves using different sources of information in order to increase the validity of a study
These sources are likely to be stakeholders in a program - participants, other researchers, program staff, other community members, and so on.
Then we put all data in single framework & apply various statistical tools to find out the dynamic on the market.
During the analysis stage, feedback from the stakeholder groups would be compared to determine areas of agreement as well as areas of divergence
