

Key Insights
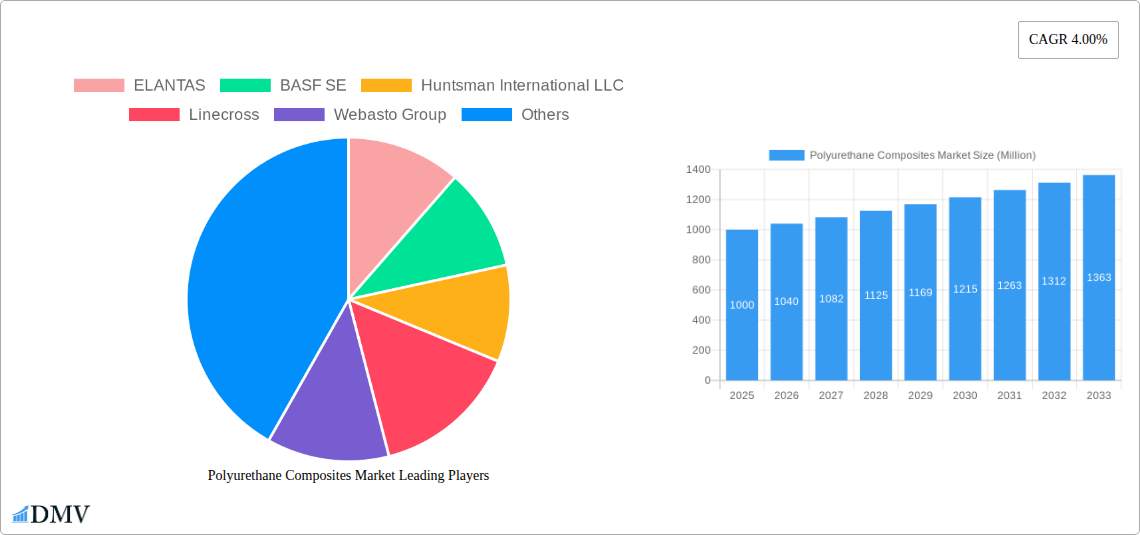
The global polyurethane composites market is experiencing steady growth, projected to maintain a Compound Annual Growth Rate (CAGR) of 4.00% from 2025 to 2033. This expansion is driven by several key factors. The increasing demand for lightweight yet durable materials in the transportation sector, particularly in automobiles and aerospace, is a significant catalyst. The construction industry's adoption of polyurethane composites for insulation and structural components also contributes significantly to market growth. Furthermore, the rising popularity of renewable energy sources, especially wind energy, fuels demand for these composites in turbine blades and other components. Technological advancements leading to improved mechanical properties, enhanced durability, and cost-effectiveness of polyurethane composites further enhance their market appeal. While the market faces certain restraints, such as the volatility of raw material prices and environmental concerns related to production, the overall positive outlook is sustained by the continuous innovation and development of new applications across various industries.
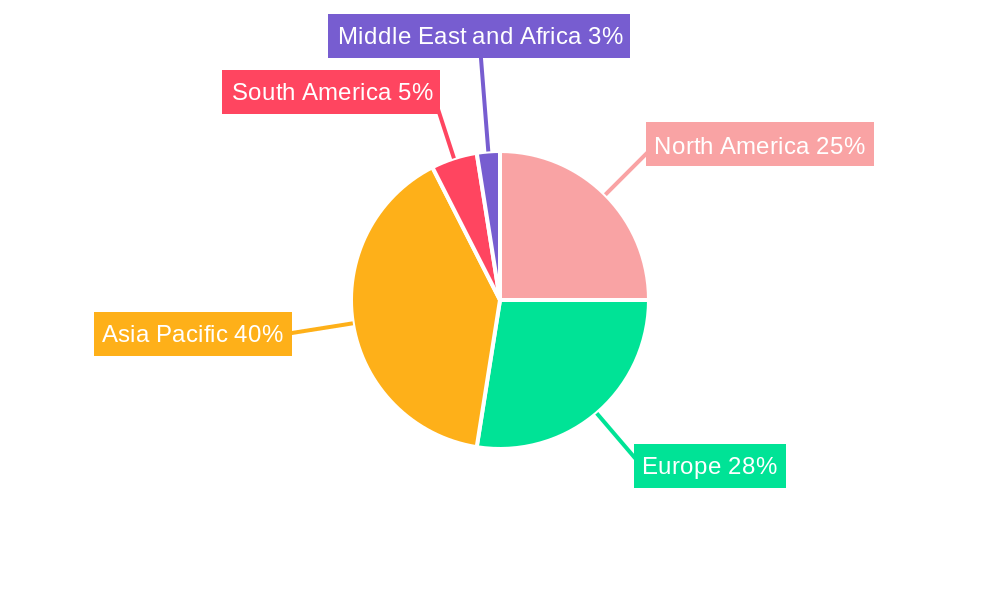
The market segmentation reveals a strong preference for glass fiber-reinforced polyurethane composites, owing to their cost-effectiveness and widespread availability. However, carbon fiber-reinforced polyurethane composites are gaining traction, driven by their superior strength-to-weight ratio, making them particularly attractive for high-performance applications. The Asia-Pacific region, driven by robust infrastructure development and industrialization, particularly in China and India, represents a significant market share. North America and Europe also contribute substantially, largely fueled by established automotive and construction sectors. Key players like ELANTAS, BASF SE, Huntsman International LLC, and others are investing heavily in research and development to innovate and expand their product portfolio to cater to the evolving market demands. The market's future trajectory suggests continued growth, driven by technological advancements and the increasing adoption of polyurethane composites across diverse sectors.
Polyurethane Composites Market: A Comprehensive Report (2019-2033)
This insightful report delivers a comprehensive analysis of the global Polyurethane Composites market, offering a detailed forecast from 2025 to 2033, built upon historical data from 2019 to 2024. It provides crucial insights for stakeholders seeking to understand market dynamics, identify growth opportunities, and make strategic decisions in this rapidly evolving sector. The report covers key segments, including By Fiber Type (Glass, Carbon, Others) and By End-user Industry (Transportation, Building & Construction, Electrical & Electronics, Wind Energy, Others), and profiles leading players such as ELANTAS, BASF SE, Huntsman International LLC, Linecross, Webasto Group, Henkel Corporation, and Covestro AG. The estimated market value in 2025 is projected to be xx Million.
Polyurethane Composites Market Composition & Trends
This section meticulously examines the competitive landscape of the Polyurethane Composites market, offering a granular understanding of its structure and trajectory. We delve into market concentration, analyzing market share distribution among key players, revealing which companies hold significant influence. Furthermore, the report explores the innovative forces shaping the market, analyzing technological advancements and their impact on product development and market adoption. Regulatory landscapes and their influence on market growth are also carefully considered, including an assessment of existing and anticipated regulations' impact on manufacturing processes and product applications. The analysis also accounts for substitute products and their potential to disrupt market share. The report also includes an examination of end-user profiles and their evolving needs, influencing the demand for polyurethane composites. Finally, the impact of mergers and acquisitions (M&A) activities is assessed, including an analysis of deal values and their effect on market consolidation.
- Market Share Distribution: Detailed breakdown of market share amongst key players in 2025.
- M&A Activity: Analysis of key M&A deals (2019-2024), including deal values and their implications.
- Innovation Catalysts: Exploration of emerging technologies and their influence on market growth.
- Regulatory Landscape: Assessment of current and future regulations impacting market dynamics.
- Substitute Products: Analysis of competing materials and their potential market impact.
Polyurethane Composites Market Industry Evolution
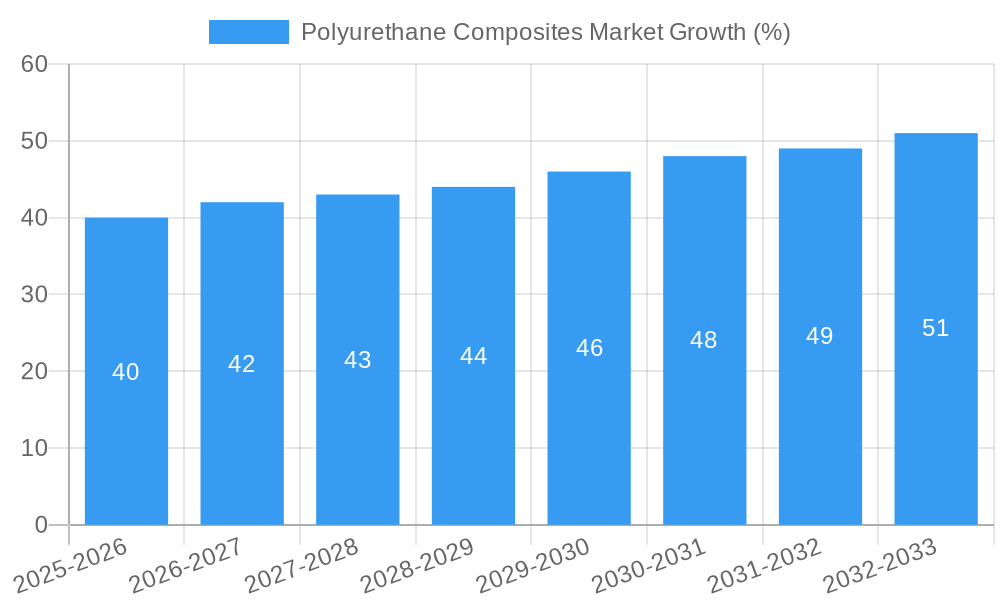
This section offers a detailed historical and projected analysis of the polyurethane composites market's growth trajectory. We examine the past performance (2019-2024) and project the market's future growth (2025-2033), identifying key factors driving expansion and potential challenges. The analysis encompasses technological advancements, such as the development of high-performance composites and improved manufacturing processes, and their subsequent influence on market growth rates and product adoption. We also explore the shifting consumer demands, specifically focusing on sustainability concerns and the increasing preference for lightweight, high-strength materials. This section integrates specific data points such as compound annual growth rates (CAGR) and adoption rates across various end-use sectors.
Leading Regions, Countries, or Segments in Polyurethane Composites Market
This section pinpoints the leading regions, countries, and market segments within the Polyurethane Composites market. We analyze the key factors driving dominance in each segment, providing a detailed understanding of market concentration and growth potential.
By Fiber Type:
- Glass Fiber: High volume usage driven by cost-effectiveness and established manufacturing processes. Investment trends in glass fiber production facilities in [Region/Country] are contributing to the market share.
- Carbon Fiber: Premium segment driven by high strength-to-weight ratio, demanding applications in aerospace and automotive. Government support for carbon fiber research and development in [Region/Country] is fueling growth.
- Others (Aramid, Basalt etc.): Niche applications with specialized properties. Growing demand for [Specific Application] is driving growth in this segment.
By End-user Industry:
- Transportation: Largest segment due to lightweighting demands in automotive and aerospace sectors. Stringent fuel efficiency regulations in [Region/Country] are boosting demand.
- Building & Construction: Growing adoption in infrastructure projects due to durability and insulation properties. Government initiatives for sustainable construction in [Region/Country] are driving the market.
- Electrical & Electronics: Demand driven by miniaturization and improved thermal management in electronic devices. Increased investment in [Specific Application] is fueling segment growth.
- Wind Energy: High demand for lightweight and durable materials in wind turbine blades. Growing renewable energy adoption globally is boosting the segment.
Polyurethane Composites Market Product Innovations
Recent years have witnessed significant advancements in polyurethane composite materials, leading to the development of products with enhanced properties. Innovations include the integration of nanomaterials to improve mechanical strength and thermal stability. These advancements have expanded the applications of polyurethane composites into previously inaccessible markets, such as high-temperature environments and high-stress applications. This is reflected in improved performance metrics, including increased tensile strength, improved impact resistance, and better fatigue life. Unique selling propositions, like enhanced durability and reduced weight, are driving market adoption.
Propelling Factors for Polyurethane Composites Market Growth
The polyurethane composites market is experiencing substantial growth driven by several key factors. Technological advancements resulting in lighter, stronger, and more versatile materials are at the forefront, alongside the increasing demand from various industries for materials with superior performance characteristics. Furthermore, supportive government policies and regulations promoting sustainable materials are significantly impacting market expansion. The growing global infrastructure development, particularly in emerging economies, is creating significant opportunities.
Obstacles in the Polyurethane Composites Market
Despite significant growth potential, the polyurethane composites market faces certain challenges. Fluctuations in raw material prices and supply chain disruptions can impact production costs and market stability. Furthermore, stringent environmental regulations require manufacturers to adopt sustainable manufacturing processes, adding to the operational costs. Intense competition amongst established players and new entrants also creates pressure on pricing and profitability. These combined factors can constrain market growth.
Future Opportunities in Polyurethane Composites Market
The future of the polyurethane composites market holds significant promise. Emerging applications in areas such as 3D printing and advanced manufacturing present exciting opportunities for market expansion. Furthermore, the ongoing research and development into novel polyurethane chemistries and composite designs are likely to lead to even more advanced materials with superior performance characteristics. Increased focus on sustainability and circular economy principles will drive demand for eco-friendly polyurethane composites.
Major Players in the Polyurethane Composites Market Ecosystem
Key Developments in Polyurethane Composites Market Industry
- January 2023: Covestro launched a new bio-based polyurethane composite material.
- March 2022: BASF acquired a smaller polyurethane composite manufacturer, expanding its market share.
- October 2021: Huntsman announced a new partnership for the development of sustainable polyurethane composites.
Strategic Polyurethane Composites Market Forecast
The polyurethane composites market is poised for robust growth over the forecast period (2025-2033), driven by a confluence of factors including technological advancements, increasing demand from diverse end-use sectors, and supportive government policies. The market's potential is substantial, with opportunities arising from emerging applications and the development of innovative materials. Continued research and development, combined with a focus on sustainability, will further fuel market expansion.
Polyurethane Composites Market Segmentation
-
1. Fiber Type
- 1.1. Glass
- 1.2. Carbon
- 1.3. Others
-
2. End-user Industry
- 2.1. Transportation
- 2.2. Building & Construction
- 2.3. Electrical & Electronics
- 2.4. Wind Energy
- 2.5. Others
Polyurethane Composites Market Segmentation By Geography
-
1. Asia Pacific
- 1.1. China
- 1.2. India
- 1.3. Japan
- 1.4. South Korea
- 1.5. Rest of Asia Pacific
-
2. North America
- 2.1. United States
- 2.2. Canada
- 2.3. Mexico
-
3. Europe
- 3.1. Germany
- 3.2. United Kingdom
- 3.3. Italy
- 3.4. France
- 3.5. Rest of Europe
-
4. South America
- 4.1. Brazil
- 4.2. Argentina
- 4.3. Rest of South America
-
5. Middle East and Africa
- 5.1. Saudi Arabia
- 5.2. South Africa
- 5.3. Rest of Middle East and Africa
Polyurethane Composites Market REPORT HIGHLIGHTS
| Aspects | Details |
|---|---|
| Study Period | 2019-2033 |
| Base Year | 2024 |
| Estimated Year | 2025 |
| Forecast Period | 2025-2033 |
| Historical Period | 2019-2024 |
| Growth Rate | CAGR of 4.00% from 2019-2033 |
| Segmentation |
|
Table of Contents
- 1. Introduction
- 1.1. Research Scope
- 1.2. Market Segmentation
- 1.3. Research Methodology
- 1.4. Definitions and Assumptions
- 2. Executive Summary
- 2.1. Introduction
- 3. Market Dynamics
- 3.1. Introduction
- 3.2. Market Drivers
- 3.2.1. ; Increasing Demand for the Lightweight Materials From the Transportation Industry; Growing Demand from the Building and Construction Industry
- 3.3. Market Restrains
- 3.3.1. ; Slowdown in the Global Automotive Production; High Production Costs
- 3.4. Market Trends
- 3.4.1. Increasing demand from the Transportation Industry
- 4. Market Factor Analysis
- 4.1. Porters Five Forces
- 4.2. Supply/Value Chain
- 4.3. PESTEL analysis
- 4.4. Market Entropy
- 4.5. Patent/Trademark Analysis
- 5. Global Polyurethane Composites Market Analysis, Insights and Forecast, 2019-2031
- 5.1. Market Analysis, Insights and Forecast - by Fiber Type
- 5.1.1. Glass
- 5.1.2. Carbon
- 5.1.3. Others
- 5.2. Market Analysis, Insights and Forecast - by End-user Industry
- 5.2.1. Transportation
- 5.2.2. Building & Construction
- 5.2.3. Electrical & Electronics
- 5.2.4. Wind Energy
- 5.2.5. Others
- 5.3. Market Analysis, Insights and Forecast - by Region
- 5.3.1. Asia Pacific
- 5.3.2. North America
- 5.3.3. Europe
- 5.3.4. South America
- 5.3.5. Middle East and Africa
- 5.1. Market Analysis, Insights and Forecast - by Fiber Type
- 6. Asia Pacific Polyurethane Composites Market Analysis, Insights and Forecast, 2019-2031
- 6.1. Market Analysis, Insights and Forecast - by Fiber Type
- 6.1.1. Glass
- 6.1.2. Carbon
- 6.1.3. Others
- 6.2. Market Analysis, Insights and Forecast - by End-user Industry
- 6.2.1. Transportation
- 6.2.2. Building & Construction
- 6.2.3. Electrical & Electronics
- 6.2.4. Wind Energy
- 6.2.5. Others
- 6.1. Market Analysis, Insights and Forecast - by Fiber Type
- 7. North America Polyurethane Composites Market Analysis, Insights and Forecast, 2019-2031
- 7.1. Market Analysis, Insights and Forecast - by Fiber Type
- 7.1.1. Glass
- 7.1.2. Carbon
- 7.1.3. Others
- 7.2. Market Analysis, Insights and Forecast - by End-user Industry
- 7.2.1. Transportation
- 7.2.2. Building & Construction
- 7.2.3. Electrical & Electronics
- 7.2.4. Wind Energy
- 7.2.5. Others
- 7.1. Market Analysis, Insights and Forecast - by Fiber Type
- 8. Europe Polyurethane Composites Market Analysis, Insights and Forecast, 2019-2031
- 8.1. Market Analysis, Insights and Forecast - by Fiber Type
- 8.1.1. Glass
- 8.1.2. Carbon
- 8.1.3. Others
- 8.2. Market Analysis, Insights and Forecast - by End-user Industry
- 8.2.1. Transportation
- 8.2.2. Building & Construction
- 8.2.3. Electrical & Electronics
- 8.2.4. Wind Energy
- 8.2.5. Others
- 8.1. Market Analysis, Insights and Forecast - by Fiber Type
- 9. South America Polyurethane Composites Market Analysis, Insights and Forecast, 2019-2031
- 9.1. Market Analysis, Insights and Forecast - by Fiber Type
- 9.1.1. Glass
- 9.1.2. Carbon
- 9.1.3. Others
- 9.2. Market Analysis, Insights and Forecast - by End-user Industry
- 9.2.1. Transportation
- 9.2.2. Building & Construction
- 9.2.3. Electrical & Electronics
- 9.2.4. Wind Energy
- 9.2.5. Others
- 9.1. Market Analysis, Insights and Forecast - by Fiber Type
- 10. Middle East and Africa Polyurethane Composites Market Analysis, Insights and Forecast, 2019-2031
- 10.1. Market Analysis, Insights and Forecast - by Fiber Type
- 10.1.1. Glass
- 10.1.2. Carbon
- 10.1.3. Others
- 10.2. Market Analysis, Insights and Forecast - by End-user Industry
- 10.2.1. Transportation
- 10.2.2. Building & Construction
- 10.2.3. Electrical & Electronics
- 10.2.4. Wind Energy
- 10.2.5. Others
- 10.1. Market Analysis, Insights and Forecast - by Fiber Type
- 11. Asia Pacific Polyurethane Composites Market Analysis, Insights and Forecast, 2019-2031
- 11.1. Market Analysis, Insights and Forecast - By Country/Sub-region
- 11.1.1 China
- 11.1.2 India
- 11.1.3 Japan
- 11.1.4 South Korea
- 11.1.5 Rest of Asia Pacific
- 12. North America Polyurethane Composites Market Analysis, Insights and Forecast, 2019-2031
- 12.1. Market Analysis, Insights and Forecast - By Country/Sub-region
- 12.1.1 United States
- 12.1.2 Canada
- 12.1.3 Mexico
- 13. Europe Polyurethane Composites Market Analysis, Insights and Forecast, 2019-2031
- 13.1. Market Analysis, Insights and Forecast - By Country/Sub-region
- 13.1.1 Germany
- 13.1.2 United Kingdom
- 13.1.3 Italy
- 13.1.4 France
- 13.1.5 Rest of Europe
- 14. South America Polyurethane Composites Market Analysis, Insights and Forecast, 2019-2031
- 14.1. Market Analysis, Insights and Forecast - By Country/Sub-region
- 14.1.1 Brazil
- 14.1.2 Argentina
- 14.1.3 Rest of South America
- 15. Middle East and Africa Polyurethane Composites Market Analysis, Insights and Forecast, 2019-2031
- 15.1. Market Analysis, Insights and Forecast - By Country/Sub-region
- 15.1.1 Saudi Arabia
- 15.1.2 South Africa
- 15.1.3 Rest of Middle East and Africa
- 16. Competitive Analysis
- 16.1. Global Market Share Analysis 2024
- 16.2. Company Profiles
- 16.2.1 ELANTAS
- 16.2.1.1. Overview
- 16.2.1.2. Products
- 16.2.1.3. SWOT Analysis
- 16.2.1.4. Recent Developments
- 16.2.1.5. Financials (Based on Availability)
- 16.2.2 BASF SE
- 16.2.2.1. Overview
- 16.2.2.2. Products
- 16.2.2.3. SWOT Analysis
- 16.2.2.4. Recent Developments
- 16.2.2.5. Financials (Based on Availability)
- 16.2.3 Huntsman International LLC
- 16.2.3.1. Overview
- 16.2.3.2. Products
- 16.2.3.3. SWOT Analysis
- 16.2.3.4. Recent Developments
- 16.2.3.5. Financials (Based on Availability)
- 16.2.4 Linecross
- 16.2.4.1. Overview
- 16.2.4.2. Products
- 16.2.4.3. SWOT Analysis
- 16.2.4.4. Recent Developments
- 16.2.4.5. Financials (Based on Availability)
- 16.2.5 Webasto Group
- 16.2.5.1. Overview
- 16.2.5.2. Products
- 16.2.5.3. SWOT Analysis
- 16.2.5.4. Recent Developments
- 16.2.5.5. Financials (Based on Availability)
- 16.2.6 Henkel Corporation
- 16.2.6.1. Overview
- 16.2.6.2. Products
- 16.2.6.3. SWOT Analysis
- 16.2.6.4. Recent Developments
- 16.2.6.5. Financials (Based on Availability)
- 16.2.7 Covestro AG
- 16.2.7.1. Overview
- 16.2.7.2. Products
- 16.2.7.3. SWOT Analysis
- 16.2.7.4. Recent Developments
- 16.2.7.5. Financials (Based on Availability)
- 16.2.1 ELANTAS
List of Figures
- Figure 1: Global Polyurethane Composites Market Revenue Breakdown (Million, %) by Region 2024 & 2032
- Figure 2: Global Polyurethane Composites Market Volume Breakdown (grams per cubic centimeter , %) by Region 2024 & 2032
- Figure 3: Asia Pacific Polyurethane Composites Market Revenue (Million), by Country 2024 & 2032
- Figure 4: Asia Pacific Polyurethane Composites Market Volume (grams per cubic centimeter ), by Country 2024 & 2032
- Figure 5: Asia Pacific Polyurethane Composites Market Revenue Share (%), by Country 2024 & 2032
- Figure 6: Asia Pacific Polyurethane Composites Market Volume Share (%), by Country 2024 & 2032
- Figure 7: North America Polyurethane Composites Market Revenue (Million), by Country 2024 & 2032
- Figure 8: North America Polyurethane Composites Market Volume (grams per cubic centimeter ), by Country 2024 & 2032
- Figure 9: North America Polyurethane Composites Market Revenue Share (%), by Country 2024 & 2032
- Figure 10: North America Polyurethane Composites Market Volume Share (%), by Country 2024 & 2032
- Figure 11: Europe Polyurethane Composites Market Revenue (Million), by Country 2024 & 2032
- Figure 12: Europe Polyurethane Composites Market Volume (grams per cubic centimeter ), by Country 2024 & 2032
- Figure 13: Europe Polyurethane Composites Market Revenue Share (%), by Country 2024 & 2032
- Figure 14: Europe Polyurethane Composites Market Volume Share (%), by Country 2024 & 2032
- Figure 15: South America Polyurethane Composites Market Revenue (Million), by Country 2024 & 2032
- Figure 16: South America Polyurethane Composites Market Volume (grams per cubic centimeter ), by Country 2024 & 2032
- Figure 17: South America Polyurethane Composites Market Revenue Share (%), by Country 2024 & 2032
- Figure 18: South America Polyurethane Composites Market Volume Share (%), by Country 2024 & 2032
- Figure 19: Middle East and Africa Polyurethane Composites Market Revenue (Million), by Country 2024 & 2032
- Figure 20: Middle East and Africa Polyurethane Composites Market Volume (grams per cubic centimeter ), by Country 2024 & 2032
- Figure 21: Middle East and Africa Polyurethane Composites Market Revenue Share (%), by Country 2024 & 2032
- Figure 22: Middle East and Africa Polyurethane Composites Market Volume Share (%), by Country 2024 & 2032
- Figure 23: Asia Pacific Polyurethane Composites Market Revenue (Million), by Fiber Type 2024 & 2032
- Figure 24: Asia Pacific Polyurethane Composites Market Volume (grams per cubic centimeter ), by Fiber Type 2024 & 2032
- Figure 25: Asia Pacific Polyurethane Composites Market Revenue Share (%), by Fiber Type 2024 & 2032
- Figure 26: Asia Pacific Polyurethane Composites Market Volume Share (%), by Fiber Type 2024 & 2032
- Figure 27: Asia Pacific Polyurethane Composites Market Revenue (Million), by End-user Industry 2024 & 2032
- Figure 28: Asia Pacific Polyurethane Composites Market Volume (grams per cubic centimeter ), by End-user Industry 2024 & 2032
- Figure 29: Asia Pacific Polyurethane Composites Market Revenue Share (%), by End-user Industry 2024 & 2032
- Figure 30: Asia Pacific Polyurethane Composites Market Volume Share (%), by End-user Industry 2024 & 2032
- Figure 31: Asia Pacific Polyurethane Composites Market Revenue (Million), by Country 2024 & 2032
- Figure 32: Asia Pacific Polyurethane Composites Market Volume (grams per cubic centimeter ), by Country 2024 & 2032
- Figure 33: Asia Pacific Polyurethane Composites Market Revenue Share (%), by Country 2024 & 2032
- Figure 34: Asia Pacific Polyurethane Composites Market Volume Share (%), by Country 2024 & 2032
- Figure 35: North America Polyurethane Composites Market Revenue (Million), by Fiber Type 2024 & 2032
- Figure 36: North America Polyurethane Composites Market Volume (grams per cubic centimeter ), by Fiber Type 2024 & 2032
- Figure 37: North America Polyurethane Composites Market Revenue Share (%), by Fiber Type 2024 & 2032
- Figure 38: North America Polyurethane Composites Market Volume Share (%), by Fiber Type 2024 & 2032
- Figure 39: North America Polyurethane Composites Market Revenue (Million), by End-user Industry 2024 & 2032
- Figure 40: North America Polyurethane Composites Market Volume (grams per cubic centimeter ), by End-user Industry 2024 & 2032
- Figure 41: North America Polyurethane Composites Market Revenue Share (%), by End-user Industry 2024 & 2032
- Figure 42: North America Polyurethane Composites Market Volume Share (%), by End-user Industry 2024 & 2032
- Figure 43: North America Polyurethane Composites Market Revenue (Million), by Country 2024 & 2032
- Figure 44: North America Polyurethane Composites Market Volume (grams per cubic centimeter ), by Country 2024 & 2032
- Figure 45: North America Polyurethane Composites Market Revenue Share (%), by Country 2024 & 2032
- Figure 46: North America Polyurethane Composites Market Volume Share (%), by Country 2024 & 2032
- Figure 47: Europe Polyurethane Composites Market Revenue (Million), by Fiber Type 2024 & 2032
- Figure 48: Europe Polyurethane Composites Market Volume (grams per cubic centimeter ), by Fiber Type 2024 & 2032
- Figure 49: Europe Polyurethane Composites Market Revenue Share (%), by Fiber Type 2024 & 2032
- Figure 50: Europe Polyurethane Composites Market Volume Share (%), by Fiber Type 2024 & 2032
- Figure 51: Europe Polyurethane Composites Market Revenue (Million), by End-user Industry 2024 & 2032
- Figure 52: Europe Polyurethane Composites Market Volume (grams per cubic centimeter ), by End-user Industry 2024 & 2032
- Figure 53: Europe Polyurethane Composites Market Revenue Share (%), by End-user Industry 2024 & 2032
- Figure 54: Europe Polyurethane Composites Market Volume Share (%), by End-user Industry 2024 & 2032
- Figure 55: Europe Polyurethane Composites Market Revenue (Million), by Country 2024 & 2032
- Figure 56: Europe Polyurethane Composites Market Volume (grams per cubic centimeter ), by Country 2024 & 2032
- Figure 57: Europe Polyurethane Composites Market Revenue Share (%), by Country 2024 & 2032
- Figure 58: Europe Polyurethane Composites Market Volume Share (%), by Country 2024 & 2032
- Figure 59: South America Polyurethane Composites Market Revenue (Million), by Fiber Type 2024 & 2032
- Figure 60: South America Polyurethane Composites Market Volume (grams per cubic centimeter ), by Fiber Type 2024 & 2032
- Figure 61: South America Polyurethane Composites Market Revenue Share (%), by Fiber Type 2024 & 2032
- Figure 62: South America Polyurethane Composites Market Volume Share (%), by Fiber Type 2024 & 2032
- Figure 63: South America Polyurethane Composites Market Revenue (Million), by End-user Industry 2024 & 2032
- Figure 64: South America Polyurethane Composites Market Volume (grams per cubic centimeter ), by End-user Industry 2024 & 2032
- Figure 65: South America Polyurethane Composites Market Revenue Share (%), by End-user Industry 2024 & 2032
- Figure 66: South America Polyurethane Composites Market Volume Share (%), by End-user Industry 2024 & 2032
- Figure 67: South America Polyurethane Composites Market Revenue (Million), by Country 2024 & 2032
- Figure 68: South America Polyurethane Composites Market Volume (grams per cubic centimeter ), by Country 2024 & 2032
- Figure 69: South America Polyurethane Composites Market Revenue Share (%), by Country 2024 & 2032
- Figure 70: South America Polyurethane Composites Market Volume Share (%), by Country 2024 & 2032
- Figure 71: Middle East and Africa Polyurethane Composites Market Revenue (Million), by Fiber Type 2024 & 2032
- Figure 72: Middle East and Africa Polyurethane Composites Market Volume (grams per cubic centimeter ), by Fiber Type 2024 & 2032
- Figure 73: Middle East and Africa Polyurethane Composites Market Revenue Share (%), by Fiber Type 2024 & 2032
- Figure 74: Middle East and Africa Polyurethane Composites Market Volume Share (%), by Fiber Type 2024 & 2032
- Figure 75: Middle East and Africa Polyurethane Composites Market Revenue (Million), by End-user Industry 2024 & 2032
- Figure 76: Middle East and Africa Polyurethane Composites Market Volume (grams per cubic centimeter ), by End-user Industry 2024 & 2032
- Figure 77: Middle East and Africa Polyurethane Composites Market Revenue Share (%), by End-user Industry 2024 & 2032
- Figure 78: Middle East and Africa Polyurethane Composites Market Volume Share (%), by End-user Industry 2024 & 2032
- Figure 79: Middle East and Africa Polyurethane Composites Market Revenue (Million), by Country 2024 & 2032
- Figure 80: Middle East and Africa Polyurethane Composites Market Volume (grams per cubic centimeter ), by Country 2024 & 2032
- Figure 81: Middle East and Africa Polyurethane Composites Market Revenue Share (%), by Country 2024 & 2032
- Figure 82: Middle East and Africa Polyurethane Composites Market Volume Share (%), by Country 2024 & 2032
List of Tables
- Table 1: Global Polyurethane Composites Market Revenue Million Forecast, by Region 2019 & 2032
- Table 2: Global Polyurethane Composites Market Volume grams per cubic centimeter Forecast, by Region 2019 & 2032
- Table 3: Global Polyurethane Composites Market Revenue Million Forecast, by Fiber Type 2019 & 2032
- Table 4: Global Polyurethane Composites Market Volume grams per cubic centimeter Forecast, by Fiber Type 2019 & 2032
- Table 5: Global Polyurethane Composites Market Revenue Million Forecast, by End-user Industry 2019 & 2032
- Table 6: Global Polyurethane Composites Market Volume grams per cubic centimeter Forecast, by End-user Industry 2019 & 2032
- Table 7: Global Polyurethane Composites Market Revenue Million Forecast, by Region 2019 & 2032
- Table 8: Global Polyurethane Composites Market Volume grams per cubic centimeter Forecast, by Region 2019 & 2032
- Table 9: Global Polyurethane Composites Market Revenue Million Forecast, by Country 2019 & 2032
- Table 10: Global Polyurethane Composites Market Volume grams per cubic centimeter Forecast, by Country 2019 & 2032
- Table 11: China Polyurethane Composites Market Revenue (Million) Forecast, by Application 2019 & 2032
- Table 12: China Polyurethane Composites Market Volume (grams per cubic centimeter ) Forecast, by Application 2019 & 2032
- Table 13: India Polyurethane Composites Market Revenue (Million) Forecast, by Application 2019 & 2032
- Table 14: India Polyurethane Composites Market Volume (grams per cubic centimeter ) Forecast, by Application 2019 & 2032
- Table 15: Japan Polyurethane Composites Market Revenue (Million) Forecast, by Application 2019 & 2032
- Table 16: Japan Polyurethane Composites Market Volume (grams per cubic centimeter ) Forecast, by Application 2019 & 2032
- Table 17: South Korea Polyurethane Composites Market Revenue (Million) Forecast, by Application 2019 & 2032
- Table 18: South Korea Polyurethane Composites Market Volume (grams per cubic centimeter ) Forecast, by Application 2019 & 2032
- Table 19: Rest of Asia Pacific Polyurethane Composites Market Revenue (Million) Forecast, by Application 2019 & 2032
- Table 20: Rest of Asia Pacific Polyurethane Composites Market Volume (grams per cubic centimeter ) Forecast, by Application 2019 & 2032
- Table 21: Global Polyurethane Composites Market Revenue Million Forecast, by Country 2019 & 2032
- Table 22: Global Polyurethane Composites Market Volume grams per cubic centimeter Forecast, by Country 2019 & 2032
- Table 23: United States Polyurethane Composites Market Revenue (Million) Forecast, by Application 2019 & 2032
- Table 24: United States Polyurethane Composites Market Volume (grams per cubic centimeter ) Forecast, by Application 2019 & 2032
- Table 25: Canada Polyurethane Composites Market Revenue (Million) Forecast, by Application 2019 & 2032
- Table 26: Canada Polyurethane Composites Market Volume (grams per cubic centimeter ) Forecast, by Application 2019 & 2032
- Table 27: Mexico Polyurethane Composites Market Revenue (Million) Forecast, by Application 2019 & 2032
- Table 28: Mexico Polyurethane Composites Market Volume (grams per cubic centimeter ) Forecast, by Application 2019 & 2032
- Table 29: Global Polyurethane Composites Market Revenue Million Forecast, by Country 2019 & 2032
- Table 30: Global Polyurethane Composites Market Volume grams per cubic centimeter Forecast, by Country 2019 & 2032
- Table 31: Germany Polyurethane Composites Market Revenue (Million) Forecast, by Application 2019 & 2032
- Table 32: Germany Polyurethane Composites Market Volume (grams per cubic centimeter ) Forecast, by Application 2019 & 2032
- Table 33: United Kingdom Polyurethane Composites Market Revenue (Million) Forecast, by Application 2019 & 2032
- Table 34: United Kingdom Polyurethane Composites Market Volume (grams per cubic centimeter ) Forecast, by Application 2019 & 2032
- Table 35: Italy Polyurethane Composites Market Revenue (Million) Forecast, by Application 2019 & 2032
- Table 36: Italy Polyurethane Composites Market Volume (grams per cubic centimeter ) Forecast, by Application 2019 & 2032
- Table 37: France Polyurethane Composites Market Revenue (Million) Forecast, by Application 2019 & 2032
- Table 38: France Polyurethane Composites Market Volume (grams per cubic centimeter ) Forecast, by Application 2019 & 2032
- Table 39: Rest of Europe Polyurethane Composites Market Revenue (Million) Forecast, by Application 2019 & 2032
- Table 40: Rest of Europe Polyurethane Composites Market Volume (grams per cubic centimeter ) Forecast, by Application 2019 & 2032
- Table 41: Global Polyurethane Composites Market Revenue Million Forecast, by Country 2019 & 2032
- Table 42: Global Polyurethane Composites Market Volume grams per cubic centimeter Forecast, by Country 2019 & 2032
- Table 43: Brazil Polyurethane Composites Market Revenue (Million) Forecast, by Application 2019 & 2032
- Table 44: Brazil Polyurethane Composites Market Volume (grams per cubic centimeter ) Forecast, by Application 2019 & 2032
- Table 45: Argentina Polyurethane Composites Market Revenue (Million) Forecast, by Application 2019 & 2032
- Table 46: Argentina Polyurethane Composites Market Volume (grams per cubic centimeter ) Forecast, by Application 2019 & 2032
- Table 47: Rest of South America Polyurethane Composites Market Revenue (Million) Forecast, by Application 2019 & 2032
- Table 48: Rest of South America Polyurethane Composites Market Volume (grams per cubic centimeter ) Forecast, by Application 2019 & 2032
- Table 49: Global Polyurethane Composites Market Revenue Million Forecast, by Country 2019 & 2032
- Table 50: Global Polyurethane Composites Market Volume grams per cubic centimeter Forecast, by Country 2019 & 2032
- Table 51: Saudi Arabia Polyurethane Composites Market Revenue (Million) Forecast, by Application 2019 & 2032
- Table 52: Saudi Arabia Polyurethane Composites Market Volume (grams per cubic centimeter ) Forecast, by Application 2019 & 2032
- Table 53: South Africa Polyurethane Composites Market Revenue (Million) Forecast, by Application 2019 & 2032
- Table 54: South Africa Polyurethane Composites Market Volume (grams per cubic centimeter ) Forecast, by Application 2019 & 2032
- Table 55: Rest of Middle East and Africa Polyurethane Composites Market Revenue (Million) Forecast, by Application 2019 & 2032
- Table 56: Rest of Middle East and Africa Polyurethane Composites Market Volume (grams per cubic centimeter ) Forecast, by Application 2019 & 2032
- Table 57: Global Polyurethane Composites Market Revenue Million Forecast, by Fiber Type 2019 & 2032
- Table 58: Global Polyurethane Composites Market Volume grams per cubic centimeter Forecast, by Fiber Type 2019 & 2032
- Table 59: Global Polyurethane Composites Market Revenue Million Forecast, by End-user Industry 2019 & 2032
- Table 60: Global Polyurethane Composites Market Volume grams per cubic centimeter Forecast, by End-user Industry 2019 & 2032
- Table 61: Global Polyurethane Composites Market Revenue Million Forecast, by Country 2019 & 2032
- Table 62: Global Polyurethane Composites Market Volume grams per cubic centimeter Forecast, by Country 2019 & 2032
- Table 63: China Polyurethane Composites Market Revenue (Million) Forecast, by Application 2019 & 2032
- Table 64: China Polyurethane Composites Market Volume (grams per cubic centimeter ) Forecast, by Application 2019 & 2032
- Table 65: India Polyurethane Composites Market Revenue (Million) Forecast, by Application 2019 & 2032
- Table 66: India Polyurethane Composites Market Volume (grams per cubic centimeter ) Forecast, by Application 2019 & 2032
- Table 67: Japan Polyurethane Composites Market Revenue (Million) Forecast, by Application 2019 & 2032
- Table 68: Japan Polyurethane Composites Market Volume (grams per cubic centimeter ) Forecast, by Application 2019 & 2032
- Table 69: South Korea Polyurethane Composites Market Revenue (Million) Forecast, by Application 2019 & 2032
- Table 70: South Korea Polyurethane Composites Market Volume (grams per cubic centimeter ) Forecast, by Application 2019 & 2032
- Table 71: Rest of Asia Pacific Polyurethane Composites Market Revenue (Million) Forecast, by Application 2019 & 2032
- Table 72: Rest of Asia Pacific Polyurethane Composites Market Volume (grams per cubic centimeter ) Forecast, by Application 2019 & 2032
- Table 73: Global Polyurethane Composites Market Revenue Million Forecast, by Fiber Type 2019 & 2032
- Table 74: Global Polyurethane Composites Market Volume grams per cubic centimeter Forecast, by Fiber Type 2019 & 2032
- Table 75: Global Polyurethane Composites Market Revenue Million Forecast, by End-user Industry 2019 & 2032
- Table 76: Global Polyurethane Composites Market Volume grams per cubic centimeter Forecast, by End-user Industry 2019 & 2032
- Table 77: Global Polyurethane Composites Market Revenue Million Forecast, by Country 2019 & 2032
- Table 78: Global Polyurethane Composites Market Volume grams per cubic centimeter Forecast, by Country 2019 & 2032
- Table 79: United States Polyurethane Composites Market Revenue (Million) Forecast, by Application 2019 & 2032
- Table 80: United States Polyurethane Composites Market Volume (grams per cubic centimeter ) Forecast, by Application 2019 & 2032
- Table 81: Canada Polyurethane Composites Market Revenue (Million) Forecast, by Application 2019 & 2032
- Table 82: Canada Polyurethane Composites Market Volume (grams per cubic centimeter ) Forecast, by Application 2019 & 2032
- Table 83: Mexico Polyurethane Composites Market Revenue (Million) Forecast, by Application 2019 & 2032
- Table 84: Mexico Polyurethane Composites Market Volume (grams per cubic centimeter ) Forecast, by Application 2019 & 2032
- Table 85: Global Polyurethane Composites Market Revenue Million Forecast, by Fiber Type 2019 & 2032
- Table 86: Global Polyurethane Composites Market Volume grams per cubic centimeter Forecast, by Fiber Type 2019 & 2032
- Table 87: Global Polyurethane Composites Market Revenue Million Forecast, by End-user Industry 2019 & 2032
- Table 88: Global Polyurethane Composites Market Volume grams per cubic centimeter Forecast, by End-user Industry 2019 & 2032
- Table 89: Global Polyurethane Composites Market Revenue Million Forecast, by Country 2019 & 2032
- Table 90: Global Polyurethane Composites Market Volume grams per cubic centimeter Forecast, by Country 2019 & 2032
- Table 91: Germany Polyurethane Composites Market Revenue (Million) Forecast, by Application 2019 & 2032
- Table 92: Germany Polyurethane Composites Market Volume (grams per cubic centimeter ) Forecast, by Application 2019 & 2032
- Table 93: United Kingdom Polyurethane Composites Market Revenue (Million) Forecast, by Application 2019 & 2032
- Table 94: United Kingdom Polyurethane Composites Market Volume (grams per cubic centimeter ) Forecast, by Application 2019 & 2032
- Table 95: Italy Polyurethane Composites Market Revenue (Million) Forecast, by Application 2019 & 2032
- Table 96: Italy Polyurethane Composites Market Volume (grams per cubic centimeter ) Forecast, by Application 2019 & 2032
- Table 97: France Polyurethane Composites Market Revenue (Million) Forecast, by Application 2019 & 2032
- Table 98: France Polyurethane Composites Market Volume (grams per cubic centimeter ) Forecast, by Application 2019 & 2032
- Table 99: Rest of Europe Polyurethane Composites Market Revenue (Million) Forecast, by Application 2019 & 2032
- Table 100: Rest of Europe Polyurethane Composites Market Volume (grams per cubic centimeter ) Forecast, by Application 2019 & 2032
- Table 101: Global Polyurethane Composites Market Revenue Million Forecast, by Fiber Type 2019 & 2032
- Table 102: Global Polyurethane Composites Market Volume grams per cubic centimeter Forecast, by Fiber Type 2019 & 2032
- Table 103: Global Polyurethane Composites Market Revenue Million Forecast, by End-user Industry 2019 & 2032
- Table 104: Global Polyurethane Composites Market Volume grams per cubic centimeter Forecast, by End-user Industry 2019 & 2032
- Table 105: Global Polyurethane Composites Market Revenue Million Forecast, by Country 2019 & 2032
- Table 106: Global Polyurethane Composites Market Volume grams per cubic centimeter Forecast, by Country 2019 & 2032
- Table 107: Brazil Polyurethane Composites Market Revenue (Million) Forecast, by Application 2019 & 2032
- Table 108: Brazil Polyurethane Composites Market Volume (grams per cubic centimeter ) Forecast, by Application 2019 & 2032
- Table 109: Argentina Polyurethane Composites Market Revenue (Million) Forecast, by Application 2019 & 2032
- Table 110: Argentina Polyurethane Composites Market Volume (grams per cubic centimeter ) Forecast, by Application 2019 & 2032
- Table 111: Rest of South America Polyurethane Composites Market Revenue (Million) Forecast, by Application 2019 & 2032
- Table 112: Rest of South America Polyurethane Composites Market Volume (grams per cubic centimeter ) Forecast, by Application 2019 & 2032
- Table 113: Global Polyurethane Composites Market Revenue Million Forecast, by Fiber Type 2019 & 2032
- Table 114: Global Polyurethane Composites Market Volume grams per cubic centimeter Forecast, by Fiber Type 2019 & 2032
- Table 115: Global Polyurethane Composites Market Revenue Million Forecast, by End-user Industry 2019 & 2032
- Table 116: Global Polyurethane Composites Market Volume grams per cubic centimeter Forecast, by End-user Industry 2019 & 2032
- Table 117: Global Polyurethane Composites Market Revenue Million Forecast, by Country 2019 & 2032
- Table 118: Global Polyurethane Composites Market Volume grams per cubic centimeter Forecast, by Country 2019 & 2032
- Table 119: Saudi Arabia Polyurethane Composites Market Revenue (Million) Forecast, by Application 2019 & 2032
- Table 120: Saudi Arabia Polyurethane Composites Market Volume (grams per cubic centimeter ) Forecast, by Application 2019 & 2032
- Table 121: South Africa Polyurethane Composites Market Revenue (Million) Forecast, by Application 2019 & 2032
- Table 122: South Africa Polyurethane Composites Market Volume (grams per cubic centimeter ) Forecast, by Application 2019 & 2032
- Table 123: Rest of Middle East and Africa Polyurethane Composites Market Revenue (Million) Forecast, by Application 2019 & 2032
- Table 124: Rest of Middle East and Africa Polyurethane Composites Market Volume (grams per cubic centimeter ) Forecast, by Application 2019 & 2032
Frequently Asked Questions
1. What is the projected Compound Annual Growth Rate (CAGR) of the Polyurethane Composites Market?
The projected CAGR is approximately 4.00%.
2. Which companies are prominent players in the Polyurethane Composites Market?
Key companies in the market include ELANTAS, BASF SE, Huntsman International LLC, Linecross, Webasto Group, Henkel Corporation, Covestro AG.
3. What are the main segments of the Polyurethane Composites Market?
The market segments include Fiber Type, End-user Industry.
4. Can you provide details about the market size?
The market size is estimated to be USD XX Million as of 2022.
5. What are some drivers contributing to market growth?
; Increasing Demand for the Lightweight Materials From the Transportation Industry; Growing Demand from the Building and Construction Industry.
6. What are the notable trends driving market growth?
Increasing demand from the Transportation Industry.
7. Are there any restraints impacting market growth?
; Slowdown in the Global Automotive Production; High Production Costs.
8. Can you provide examples of recent developments in the market?
N/A
9. What pricing options are available for accessing the report?
Pricing options include single-user, multi-user, and enterprise licenses priced at USD 4750, USD 5250, and USD 8750 respectively.
10. Is the market size provided in terms of value or volume?
The market size is provided in terms of value, measured in Million and volume, measured in grams per cubic centimeter .
11. Are there any specific market keywords associated with the report?
Yes, the market keyword associated with the report is "Polyurethane Composites Market," which aids in identifying and referencing the specific market segment covered.
12. How do I determine which pricing option suits my needs best?
The pricing options vary based on user requirements and access needs. Individual users may opt for single-user licenses, while businesses requiring broader access may choose multi-user or enterprise licenses for cost-effective access to the report.
13. Are there any additional resources or data provided in the Polyurethane Composites Market report?
While the report offers comprehensive insights, it's advisable to review the specific contents or supplementary materials provided to ascertain if additional resources or data are available.
14. How can I stay updated on further developments or reports in the Polyurethane Composites Market?
To stay informed about further developments, trends, and reports in the Polyurethane Composites Market, consider subscribing to industry newsletters, following relevant companies and organizations, or regularly checking reputable industry news sources and publications.
Methodology
Step 1 - Identification of Relevant Samples Size from Population Database


Step 2 - Approaches for Defining Global Market Size (Value, Volume* & Price*)

Note*: In applicable scenarios
Step 3 - Data Sources
Primary Research
- Web Analytics
- Survey Reports
- Research Institute
- Latest Research Reports
- Opinion Leaders
Secondary Research
- Annual Reports
- White Paper
- Latest Press Release
- Industry Association
- Paid Database
- Investor Presentations

Step 4 - Data Triangulation
Involves using different sources of information in order to increase the validity of a study
These sources are likely to be stakeholders in a program - participants, other researchers, program staff, other community members, and so on.
Then we put all data in single framework & apply various statistical tools to find out the dynamic on the market.
During the analysis stage, feedback from the stakeholder groups would be compared to determine areas of agreement as well as areas of divergence
