

Key Insights
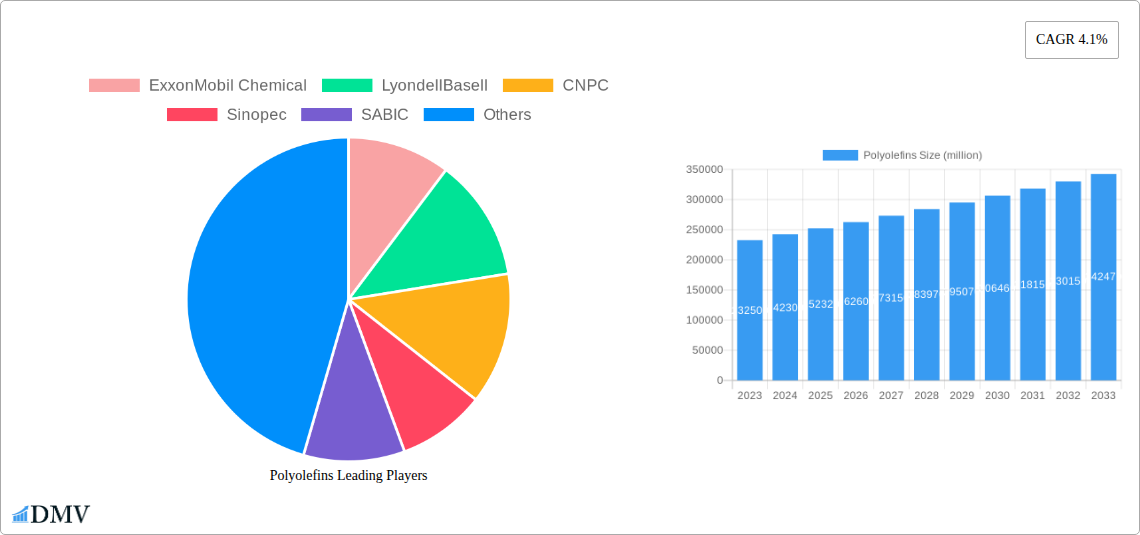
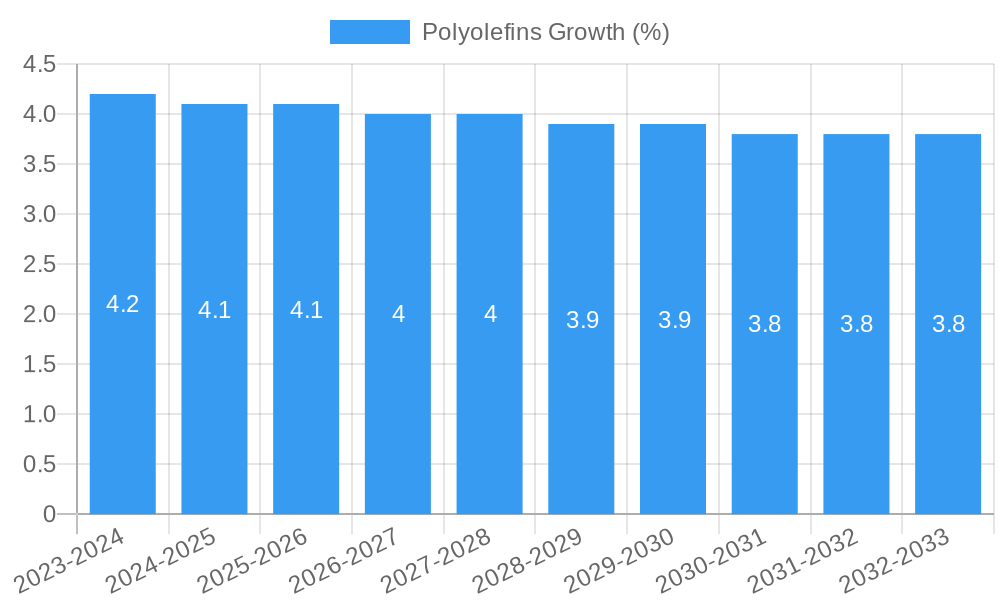
The global Polyolefins market is poised for substantial growth, projected to reach a market size of $252,320 million by 2025, with a Compound Annual Growth Rate (CAGR) of 4.1% anticipated to extend through 2033. This robust expansion is fueled by an increasing demand across a wide array of applications, prominently including automotive, construction, packaging, consumer goods, electrical and electronics, and medical sectors. The inherent versatility, cost-effectiveness, and excellent physical properties of polyolefins, such as Polyethylene (PE) and Polypropylene (PP), make them indispensable in modern manufacturing. The automotive industry's drive for lightweight materials to improve fuel efficiency, coupled with the escalating need for advanced packaging solutions to ensure product safety and shelf-life, are significant contributors to this upward trajectory. Furthermore, the burgeoning construction sector, driven by infrastructure development and urbanization, along with the continuous innovation in consumer goods and electronics requiring durable and adaptable materials, solidify polyolefins' position as a cornerstone of industrial production.
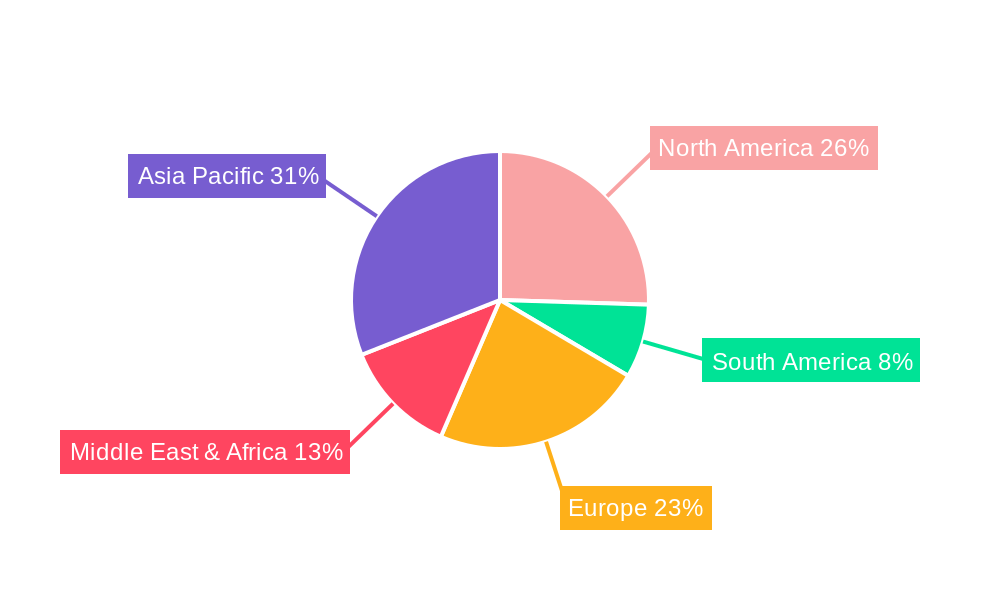
Despite the overwhelmingly positive growth outlook, certain factors could influence the market's pace. Increasing environmental regulations and a growing consumer preference for sustainable alternatives are creating a dynamic landscape, pushing for greater adoption of recycled and bio-based polyolefins. While these shifts present challenges, they also unlock new avenues for innovation and market differentiation. Geographically, the Asia Pacific region, led by China and India, is expected to remain a dominant force, driven by its large manufacturing base and increasing disposable incomes. North America and Europe continue to be significant markets, with a strong focus on advanced applications and sustainability initiatives. Key players like ExxonMobil Chemical, LyondellBasell, CNPC, Sinopec, SABIC, and Dow are actively investing in research and development to enhance product performance, explore new material compositions, and address the evolving demands for eco-friendly polyolefin solutions, thereby shaping the future of this dynamic market.
Comprehensive Polyolefins Market Analysis: Trends, Innovations, and Future Growth (2019-2033)
This in-depth report provides a definitive analysis of the global polyolefins market, encompassing a detailed examination of market composition, evolutionary trends, regional dominance, product innovations, growth drivers, obstacles, and future opportunities. Spanning from 2019 to 2033, with a base year of 2025 and a forecast period of 2025-2033, this report is an essential resource for stakeholders seeking to understand and capitalize on the dynamic polyolefins landscape. We meticulously analyze key segments such as Automotive, Construction, Packaging, Consumer Goods, Electrical and Electronics, and Medical, alongside core polyolefin types including Polyethylene (PE) and Polypropylene (PP).
Polyolefins Market Composition & Trends
The global polyolefins market, a cornerstone of the petrochemical industry, is characterized by a moderately consolidated landscape with leading players like ExxonMobil Chemical, LyondellBasell, CNPC, Sinopec, SABIC, Dow, Braskem, Ineos, Borealis, TotalEnergies, Reliance Industries, Formosa Plastics, and Repsol commanding significant market share, estimated to be over $250 million. Innovation is a key catalyst, driven by the constant demand for enhanced material properties in applications ranging from lightweight automotive components to sustainable packaging solutions. Regulatory landscapes are evolving, with a growing emphasis on recyclability and the use of recycled content, impacting product development and manufacturing processes. Substitute products, while present in niche applications, face significant challenges in matching the cost-effectiveness and versatility of polyolefins. End-user profiles are increasingly diverse, with the packaging sector representing the largest consumer, followed closely by construction and automotive. Mergers and acquisitions (M&A) remain a strategic tool for market consolidation and expansion, with recent deals valued in the hundreds of millions of dollars, demonstrating active strategic maneuvering.
- Market Concentration: Moderately consolidated with key global players.
- Innovation Drivers: Demand for high-performance materials, sustainability initiatives.
- Regulatory Impact: Increasing focus on recyclability and circular economy principles.
- Substitute Product Challenges: Cost-competitiveness and performance limitations.
- Key End-User Segments: Packaging (XX%), Construction (XX%), Automotive (XX%), Consumer Goods (XX%), Electrical and Electronics (XX%), Medical (XX%), Other (XX%).
- M&A Activity: Strategic for market expansion and consolidation, with recent deal values reaching over $300 million.
Polyolefins Industry Evolution
The polyolefins industry has witnessed a remarkable trajectory of growth and transformation throughout the historical period (2019-2024) and is poised for continued expansion into the forecast period (2025-2033). Market growth trajectories have been consistently robust, driven by escalating demand across diverse end-use sectors. Technological advancements have played a pivotal role, with innovations in polymerization processes leading to the development of advanced polyolefins exhibiting superior strength, flexibility, and thermal resistance. The adoption of metallocene catalysts, for instance, has enabled the production of polyethylene grades with enhanced performance characteristics, catering to specialized applications. Shifting consumer demands, particularly the growing consciousness around sustainability and environmental impact, have spurred a significant push towards recyclable and bio-based polyolefins. This has led to increased investment in research and development for advanced recycling technologies and the integration of renewable feedstocks into polyolefin production. The estimated market growth rate for the forecast period is projected to be around 4.5% annually. Adoption metrics for high-performance polyolefins in automotive applications, for example, have seen a steady increase, contributing to vehicle lightweighting and improved fuel efficiency. Similarly, the packaging segment continues to drive demand for innovative polyolefin solutions that offer extended shelf life and enhanced product protection. The estimated market size for the base year 2025 is projected to be over $260 million.
Leading Regions, Countries, or Segments in Polyolefins
The global polyolefins market exhibits distinct regional and segment leadership, driven by a confluence of economic development, industrialization, and evolving consumer needs. Asia-Pacific, particularly China, stands out as the dominant region, fueled by its massive manufacturing base and substantial domestic demand across all key application segments. The region's robust growth in packaging, construction, and automotive sectors, coupled with significant government investments in infrastructure, solidifies its leading position. Within Asia-Pacific, China's burgeoning economy and its role as a global manufacturing hub contribute to its overwhelming dominance in both polyethylene (PE) and polypropylene (PP) consumption.
- Dominant Region: Asia-Pacific, spearheaded by China.
- Key Drivers:
- Rapid industrialization and urbanization.
- Massive domestic demand across all application segments.
- Government support for manufacturing and infrastructure development.
- Extensive presence of leading polyolefin producers and consumers.
- Key Drivers:
The Packaging segment continues to be the largest application, accounting for an estimated XX% of the global polyolefins market. This dominance is attributed to the indispensable role of polyolefins in food and beverage packaging, flexible packaging, rigid containers, and industrial packaging, all of which are experiencing sustained growth. The increasing global population and evolving retail landscapes further bolster demand.
- Dominant Application Segment: Packaging.
- Factors Contributing to Dominance:
- Ubiquitous use in food & beverage, consumer goods, and industrial applications.
- Demand for lightweight, durable, and cost-effective packaging solutions.
- Growth in e-commerce and flexible packaging needs.
- Innovations in barrier properties and recyclability for enhanced shelf life.
- Factors Contributing to Dominance:
In terms of product types, Polyethylene (PE), encompassing High-Density Polyethylene (HDPE), Low-Density Polyethylene (LDPE), and Linear Low-Density Polyethylene (LLDPE), remains the most widely consumed polyolefin, driven by its versatility and cost-effectiveness in a broad spectrum of applications, particularly in packaging and construction.
- Dominant Product Type: Polyethylene (PE).
- Reasons for Dominance:
- Versatility and wide range of applications.
- Cost-effectiveness compared to other polymers.
- Established production infrastructure and diverse grades.
- Key material for films, bags, containers, pipes, and more.
- Reasons for Dominance:
The Automotive segment is experiencing significant growth, with polyolefins being increasingly utilized for interior and exterior components, contributing to vehicle lightweighting and fuel efficiency improvements. Regulatory support for emission reduction and the drive towards electric vehicles further amplify this trend.
- High-Growth Application Segment: Automotive.
- Key Drivers:
- Lightweighting initiatives for improved fuel economy and EV range.
- Demand for durable, impact-resistant, and aesthetically pleasing automotive parts.
- Advancements in material science for enhanced performance.
- Key Drivers:
Polyolefins Product Innovations
Product innovation in the polyolefins sector is a relentless pursuit, aimed at enhancing performance, sustainability, and application range. Recent advancements include the development of high-melt strength polypropylenes for improved thermoforming capabilities in packaging and automotive components. Novel polyethylene grades with exceptional clarity and barrier properties are revolutionizing food packaging, extending shelf life and reducing food waste. Furthermore, the integration of advanced catalyst technologies is enabling the production of polyolefins with tailored molecular structures, offering superior mechanical properties such as impact resistance and tensile strength. The focus on circularity is also driving innovation in chemical recycling technologies and the development of bio-based polyolefins derived from renewable feedstocks, presenting unique selling propositions for environmentally conscious brands.
Propelling Factors for Polyolefins Growth
Several key factors are propelling the growth of the polyolefins market. Technological advancements, particularly in polymerization processes and catalyst development, continue to yield polyolefins with enhanced properties and cost-effectiveness. The escalating global demand for packaging solutions, driven by population growth and changing consumption patterns, is a primary growth engine. The automotive industry's increasing adoption of lightweight plastics for fuel efficiency and electric vehicle range extension provides significant impetus. Furthermore, supportive government regulations promoting recycling and the circular economy, coupled with increasing consumer preference for sustainable materials, are creating new avenues for growth and innovation in the polyolefins sector.
- Technological Advancements: Enhanced polymerization techniques and catalyst development.
- Growing Packaging Demand: Driven by population growth and e-commerce.
- Automotive Lightweighting: Fuel efficiency and EV range extension.
- Sustainability Initiatives: Circular economy focus and bio-based alternatives.
Obstacles in the Polyolefins Market
Despite robust growth prospects, the polyolefins market faces several obstacles. Increasing regulatory scrutiny and public perception regarding plastic waste and environmental impact pose significant challenges. Volatility in raw material prices, particularly crude oil and natural gas, can impact production costs and profitability. The development and scaling of effective and economically viable chemical recycling technologies are still in progress. Furthermore, intense competition among global players can lead to price pressures, and the ongoing development of alternative materials in specific niche applications presents a competitive threat. Supply chain disruptions, as witnessed in recent global events, can also impede production and delivery.
- Environmental Concerns: Plastic waste and pollution challenges.
- Raw Material Price Volatility: Impact on production costs.
- Recycling Technology Maturity: Need for scalable and economical solutions.
- Competition and Price Pressures: Market saturation in certain segments.
Future Opportunities in Polyolefins
The future of the polyolefins market is rich with opportunities. The burgeoning demand for sustainable packaging solutions, including advanced recyclable materials and bio-based polyolefins, presents a significant growth area. The expansion of electric vehicle adoption will continue to drive demand for lightweight polyolefin components. Emerging economies offer untapped potential for market penetration across various applications. Furthermore, ongoing research into advanced recycling technologies promises to unlock new revenue streams and enhance the circularity of polyolefins. The development of specialized polyolefins for niche applications in healthcare and renewable energy sectors also holds considerable promise.
- Sustainable Packaging Solutions: Recyclable and bio-based polyolefins.
- Electric Vehicle Market Growth: Demand for lightweight components.
- Emerging Market Expansion: Untapped potential in developing economies.
- Advanced Recycling Technologies: Enhancing circularity and creating new revenue streams.
Major Players in the Polyolefins Ecosystem
- ExxonMobil Chemical
- LyondellBasell
- CNPC
- Sinopec
- SABIC
- Dow
- Braskem
- Ineos
- Borealis
- TotalEnergies
- Reliance Industries
- Formosa Plastics
- Repsol
Key Developments in Polyolefins Industry
- 2024: Launch of novel biodegradable polyolefin compounds for food packaging.
- 2023: Significant investment in chemical recycling infrastructure by major players.
- 2023: Introduction of high-performance polypropylene grades for automotive lightweighting.
- 2022: Increased focus on the development of bio-based polyethylene feedstocks.
- 2021: M&A activities aimed at expanding market share and technological capabilities.
- 2020: Growing emphasis on developing advanced recycling solutions for end-of-life polyolefin products.
- 2019: Innovations in catalyst technology leading to enhanced polyolefin properties.
Strategic Polyolefins Market Forecast
The strategic polyolefins market forecast indicates continued robust growth, driven by a confluence of enduring demand from core applications like packaging and construction, and emerging opportunities in sustainable solutions and the electric vehicle sector. The increasing emphasis on the circular economy will foster innovation in recycling technologies and the adoption of bio-based materials, creating new market segments and value chains. Investments in advanced manufacturing processes and research into novel polyolefin formulations will further enhance their competitiveness and broaden their application scope. The market is projected to witness steady expansion, underpinned by technological progress and evolving consumer preferences for both performance and sustainability.
Polyolefins Segmentation
-
1. Application
- 1.1. Automotive
- 1.2. Construction
- 1.3. Packaging
- 1.4. Consumer Goods
- 1.5. Electrical and Electronics
- 1.6. Medical
- 1.7. Other
-
2. Types
- 2.1. Polyethylene (PE)
- 2.2. Polypropylene (PP)
Polyolefins Segmentation By Geography
-
1. North America
- 1.1. United States
- 1.2. Canada
- 1.3. Mexico
-
2. South America
- 2.1. Brazil
- 2.2. Argentina
- 2.3. Rest of South America
-
3. Europe
- 3.1. United Kingdom
- 3.2. Germany
- 3.3. France
- 3.4. Italy
- 3.5. Spain
- 3.6. Russia
- 3.7. Benelux
- 3.8. Nordics
- 3.9. Rest of Europe
-
4. Middle East & Africa
- 4.1. Turkey
- 4.2. Israel
- 4.3. GCC
- 4.4. North Africa
- 4.5. South Africa
- 4.6. Rest of Middle East & Africa
-
5. Asia Pacific
- 5.1. China
- 5.2. India
- 5.3. Japan
- 5.4. South Korea
- 5.5. ASEAN
- 5.6. Oceania
- 5.7. Rest of Asia Pacific
Polyolefins REPORT HIGHLIGHTS
| Aspects | Details |
|---|---|
| Study Period | 2019-2033 |
| Base Year | 2024 |
| Estimated Year | 2025 |
| Forecast Period | 2025-2033 |
| Historical Period | 2019-2024 |
| Growth Rate | CAGR of 4.1% from 2019-2033 |
| Segmentation |
|
Table of Contents
- 1. Introduction
- 1.1. Research Scope
- 1.2. Market Segmentation
- 1.3. Research Methodology
- 1.4. Definitions and Assumptions
- 2. Executive Summary
- 2.1. Introduction
- 3. Market Dynamics
- 3.1. Introduction
- 3.2. Market Drivers
- 3.3. Market Restrains
- 3.4. Market Trends
- 4. Market Factor Analysis
- 4.1. Porters Five Forces
- 4.2. Supply/Value Chain
- 4.3. PESTEL analysis
- 4.4. Market Entropy
- 4.5. Patent/Trademark Analysis
- 5. Global Polyolefins Analysis, Insights and Forecast, 2019-2031
- 5.1. Market Analysis, Insights and Forecast - by Application
- 5.1.1. Automotive
- 5.1.2. Construction
- 5.1.3. Packaging
- 5.1.4. Consumer Goods
- 5.1.5. Electrical and Electronics
- 5.1.6. Medical
- 5.1.7. Other
- 5.2. Market Analysis, Insights and Forecast - by Types
- 5.2.1. Polyethylene (PE)
- 5.2.2. Polypropylene (PP)
- 5.3. Market Analysis, Insights and Forecast - by Region
- 5.3.1. North America
- 5.3.2. South America
- 5.3.3. Europe
- 5.3.4. Middle East & Africa
- 5.3.5. Asia Pacific
- 5.1. Market Analysis, Insights and Forecast - by Application
- 6. North America Polyolefins Analysis, Insights and Forecast, 2019-2031
- 6.1. Market Analysis, Insights and Forecast - by Application
- 6.1.1. Automotive
- 6.1.2. Construction
- 6.1.3. Packaging
- 6.1.4. Consumer Goods
- 6.1.5. Electrical and Electronics
- 6.1.6. Medical
- 6.1.7. Other
- 6.2. Market Analysis, Insights and Forecast - by Types
- 6.2.1. Polyethylene (PE)
- 6.2.2. Polypropylene (PP)
- 6.1. Market Analysis, Insights and Forecast - by Application
- 7. South America Polyolefins Analysis, Insights and Forecast, 2019-2031
- 7.1. Market Analysis, Insights and Forecast - by Application
- 7.1.1. Automotive
- 7.1.2. Construction
- 7.1.3. Packaging
- 7.1.4. Consumer Goods
- 7.1.5. Electrical and Electronics
- 7.1.6. Medical
- 7.1.7. Other
- 7.2. Market Analysis, Insights and Forecast - by Types
- 7.2.1. Polyethylene (PE)
- 7.2.2. Polypropylene (PP)
- 7.1. Market Analysis, Insights and Forecast - by Application
- 8. Europe Polyolefins Analysis, Insights and Forecast, 2019-2031
- 8.1. Market Analysis, Insights and Forecast - by Application
- 8.1.1. Automotive
- 8.1.2. Construction
- 8.1.3. Packaging
- 8.1.4. Consumer Goods
- 8.1.5. Electrical and Electronics
- 8.1.6. Medical
- 8.1.7. Other
- 8.2. Market Analysis, Insights and Forecast - by Types
- 8.2.1. Polyethylene (PE)
- 8.2.2. Polypropylene (PP)
- 8.1. Market Analysis, Insights and Forecast - by Application
- 9. Middle East & Africa Polyolefins Analysis, Insights and Forecast, 2019-2031
- 9.1. Market Analysis, Insights and Forecast - by Application
- 9.1.1. Automotive
- 9.1.2. Construction
- 9.1.3. Packaging
- 9.1.4. Consumer Goods
- 9.1.5. Electrical and Electronics
- 9.1.6. Medical
- 9.1.7. Other
- 9.2. Market Analysis, Insights and Forecast - by Types
- 9.2.1. Polyethylene (PE)
- 9.2.2. Polypropylene (PP)
- 9.1. Market Analysis, Insights and Forecast - by Application
- 10. Asia Pacific Polyolefins Analysis, Insights and Forecast, 2019-2031
- 10.1. Market Analysis, Insights and Forecast - by Application
- 10.1.1. Automotive
- 10.1.2. Construction
- 10.1.3. Packaging
- 10.1.4. Consumer Goods
- 10.1.5. Electrical and Electronics
- 10.1.6. Medical
- 10.1.7. Other
- 10.2. Market Analysis, Insights and Forecast - by Types
- 10.2.1. Polyethylene (PE)
- 10.2.2. Polypropylene (PP)
- 10.1. Market Analysis, Insights and Forecast - by Application
- 11. Competitive Analysis
- 11.1. Global Market Share Analysis 2024
- 11.2. Company Profiles
- 11.2.1 ExxonMobil Chemical
- 11.2.1.1. Overview
- 11.2.1.2. Products
- 11.2.1.3. SWOT Analysis
- 11.2.1.4. Recent Developments
- 11.2.1.5. Financials (Based on Availability)
- 11.2.2 LyondellBasell
- 11.2.2.1. Overview
- 11.2.2.2. Products
- 11.2.2.3. SWOT Analysis
- 11.2.2.4. Recent Developments
- 11.2.2.5. Financials (Based on Availability)
- 11.2.3 CNPC
- 11.2.3.1. Overview
- 11.2.3.2. Products
- 11.2.3.3. SWOT Analysis
- 11.2.3.4. Recent Developments
- 11.2.3.5. Financials (Based on Availability)
- 11.2.4 Sinopec
- 11.2.4.1. Overview
- 11.2.4.2. Products
- 11.2.4.3. SWOT Analysis
- 11.2.4.4. Recent Developments
- 11.2.4.5. Financials (Based on Availability)
- 11.2.5 SABIC
- 11.2.5.1. Overview
- 11.2.5.2. Products
- 11.2.5.3. SWOT Analysis
- 11.2.5.4. Recent Developments
- 11.2.5.5. Financials (Based on Availability)
- 11.2.6 Dow
- 11.2.6.1. Overview
- 11.2.6.2. Products
- 11.2.6.3. SWOT Analysis
- 11.2.6.4. Recent Developments
- 11.2.6.5. Financials (Based on Availability)
- 11.2.7 Braskem
- 11.2.7.1. Overview
- 11.2.7.2. Products
- 11.2.7.3. SWOT Analysis
- 11.2.7.4. Recent Developments
- 11.2.7.5. Financials (Based on Availability)
- 11.2.8 Ineos
- 11.2.8.1. Overview
- 11.2.8.2. Products
- 11.2.8.3. SWOT Analysis
- 11.2.8.4. Recent Developments
- 11.2.8.5. Financials (Based on Availability)
- 11.2.9 Borealis
- 11.2.9.1. Overview
- 11.2.9.2. Products
- 11.2.9.3. SWOT Analysis
- 11.2.9.4. Recent Developments
- 11.2.9.5. Financials (Based on Availability)
- 11.2.10 TotalEnergies
- 11.2.10.1. Overview
- 11.2.10.2. Products
- 11.2.10.3. SWOT Analysis
- 11.2.10.4. Recent Developments
- 11.2.10.5. Financials (Based on Availability)
- 11.2.11 Reliance Industries
- 11.2.11.1. Overview
- 11.2.11.2. Products
- 11.2.11.3. SWOT Analysis
- 11.2.11.4. Recent Developments
- 11.2.11.5. Financials (Based on Availability)
- 11.2.12 Formosa Plastics
- 11.2.12.1. Overview
- 11.2.12.2. Products
- 11.2.12.3. SWOT Analysis
- 11.2.12.4. Recent Developments
- 11.2.12.5. Financials (Based on Availability)
- 11.2.13 Repsol
- 11.2.13.1. Overview
- 11.2.13.2. Products
- 11.2.13.3. SWOT Analysis
- 11.2.13.4. Recent Developments
- 11.2.13.5. Financials (Based on Availability)
- 11.2.1 ExxonMobil Chemical
List of Figures
- Figure 1: Global Polyolefins Revenue Breakdown (million, %) by Region 2024 & 2032
- Figure 2: Global Polyolefins Volume Breakdown (K, %) by Region 2024 & 2032
- Figure 3: North America Polyolefins Revenue (million), by Application 2024 & 2032
- Figure 4: North America Polyolefins Volume (K), by Application 2024 & 2032
- Figure 5: North America Polyolefins Revenue Share (%), by Application 2024 & 2032
- Figure 6: North America Polyolefins Volume Share (%), by Application 2024 & 2032
- Figure 7: North America Polyolefins Revenue (million), by Types 2024 & 2032
- Figure 8: North America Polyolefins Volume (K), by Types 2024 & 2032
- Figure 9: North America Polyolefins Revenue Share (%), by Types 2024 & 2032
- Figure 10: North America Polyolefins Volume Share (%), by Types 2024 & 2032
- Figure 11: North America Polyolefins Revenue (million), by Country 2024 & 2032
- Figure 12: North America Polyolefins Volume (K), by Country 2024 & 2032
- Figure 13: North America Polyolefins Revenue Share (%), by Country 2024 & 2032
- Figure 14: North America Polyolefins Volume Share (%), by Country 2024 & 2032
- Figure 15: South America Polyolefins Revenue (million), by Application 2024 & 2032
- Figure 16: South America Polyolefins Volume (K), by Application 2024 & 2032
- Figure 17: South America Polyolefins Revenue Share (%), by Application 2024 & 2032
- Figure 18: South America Polyolefins Volume Share (%), by Application 2024 & 2032
- Figure 19: South America Polyolefins Revenue (million), by Types 2024 & 2032
- Figure 20: South America Polyolefins Volume (K), by Types 2024 & 2032
- Figure 21: South America Polyolefins Revenue Share (%), by Types 2024 & 2032
- Figure 22: South America Polyolefins Volume Share (%), by Types 2024 & 2032
- Figure 23: South America Polyolefins Revenue (million), by Country 2024 & 2032
- Figure 24: South America Polyolefins Volume (K), by Country 2024 & 2032
- Figure 25: South America Polyolefins Revenue Share (%), by Country 2024 & 2032
- Figure 26: South America Polyolefins Volume Share (%), by Country 2024 & 2032
- Figure 27: Europe Polyolefins Revenue (million), by Application 2024 & 2032
- Figure 28: Europe Polyolefins Volume (K), by Application 2024 & 2032
- Figure 29: Europe Polyolefins Revenue Share (%), by Application 2024 & 2032
- Figure 30: Europe Polyolefins Volume Share (%), by Application 2024 & 2032
- Figure 31: Europe Polyolefins Revenue (million), by Types 2024 & 2032
- Figure 32: Europe Polyolefins Volume (K), by Types 2024 & 2032
- Figure 33: Europe Polyolefins Revenue Share (%), by Types 2024 & 2032
- Figure 34: Europe Polyolefins Volume Share (%), by Types 2024 & 2032
- Figure 35: Europe Polyolefins Revenue (million), by Country 2024 & 2032
- Figure 36: Europe Polyolefins Volume (K), by Country 2024 & 2032
- Figure 37: Europe Polyolefins Revenue Share (%), by Country 2024 & 2032
- Figure 38: Europe Polyolefins Volume Share (%), by Country 2024 & 2032
- Figure 39: Middle East & Africa Polyolefins Revenue (million), by Application 2024 & 2032
- Figure 40: Middle East & Africa Polyolefins Volume (K), by Application 2024 & 2032
- Figure 41: Middle East & Africa Polyolefins Revenue Share (%), by Application 2024 & 2032
- Figure 42: Middle East & Africa Polyolefins Volume Share (%), by Application 2024 & 2032
- Figure 43: Middle East & Africa Polyolefins Revenue (million), by Types 2024 & 2032
- Figure 44: Middle East & Africa Polyolefins Volume (K), by Types 2024 & 2032
- Figure 45: Middle East & Africa Polyolefins Revenue Share (%), by Types 2024 & 2032
- Figure 46: Middle East & Africa Polyolefins Volume Share (%), by Types 2024 & 2032
- Figure 47: Middle East & Africa Polyolefins Revenue (million), by Country 2024 & 2032
- Figure 48: Middle East & Africa Polyolefins Volume (K), by Country 2024 & 2032
- Figure 49: Middle East & Africa Polyolefins Revenue Share (%), by Country 2024 & 2032
- Figure 50: Middle East & Africa Polyolefins Volume Share (%), by Country 2024 & 2032
- Figure 51: Asia Pacific Polyolefins Revenue (million), by Application 2024 & 2032
- Figure 52: Asia Pacific Polyolefins Volume (K), by Application 2024 & 2032
- Figure 53: Asia Pacific Polyolefins Revenue Share (%), by Application 2024 & 2032
- Figure 54: Asia Pacific Polyolefins Volume Share (%), by Application 2024 & 2032
- Figure 55: Asia Pacific Polyolefins Revenue (million), by Types 2024 & 2032
- Figure 56: Asia Pacific Polyolefins Volume (K), by Types 2024 & 2032
- Figure 57: Asia Pacific Polyolefins Revenue Share (%), by Types 2024 & 2032
- Figure 58: Asia Pacific Polyolefins Volume Share (%), by Types 2024 & 2032
- Figure 59: Asia Pacific Polyolefins Revenue (million), by Country 2024 & 2032
- Figure 60: Asia Pacific Polyolefins Volume (K), by Country 2024 & 2032
- Figure 61: Asia Pacific Polyolefins Revenue Share (%), by Country 2024 & 2032
- Figure 62: Asia Pacific Polyolefins Volume Share (%), by Country 2024 & 2032
List of Tables
- Table 1: Global Polyolefins Revenue million Forecast, by Region 2019 & 2032
- Table 2: Global Polyolefins Volume K Forecast, by Region 2019 & 2032
- Table 3: Global Polyolefins Revenue million Forecast, by Application 2019 & 2032
- Table 4: Global Polyolefins Volume K Forecast, by Application 2019 & 2032
- Table 5: Global Polyolefins Revenue million Forecast, by Types 2019 & 2032
- Table 6: Global Polyolefins Volume K Forecast, by Types 2019 & 2032
- Table 7: Global Polyolefins Revenue million Forecast, by Region 2019 & 2032
- Table 8: Global Polyolefins Volume K Forecast, by Region 2019 & 2032
- Table 9: Global Polyolefins Revenue million Forecast, by Application 2019 & 2032
- Table 10: Global Polyolefins Volume K Forecast, by Application 2019 & 2032
- Table 11: Global Polyolefins Revenue million Forecast, by Types 2019 & 2032
- Table 12: Global Polyolefins Volume K Forecast, by Types 2019 & 2032
- Table 13: Global Polyolefins Revenue million Forecast, by Country 2019 & 2032
- Table 14: Global Polyolefins Volume K Forecast, by Country 2019 & 2032
- Table 15: United States Polyolefins Revenue (million) Forecast, by Application 2019 & 2032
- Table 16: United States Polyolefins Volume (K) Forecast, by Application 2019 & 2032
- Table 17: Canada Polyolefins Revenue (million) Forecast, by Application 2019 & 2032
- Table 18: Canada Polyolefins Volume (K) Forecast, by Application 2019 & 2032
- Table 19: Mexico Polyolefins Revenue (million) Forecast, by Application 2019 & 2032
- Table 20: Mexico Polyolefins Volume (K) Forecast, by Application 2019 & 2032
- Table 21: Global Polyolefins Revenue million Forecast, by Application 2019 & 2032
- Table 22: Global Polyolefins Volume K Forecast, by Application 2019 & 2032
- Table 23: Global Polyolefins Revenue million Forecast, by Types 2019 & 2032
- Table 24: Global Polyolefins Volume K Forecast, by Types 2019 & 2032
- Table 25: Global Polyolefins Revenue million Forecast, by Country 2019 & 2032
- Table 26: Global Polyolefins Volume K Forecast, by Country 2019 & 2032
- Table 27: Brazil Polyolefins Revenue (million) Forecast, by Application 2019 & 2032
- Table 28: Brazil Polyolefins Volume (K) Forecast, by Application 2019 & 2032
- Table 29: Argentina Polyolefins Revenue (million) Forecast, by Application 2019 & 2032
- Table 30: Argentina Polyolefins Volume (K) Forecast, by Application 2019 & 2032
- Table 31: Rest of South America Polyolefins Revenue (million) Forecast, by Application 2019 & 2032
- Table 32: Rest of South America Polyolefins Volume (K) Forecast, by Application 2019 & 2032
- Table 33: Global Polyolefins Revenue million Forecast, by Application 2019 & 2032
- Table 34: Global Polyolefins Volume K Forecast, by Application 2019 & 2032
- Table 35: Global Polyolefins Revenue million Forecast, by Types 2019 & 2032
- Table 36: Global Polyolefins Volume K Forecast, by Types 2019 & 2032
- Table 37: Global Polyolefins Revenue million Forecast, by Country 2019 & 2032
- Table 38: Global Polyolefins Volume K Forecast, by Country 2019 & 2032
- Table 39: United Kingdom Polyolefins Revenue (million) Forecast, by Application 2019 & 2032
- Table 40: United Kingdom Polyolefins Volume (K) Forecast, by Application 2019 & 2032
- Table 41: Germany Polyolefins Revenue (million) Forecast, by Application 2019 & 2032
- Table 42: Germany Polyolefins Volume (K) Forecast, by Application 2019 & 2032
- Table 43: France Polyolefins Revenue (million) Forecast, by Application 2019 & 2032
- Table 44: France Polyolefins Volume (K) Forecast, by Application 2019 & 2032
- Table 45: Italy Polyolefins Revenue (million) Forecast, by Application 2019 & 2032
- Table 46: Italy Polyolefins Volume (K) Forecast, by Application 2019 & 2032
- Table 47: Spain Polyolefins Revenue (million) Forecast, by Application 2019 & 2032
- Table 48: Spain Polyolefins Volume (K) Forecast, by Application 2019 & 2032
- Table 49: Russia Polyolefins Revenue (million) Forecast, by Application 2019 & 2032
- Table 50: Russia Polyolefins Volume (K) Forecast, by Application 2019 & 2032
- Table 51: Benelux Polyolefins Revenue (million) Forecast, by Application 2019 & 2032
- Table 52: Benelux Polyolefins Volume (K) Forecast, by Application 2019 & 2032
- Table 53: Nordics Polyolefins Revenue (million) Forecast, by Application 2019 & 2032
- Table 54: Nordics Polyolefins Volume (K) Forecast, by Application 2019 & 2032
- Table 55: Rest of Europe Polyolefins Revenue (million) Forecast, by Application 2019 & 2032
- Table 56: Rest of Europe Polyolefins Volume (K) Forecast, by Application 2019 & 2032
- Table 57: Global Polyolefins Revenue million Forecast, by Application 2019 & 2032
- Table 58: Global Polyolefins Volume K Forecast, by Application 2019 & 2032
- Table 59: Global Polyolefins Revenue million Forecast, by Types 2019 & 2032
- Table 60: Global Polyolefins Volume K Forecast, by Types 2019 & 2032
- Table 61: Global Polyolefins Revenue million Forecast, by Country 2019 & 2032
- Table 62: Global Polyolefins Volume K Forecast, by Country 2019 & 2032
- Table 63: Turkey Polyolefins Revenue (million) Forecast, by Application 2019 & 2032
- Table 64: Turkey Polyolefins Volume (K) Forecast, by Application 2019 & 2032
- Table 65: Israel Polyolefins Revenue (million) Forecast, by Application 2019 & 2032
- Table 66: Israel Polyolefins Volume (K) Forecast, by Application 2019 & 2032
- Table 67: GCC Polyolefins Revenue (million) Forecast, by Application 2019 & 2032
- Table 68: GCC Polyolefins Volume (K) Forecast, by Application 2019 & 2032
- Table 69: North Africa Polyolefins Revenue (million) Forecast, by Application 2019 & 2032
- Table 70: North Africa Polyolefins Volume (K) Forecast, by Application 2019 & 2032
- Table 71: South Africa Polyolefins Revenue (million) Forecast, by Application 2019 & 2032
- Table 72: South Africa Polyolefins Volume (K) Forecast, by Application 2019 & 2032
- Table 73: Rest of Middle East & Africa Polyolefins Revenue (million) Forecast, by Application 2019 & 2032
- Table 74: Rest of Middle East & Africa Polyolefins Volume (K) Forecast, by Application 2019 & 2032
- Table 75: Global Polyolefins Revenue million Forecast, by Application 2019 & 2032
- Table 76: Global Polyolefins Volume K Forecast, by Application 2019 & 2032
- Table 77: Global Polyolefins Revenue million Forecast, by Types 2019 & 2032
- Table 78: Global Polyolefins Volume K Forecast, by Types 2019 & 2032
- Table 79: Global Polyolefins Revenue million Forecast, by Country 2019 & 2032
- Table 80: Global Polyolefins Volume K Forecast, by Country 2019 & 2032
- Table 81: China Polyolefins Revenue (million) Forecast, by Application 2019 & 2032
- Table 82: China Polyolefins Volume (K) Forecast, by Application 2019 & 2032
- Table 83: India Polyolefins Revenue (million) Forecast, by Application 2019 & 2032
- Table 84: India Polyolefins Volume (K) Forecast, by Application 2019 & 2032
- Table 85: Japan Polyolefins Revenue (million) Forecast, by Application 2019 & 2032
- Table 86: Japan Polyolefins Volume (K) Forecast, by Application 2019 & 2032
- Table 87: South Korea Polyolefins Revenue (million) Forecast, by Application 2019 & 2032
- Table 88: South Korea Polyolefins Volume (K) Forecast, by Application 2019 & 2032
- Table 89: ASEAN Polyolefins Revenue (million) Forecast, by Application 2019 & 2032
- Table 90: ASEAN Polyolefins Volume (K) Forecast, by Application 2019 & 2032
- Table 91: Oceania Polyolefins Revenue (million) Forecast, by Application 2019 & 2032
- Table 92: Oceania Polyolefins Volume (K) Forecast, by Application 2019 & 2032
- Table 93: Rest of Asia Pacific Polyolefins Revenue (million) Forecast, by Application 2019 & 2032
- Table 94: Rest of Asia Pacific Polyolefins Volume (K) Forecast, by Application 2019 & 2032
Frequently Asked Questions
1. What is the projected Compound Annual Growth Rate (CAGR) of the Polyolefins?
The projected CAGR is approximately 4.1%.
2. Which companies are prominent players in the Polyolefins?
Key companies in the market include ExxonMobil Chemical, LyondellBasell, CNPC, Sinopec, SABIC, Dow, Braskem, Ineos, Borealis, TotalEnergies, Reliance Industries, Formosa Plastics, Repsol.
3. What are the main segments of the Polyolefins?
The market segments include Application, Types.
4. Can you provide details about the market size?
The market size is estimated to be USD 252320 million as of 2022.
5. What are some drivers contributing to market growth?
N/A
6. What are the notable trends driving market growth?
N/A
7. Are there any restraints impacting market growth?
N/A
8. Can you provide examples of recent developments in the market?
N/A
9. What pricing options are available for accessing the report?
Pricing options include single-user, multi-user, and enterprise licenses priced at USD 4350.00, USD 6525.00, and USD 8700.00 respectively.
10. Is the market size provided in terms of value or volume?
The market size is provided in terms of value, measured in million and volume, measured in K.
11. Are there any specific market keywords associated with the report?
Yes, the market keyword associated with the report is "Polyolefins," which aids in identifying and referencing the specific market segment covered.
12. How do I determine which pricing option suits my needs best?
The pricing options vary based on user requirements and access needs. Individual users may opt for single-user licenses, while businesses requiring broader access may choose multi-user or enterprise licenses for cost-effective access to the report.
13. Are there any additional resources or data provided in the Polyolefins report?
While the report offers comprehensive insights, it's advisable to review the specific contents or supplementary materials provided to ascertain if additional resources or data are available.
14. How can I stay updated on further developments or reports in the Polyolefins?
To stay informed about further developments, trends, and reports in the Polyolefins, consider subscribing to industry newsletters, following relevant companies and organizations, or regularly checking reputable industry news sources and publications.
Methodology
Step 1 - Identification of Relevant Samples Size from Population Database


Step 2 - Approaches for Defining Global Market Size (Value, Volume* & Price*)

Note*: In applicable scenarios
Step 3 - Data Sources
Primary Research
- Web Analytics
- Survey Reports
- Research Institute
- Latest Research Reports
- Opinion Leaders
Secondary Research
- Annual Reports
- White Paper
- Latest Press Release
- Industry Association
- Paid Database
- Investor Presentations

Step 4 - Data Triangulation
Involves using different sources of information in order to increase the validity of a study
These sources are likely to be stakeholders in a program - participants, other researchers, program staff, other community members, and so on.
Then we put all data in single framework & apply various statistical tools to find out the dynamic on the market.
During the analysis stage, feedback from the stakeholder groups would be compared to determine areas of agreement as well as areas of divergence
