

Key Insights
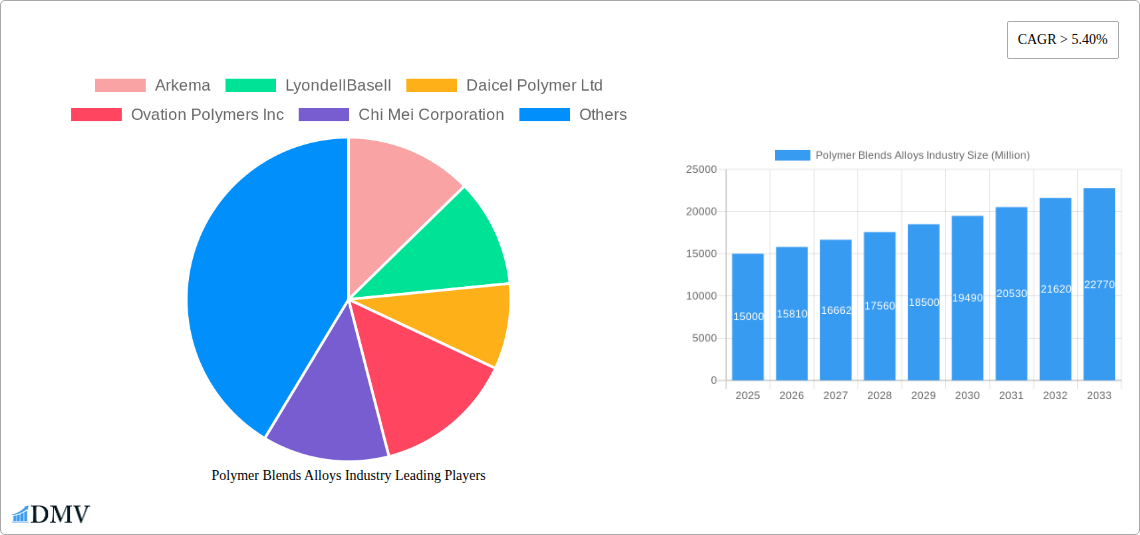
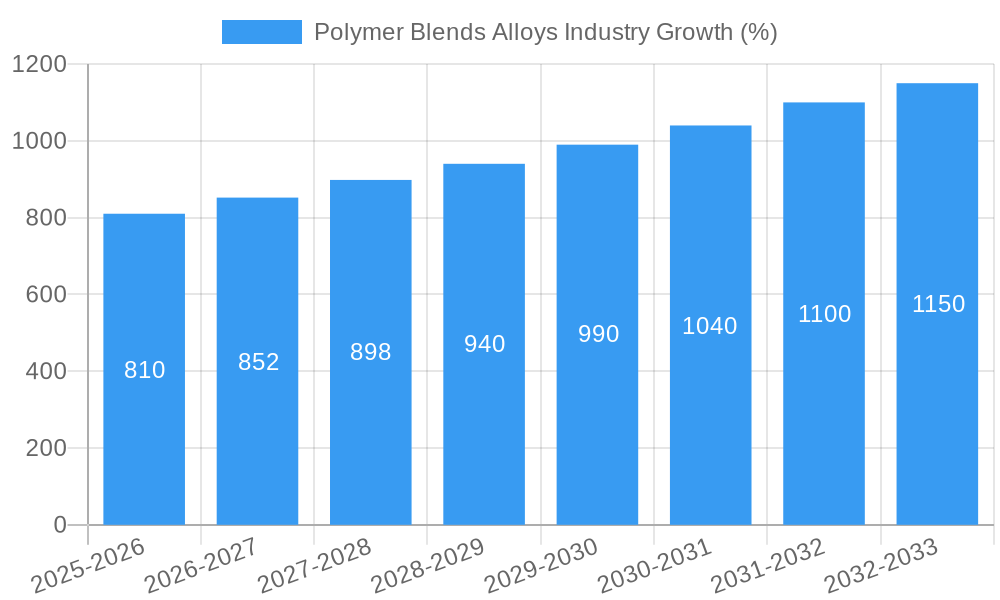
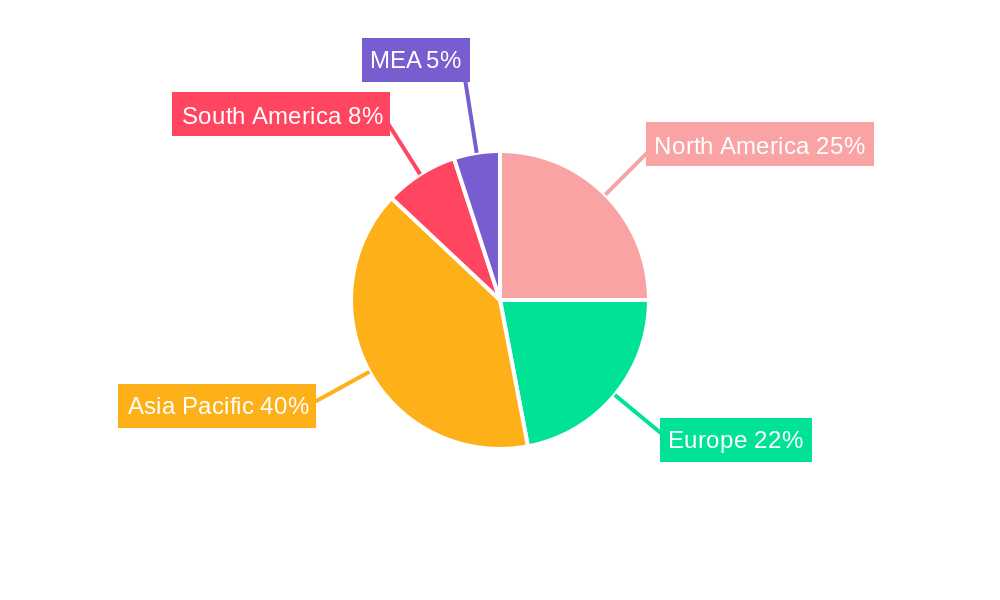
The Polymer Blends Alloys market is experiencing robust growth, projected to maintain a Compound Annual Growth Rate (CAGR) exceeding 5.40% from 2025 to 2033. This expansion is driven by increasing demand across diverse end-user industries, particularly automotive, electrical and electronics, and aerospace. The automotive sector's push for lightweighting and enhanced performance characteristics fuels the adoption of polymer blends, while the electronics industry leverages their superior electrical insulation and thermal management properties. Furthermore, advancements in material science are leading to the development of high-performance polymer blends with tailored properties, catering to specific application requirements. The rising preference for sustainable and recyclable materials further contributes to market growth. Polycarbonate and PPE/PPO segments hold significant market share, owing to their excellent mechanical strength, durability, and chemical resistance. Geographically, Asia Pacific is expected to dominate the market, fueled by rapid industrialization and substantial manufacturing activities in countries like China and India. However, stringent regulatory frameworks regarding material safety and environmental concerns pose potential restraints to market growth. The competitive landscape is marked by the presence of both established global players and regional manufacturers, leading to intense innovation and strategic partnerships to meet growing demand.
The market segmentation reveals a clear focus on specific material types and end-user industries. The dominance of Polycarbonate and PPE/PPO highlights the importance of high-performance materials in key sectors. The regional breakdown emphasizes the opportunities in Asia Pacific, while North America and Europe maintain significant market shares due to established industrial infrastructure and technological advancements. Future growth will depend on continued innovation in material formulations, addressing environmental concerns, and expanding into new applications. Cost competitiveness and efficient supply chains will also play a crucial role in shaping the market dynamics in the coming years. This ongoing expansion underscores the strategic importance of polymer blend alloys in various sectors and promises continued growth opportunities for both established and emerging players.
Polymer Blends Alloys Industry: A Comprehensive Market Report (2019-2033)
This insightful report provides a comprehensive analysis of the Polymer Blends Alloys industry, offering a detailed overview of market trends, leading players, and future growth prospects. With a study period spanning 2019-2033, a base year of 2025, and a forecast period of 2025-2033, this report is an essential resource for stakeholders seeking to understand and capitalize on opportunities within this dynamic market. The global Polymer Blends Alloys market size is estimated at xx Million in 2025 and is projected to reach xx Million by 2033, exhibiting a CAGR of xx% during the forecast period.
Polymer Blends Alloys Industry Market Composition & Trends
The Polymer Blends Alloys market is characterized by a moderately concentrated landscape, with key players such as Arkema, LyondellBasell, BASF SE, and SABIC holding significant market share. Market share distribution in 2025 is estimated as follows: Arkema (xx%), LyondellBasell (xx%), BASF SE (xx%), SABIC (xx%), Others (xx%). Innovation is driven by the need for lighter, stronger, and more sustainable materials, particularly in the automotive and aerospace sectors. Stringent regulatory frameworks concerning material safety and environmental impact influence product development and manufacturing processes. Substitute products, such as advanced composites, pose a competitive challenge. End-user industries, particularly automotive and electrical & electronics, are major drivers of market growth. M&A activities have played a significant role in shaping the market landscape, with several notable deals exceeding xx Million in value over the past five years.
- Market Concentration: Moderately concentrated, with top players holding significant shares.
- Innovation Catalysts: Demand for lightweight, high-strength, and sustainable materials.
- Regulatory Landscape: Stringent regulations impacting material safety and environmental compliance.
- Substitute Products: Advanced composites present a competitive threat.
- End-User Profiles: Automotive, electrical & electronics, aerospace are key sectors.
- M&A Activities: Several deals valued at over xx Million in recent years, reshaping market dynamics.
Polymer Blends Alloys Industry Industry Evolution
The Polymer Blends Alloys industry has witnessed significant growth over the historical period (2019-2024), driven primarily by increasing demand from the automotive and electronics sectors. Technological advancements, such as the development of high-performance blends with enhanced properties (e.g., improved thermal stability, impact resistance, and flame retardancy), have fuelled market expansion. Shifting consumer preferences toward lightweight and fuel-efficient vehicles, coupled with the growing adoption of electronics, have further propelled market growth. The market exhibited a CAGR of xx% from 2019 to 2024, reaching a value of xx Million in 2024. Technological advancements, specifically in additive manufacturing and nano-composite technologies, are expected to drive further growth in the coming years, with an anticipated adoption rate of xx% by 2033. The market is poised for continued growth, driven by increasing demand from emerging applications such as 5G infrastructure and electric vehicles.
Leading Regions, Countries, or Segments in Polymer Blends Alloys Industry
The North American region holds a dominant position in the Polymer Blends Alloys market, primarily driven by robust automotive and aerospace industries. Strong investment in research and development, coupled with favorable government regulations, further contributes to the region's dominance. Within the type segments, Polycarbonate and PPE/PPO dominate, while the automotive and electrical & electronics end-user sectors are the largest consumers.
Key Drivers for North American Dominance:
- Robust automotive and aerospace sectors.
- Significant R&D investment.
- Favorable regulatory environment.
Dominant Segments:
- Type: Polycarbonate and PPE/PPO command the largest market shares.
- End-user Industry: Automotive and Electrical & Electronics lead in consumption.
Analysis of Dominance Factors: The strong manufacturing base in North America, combined with the high demand for high-performance materials in automotive and aerospace applications, significantly contributes to the regional market leadership. The mature and well-established supply chain networks further support this dominance.
Polymer Blends Alloys Industry Product Innovations
Recent innovations focus on enhanced material properties, such as improved strength-to-weight ratios, increased thermal resistance, and better flame retardancy. These advancements cater to the growing demands of lightweighting in automotive and aerospace applications, as well as enhanced performance requirements in electronics. Unique selling propositions include customized blend formulations tailored to specific application needs, and sustainable manufacturing processes aimed at reducing environmental impact.
Propelling Factors for Polymer Blends Alloys Industry Growth
Technological advancements, including the development of high-performance blends with improved properties, are a primary driver of market growth. The increasing demand from the automotive and electronics industries, fueled by the rising adoption of electric vehicles and advanced electronics, further contributes to market expansion. Favorable government regulations promoting the use of lightweight and sustainable materials also stimulate market growth.
Obstacles in the Polymer Blends Alloys Industry Market
Fluctuations in raw material prices and supply chain disruptions can significantly impact production costs and profitability. Stringent regulatory requirements related to material safety and environmental compliance pose challenges for manufacturers. Intense competition from established players and emerging market entrants exerts pressure on pricing and margins. The impact of these factors is estimated to reduce market growth by approximately xx% during the forecast period.
Future Opportunities in Polymer Blends Alloys Industry
Emerging opportunities lie in the development of new high-performance blends for applications in renewable energy, 5G infrastructure, and medical devices. The increasing demand for sustainable and biodegradable materials presents significant opportunities for manufacturers committed to environmentally friendly practices. Expanding into new markets, particularly in developing economies with growing industrial sectors, offers further potential for market expansion.
Major Players in the Polymer Blends Alloys Industry Ecosystem
- Arkema
- LyondellBasell
- Daicel Polymer Ltd
- Ovation Polymers Inc
- Chi Mei Corporation
- BASF SE
- SABIC
- Mitsubishi Engineering-Plastics Corporation
- JSR Corporation
- Covestro AG
- Donna Polymer
Key Developments in Polymer Blends Alloys Industry Industry
- 2022-Q4: Arkema launched a new high-performance polycarbonate blend optimized for automotive applications.
- 2023-Q1: LyondellBasell and SABIC announced a joint venture to expand production capacity of PPE/PPO blends.
- 2024-Q2: BASF SE invested xx Million in a new facility for the production of sustainable polymer blends. (Further developments can be added here as they occur).
Strategic Polymer Blends Alloys Industry Market Forecast
The Polymer Blends Alloys market is poised for continued growth, driven by technological innovation, increasing demand from key end-user industries, and favorable regulatory support. The market is expected to witness significant expansion in emerging markets, with substantial opportunities in the automotive, electronics, and renewable energy sectors. New product development and strategic partnerships will play a vital role in shaping the future of this dynamic industry.
Polymer Blends Alloys Industry Segmentation
-
1. Type
- 1.1. Polycarbonate
- 1.2. PPE/PPO
- 1.3. Others
-
2. End-user Industry
- 2.1. Automotive
- 2.2. Electrical and Electronics
- 2.3. Aerospace
- 2.4. Consumer Goods
- 2.5. Others
Polymer Blends Alloys Industry Segmentation By Geography
-
1. Asia Pacific
- 1.1. China
- 1.2. India
- 1.3. Japan
- 1.4. South Korea
- 1.5. Rest of Asia Pacific
-
2. North America
- 2.1. United States
- 2.2. Canada
- 2.3. Mexico
-
3. Europe
- 3.1. Germany
- 3.2. United Kingdom
- 3.3. France
- 3.4. Italy
- 3.5. Rest of Europe
-
4. South America
- 4.1. Brazil
- 4.2. Argentina
- 4.3. Rest of South America
-
5. Middle East and Africa
- 5.1. Saudi Arabia
- 5.2. South Africa
- 5.3. Rest of Middle East and Africa
Polymer Blends Alloys Industry REPORT HIGHLIGHTS
| Aspects | Details |
|---|---|
| Study Period | 2019-2033 |
| Base Year | 2024 |
| Estimated Year | 2025 |
| Forecast Period | 2025-2033 |
| Historical Period | 2019-2024 |
| Growth Rate | CAGR of > 5.40% from 2019-2033 |
| Segmentation |
|
Table of Contents
- 1. Introduction
- 1.1. Research Scope
- 1.2. Market Segmentation
- 1.3. Research Methodology
- 1.4. Definitions and Assumptions
- 2. Executive Summary
- 2.1. Introduction
- 3. Market Dynamics
- 3.1. Introduction
- 3.2. Market Drivers
- 3.2.1. ; Growing Demand from Electronics Segment; Other Drivers
- 3.3. Market Restrains
- 3.3.1. ; High Costs Involved in Processing and Manufacturing of Polymer Blends Alloys; Unfavorable Conditions Arising Due to COVID-19 Outbreak
- 3.4. Market Trends
- 3.4.1. Automotive Segment to Dominate the Market
- 4. Market Factor Analysis
- 4.1. Porters Five Forces
- 4.2. Supply/Value Chain
- 4.3. PESTEL analysis
- 4.4. Market Entropy
- 4.5. Patent/Trademark Analysis
- 5. Global Polymer Blends Alloys Industry Analysis, Insights and Forecast, 2019-2031
- 5.1. Market Analysis, Insights and Forecast - by Type
- 5.1.1. Polycarbonate
- 5.1.2. PPE/PPO
- 5.1.3. Others
- 5.2. Market Analysis, Insights and Forecast - by End-user Industry
- 5.2.1. Automotive
- 5.2.2. Electrical and Electronics
- 5.2.3. Aerospace
- 5.2.4. Consumer Goods
- 5.2.5. Others
- 5.3. Market Analysis, Insights and Forecast - by Region
- 5.3.1. Asia Pacific
- 5.3.2. North America
- 5.3.3. Europe
- 5.3.4. South America
- 5.3.5. Middle East and Africa
- 5.1. Market Analysis, Insights and Forecast - by Type
- 6. Asia Pacific Polymer Blends Alloys Industry Analysis, Insights and Forecast, 2019-2031
- 6.1. Market Analysis, Insights and Forecast - by Type
- 6.1.1. Polycarbonate
- 6.1.2. PPE/PPO
- 6.1.3. Others
- 6.2. Market Analysis, Insights and Forecast - by End-user Industry
- 6.2.1. Automotive
- 6.2.2. Electrical and Electronics
- 6.2.3. Aerospace
- 6.2.4. Consumer Goods
- 6.2.5. Others
- 6.1. Market Analysis, Insights and Forecast - by Type
- 7. North America Polymer Blends Alloys Industry Analysis, Insights and Forecast, 2019-2031
- 7.1. Market Analysis, Insights and Forecast - by Type
- 7.1.1. Polycarbonate
- 7.1.2. PPE/PPO
- 7.1.3. Others
- 7.2. Market Analysis, Insights and Forecast - by End-user Industry
- 7.2.1. Automotive
- 7.2.2. Electrical and Electronics
- 7.2.3. Aerospace
- 7.2.4. Consumer Goods
- 7.2.5. Others
- 7.1. Market Analysis, Insights and Forecast - by Type
- 8. Europe Polymer Blends Alloys Industry Analysis, Insights and Forecast, 2019-2031
- 8.1. Market Analysis, Insights and Forecast - by Type
- 8.1.1. Polycarbonate
- 8.1.2. PPE/PPO
- 8.1.3. Others
- 8.2. Market Analysis, Insights and Forecast - by End-user Industry
- 8.2.1. Automotive
- 8.2.2. Electrical and Electronics
- 8.2.3. Aerospace
- 8.2.4. Consumer Goods
- 8.2.5. Others
- 8.1. Market Analysis, Insights and Forecast - by Type
- 9. South America Polymer Blends Alloys Industry Analysis, Insights and Forecast, 2019-2031
- 9.1. Market Analysis, Insights and Forecast - by Type
- 9.1.1. Polycarbonate
- 9.1.2. PPE/PPO
- 9.1.3. Others
- 9.2. Market Analysis, Insights and Forecast - by End-user Industry
- 9.2.1. Automotive
- 9.2.2. Electrical and Electronics
- 9.2.3. Aerospace
- 9.2.4. Consumer Goods
- 9.2.5. Others
- 9.1. Market Analysis, Insights and Forecast - by Type
- 10. Middle East and Africa Polymer Blends Alloys Industry Analysis, Insights and Forecast, 2019-2031
- 10.1. Market Analysis, Insights and Forecast - by Type
- 10.1.1. Polycarbonate
- 10.1.2. PPE/PPO
- 10.1.3. Others
- 10.2. Market Analysis, Insights and Forecast - by End-user Industry
- 10.2.1. Automotive
- 10.2.2. Electrical and Electronics
- 10.2.3. Aerospace
- 10.2.4. Consumer Goods
- 10.2.5. Others
- 10.1. Market Analysis, Insights and Forecast - by Type
- 11. North America Polymer Blends Alloys Industry Analysis, Insights and Forecast, 2019-2031
- 11.1. Market Analysis, Insights and Forecast - By Country/Sub-region
- 11.1.1 United States
- 11.1.2 Canada
- 11.1.3 Mexico
- 12. Europe Polymer Blends Alloys Industry Analysis, Insights and Forecast, 2019-2031
- 12.1. Market Analysis, Insights and Forecast - By Country/Sub-region
- 12.1.1 Germany
- 12.1.2 France
- 12.1.3 Italy
- 12.1.4 United Kingdom
- 12.1.5 Netherlands
- 12.1.6 Rest of Europe
- 13. Asia Pacific Polymer Blends Alloys Industry Analysis, Insights and Forecast, 2019-2031
- 13.1. Market Analysis, Insights and Forecast - By Country/Sub-region
- 13.1.1 China
- 13.1.2 Japan
- 13.1.3 India
- 13.1.4 South Korea
- 13.1.5 Taiwan
- 13.1.6 Australia
- 13.1.7 Rest of Asia-Pacific
- 14. South America Polymer Blends Alloys Industry Analysis, Insights and Forecast, 2019-2031
- 14.1. Market Analysis, Insights and Forecast - By Country/Sub-region
- 14.1.1 Brazil
- 14.1.2 Argentina
- 14.1.3 Rest of South America
- 15. MEA Polymer Blends Alloys Industry Analysis, Insights and Forecast, 2019-2031
- 15.1. Market Analysis, Insights and Forecast - By Country/Sub-region
- 15.1.1 Middle East
- 15.1.2 Africa
- 16. Competitive Analysis
- 16.1. Global Market Share Analysis 2024
- 16.2. Company Profiles
- 16.2.1 Arkema
- 16.2.1.1. Overview
- 16.2.1.2. Products
- 16.2.1.3. SWOT Analysis
- 16.2.1.4. Recent Developments
- 16.2.1.5. Financials (Based on Availability)
- 16.2.2 LyondellBasell
- 16.2.2.1. Overview
- 16.2.2.2. Products
- 16.2.2.3. SWOT Analysis
- 16.2.2.4. Recent Developments
- 16.2.2.5. Financials (Based on Availability)
- 16.2.3 Daicel Polymer Ltd
- 16.2.3.1. Overview
- 16.2.3.2. Products
- 16.2.3.3. SWOT Analysis
- 16.2.3.4. Recent Developments
- 16.2.3.5. Financials (Based on Availability)
- 16.2.4 Ovation Polymers Inc
- 16.2.4.1. Overview
- 16.2.4.2. Products
- 16.2.4.3. SWOT Analysis
- 16.2.4.4. Recent Developments
- 16.2.4.5. Financials (Based on Availability)
- 16.2.5 Chi Mei Corporation
- 16.2.5.1. Overview
- 16.2.5.2. Products
- 16.2.5.3. SWOT Analysis
- 16.2.5.4. Recent Developments
- 16.2.5.5. Financials (Based on Availability)
- 16.2.6 BASF SE
- 16.2.6.1. Overview
- 16.2.6.2. Products
- 16.2.6.3. SWOT Analysis
- 16.2.6.4. Recent Developments
- 16.2.6.5. Financials (Based on Availability)
- 16.2.7 SABIC
- 16.2.7.1. Overview
- 16.2.7.2. Products
- 16.2.7.3. SWOT Analysis
- 16.2.7.4. Recent Developments
- 16.2.7.5. Financials (Based on Availability)
- 16.2.8 Mitsubishi Engineering-Plastics Corporation
- 16.2.8.1. Overview
- 16.2.8.2. Products
- 16.2.8.3. SWOT Analysis
- 16.2.8.4. Recent Developments
- 16.2.8.5. Financials (Based on Availability)
- 16.2.9 JSR Corporation
- 16.2.9.1. Overview
- 16.2.9.2. Products
- 16.2.9.3. SWOT Analysis
- 16.2.9.4. Recent Developments
- 16.2.9.5. Financials (Based on Availability)
- 16.2.10 Covestro AG
- 16.2.10.1. Overview
- 16.2.10.2. Products
- 16.2.10.3. SWOT Analysis
- 16.2.10.4. Recent Developments
- 16.2.10.5. Financials (Based on Availability)
- 16.2.11 Donna Polymer
- 16.2.11.1. Overview
- 16.2.11.2. Products
- 16.2.11.3. SWOT Analysis
- 16.2.11.4. Recent Developments
- 16.2.11.5. Financials (Based on Availability)
- 16.2.1 Arkema
List of Figures
- Figure 1: Global Polymer Blends Alloys Industry Revenue Breakdown (Million, %) by Region 2024 & 2032
- Figure 2: Global Polymer Blends Alloys Industry Volume Breakdown (K Tons, %) by Region 2024 & 2032
- Figure 3: North America Polymer Blends Alloys Industry Revenue (Million), by Country 2024 & 2032
- Figure 4: North America Polymer Blends Alloys Industry Volume (K Tons), by Country 2024 & 2032
- Figure 5: North America Polymer Blends Alloys Industry Revenue Share (%), by Country 2024 & 2032
- Figure 6: North America Polymer Blends Alloys Industry Volume Share (%), by Country 2024 & 2032
- Figure 7: Europe Polymer Blends Alloys Industry Revenue (Million), by Country 2024 & 2032
- Figure 8: Europe Polymer Blends Alloys Industry Volume (K Tons), by Country 2024 & 2032
- Figure 9: Europe Polymer Blends Alloys Industry Revenue Share (%), by Country 2024 & 2032
- Figure 10: Europe Polymer Blends Alloys Industry Volume Share (%), by Country 2024 & 2032
- Figure 11: Asia Pacific Polymer Blends Alloys Industry Revenue (Million), by Country 2024 & 2032
- Figure 12: Asia Pacific Polymer Blends Alloys Industry Volume (K Tons), by Country 2024 & 2032
- Figure 13: Asia Pacific Polymer Blends Alloys Industry Revenue Share (%), by Country 2024 & 2032
- Figure 14: Asia Pacific Polymer Blends Alloys Industry Volume Share (%), by Country 2024 & 2032
- Figure 15: South America Polymer Blends Alloys Industry Revenue (Million), by Country 2024 & 2032
- Figure 16: South America Polymer Blends Alloys Industry Volume (K Tons), by Country 2024 & 2032
- Figure 17: South America Polymer Blends Alloys Industry Revenue Share (%), by Country 2024 & 2032
- Figure 18: South America Polymer Blends Alloys Industry Volume Share (%), by Country 2024 & 2032
- Figure 19: MEA Polymer Blends Alloys Industry Revenue (Million), by Country 2024 & 2032
- Figure 20: MEA Polymer Blends Alloys Industry Volume (K Tons), by Country 2024 & 2032
- Figure 21: MEA Polymer Blends Alloys Industry Revenue Share (%), by Country 2024 & 2032
- Figure 22: MEA Polymer Blends Alloys Industry Volume Share (%), by Country 2024 & 2032
- Figure 23: Asia Pacific Polymer Blends Alloys Industry Revenue (Million), by Type 2024 & 2032
- Figure 24: Asia Pacific Polymer Blends Alloys Industry Volume (K Tons), by Type 2024 & 2032
- Figure 25: Asia Pacific Polymer Blends Alloys Industry Revenue Share (%), by Type 2024 & 2032
- Figure 26: Asia Pacific Polymer Blends Alloys Industry Volume Share (%), by Type 2024 & 2032
- Figure 27: Asia Pacific Polymer Blends Alloys Industry Revenue (Million), by End-user Industry 2024 & 2032
- Figure 28: Asia Pacific Polymer Blends Alloys Industry Volume (K Tons), by End-user Industry 2024 & 2032
- Figure 29: Asia Pacific Polymer Blends Alloys Industry Revenue Share (%), by End-user Industry 2024 & 2032
- Figure 30: Asia Pacific Polymer Blends Alloys Industry Volume Share (%), by End-user Industry 2024 & 2032
- Figure 31: Asia Pacific Polymer Blends Alloys Industry Revenue (Million), by Country 2024 & 2032
- Figure 32: Asia Pacific Polymer Blends Alloys Industry Volume (K Tons), by Country 2024 & 2032
- Figure 33: Asia Pacific Polymer Blends Alloys Industry Revenue Share (%), by Country 2024 & 2032
- Figure 34: Asia Pacific Polymer Blends Alloys Industry Volume Share (%), by Country 2024 & 2032
- Figure 35: North America Polymer Blends Alloys Industry Revenue (Million), by Type 2024 & 2032
- Figure 36: North America Polymer Blends Alloys Industry Volume (K Tons), by Type 2024 & 2032
- Figure 37: North America Polymer Blends Alloys Industry Revenue Share (%), by Type 2024 & 2032
- Figure 38: North America Polymer Blends Alloys Industry Volume Share (%), by Type 2024 & 2032
- Figure 39: North America Polymer Blends Alloys Industry Revenue (Million), by End-user Industry 2024 & 2032
- Figure 40: North America Polymer Blends Alloys Industry Volume (K Tons), by End-user Industry 2024 & 2032
- Figure 41: North America Polymer Blends Alloys Industry Revenue Share (%), by End-user Industry 2024 & 2032
- Figure 42: North America Polymer Blends Alloys Industry Volume Share (%), by End-user Industry 2024 & 2032
- Figure 43: North America Polymer Blends Alloys Industry Revenue (Million), by Country 2024 & 2032
- Figure 44: North America Polymer Blends Alloys Industry Volume (K Tons), by Country 2024 & 2032
- Figure 45: North America Polymer Blends Alloys Industry Revenue Share (%), by Country 2024 & 2032
- Figure 46: North America Polymer Blends Alloys Industry Volume Share (%), by Country 2024 & 2032
- Figure 47: Europe Polymer Blends Alloys Industry Revenue (Million), by Type 2024 & 2032
- Figure 48: Europe Polymer Blends Alloys Industry Volume (K Tons), by Type 2024 & 2032
- Figure 49: Europe Polymer Blends Alloys Industry Revenue Share (%), by Type 2024 & 2032
- Figure 50: Europe Polymer Blends Alloys Industry Volume Share (%), by Type 2024 & 2032
- Figure 51: Europe Polymer Blends Alloys Industry Revenue (Million), by End-user Industry 2024 & 2032
- Figure 52: Europe Polymer Blends Alloys Industry Volume (K Tons), by End-user Industry 2024 & 2032
- Figure 53: Europe Polymer Blends Alloys Industry Revenue Share (%), by End-user Industry 2024 & 2032
- Figure 54: Europe Polymer Blends Alloys Industry Volume Share (%), by End-user Industry 2024 & 2032
- Figure 55: Europe Polymer Blends Alloys Industry Revenue (Million), by Country 2024 & 2032
- Figure 56: Europe Polymer Blends Alloys Industry Volume (K Tons), by Country 2024 & 2032
- Figure 57: Europe Polymer Blends Alloys Industry Revenue Share (%), by Country 2024 & 2032
- Figure 58: Europe Polymer Blends Alloys Industry Volume Share (%), by Country 2024 & 2032
- Figure 59: South America Polymer Blends Alloys Industry Revenue (Million), by Type 2024 & 2032
- Figure 60: South America Polymer Blends Alloys Industry Volume (K Tons), by Type 2024 & 2032
- Figure 61: South America Polymer Blends Alloys Industry Revenue Share (%), by Type 2024 & 2032
- Figure 62: South America Polymer Blends Alloys Industry Volume Share (%), by Type 2024 & 2032
- Figure 63: South America Polymer Blends Alloys Industry Revenue (Million), by End-user Industry 2024 & 2032
- Figure 64: South America Polymer Blends Alloys Industry Volume (K Tons), by End-user Industry 2024 & 2032
- Figure 65: South America Polymer Blends Alloys Industry Revenue Share (%), by End-user Industry 2024 & 2032
- Figure 66: South America Polymer Blends Alloys Industry Volume Share (%), by End-user Industry 2024 & 2032
- Figure 67: South America Polymer Blends Alloys Industry Revenue (Million), by Country 2024 & 2032
- Figure 68: South America Polymer Blends Alloys Industry Volume (K Tons), by Country 2024 & 2032
- Figure 69: South America Polymer Blends Alloys Industry Revenue Share (%), by Country 2024 & 2032
- Figure 70: South America Polymer Blends Alloys Industry Volume Share (%), by Country 2024 & 2032
- Figure 71: Middle East and Africa Polymer Blends Alloys Industry Revenue (Million), by Type 2024 & 2032
- Figure 72: Middle East and Africa Polymer Blends Alloys Industry Volume (K Tons), by Type 2024 & 2032
- Figure 73: Middle East and Africa Polymer Blends Alloys Industry Revenue Share (%), by Type 2024 & 2032
- Figure 74: Middle East and Africa Polymer Blends Alloys Industry Volume Share (%), by Type 2024 & 2032
- Figure 75: Middle East and Africa Polymer Blends Alloys Industry Revenue (Million), by End-user Industry 2024 & 2032
- Figure 76: Middle East and Africa Polymer Blends Alloys Industry Volume (K Tons), by End-user Industry 2024 & 2032
- Figure 77: Middle East and Africa Polymer Blends Alloys Industry Revenue Share (%), by End-user Industry 2024 & 2032
- Figure 78: Middle East and Africa Polymer Blends Alloys Industry Volume Share (%), by End-user Industry 2024 & 2032
- Figure 79: Middle East and Africa Polymer Blends Alloys Industry Revenue (Million), by Country 2024 & 2032
- Figure 80: Middle East and Africa Polymer Blends Alloys Industry Volume (K Tons), by Country 2024 & 2032
- Figure 81: Middle East and Africa Polymer Blends Alloys Industry Revenue Share (%), by Country 2024 & 2032
- Figure 82: Middle East and Africa Polymer Blends Alloys Industry Volume Share (%), by Country 2024 & 2032
List of Tables
- Table 1: Global Polymer Blends Alloys Industry Revenue Million Forecast, by Region 2019 & 2032
- Table 2: Global Polymer Blends Alloys Industry Volume K Tons Forecast, by Region 2019 & 2032
- Table 3: Global Polymer Blends Alloys Industry Revenue Million Forecast, by Type 2019 & 2032
- Table 4: Global Polymer Blends Alloys Industry Volume K Tons Forecast, by Type 2019 & 2032
- Table 5: Global Polymer Blends Alloys Industry Revenue Million Forecast, by End-user Industry 2019 & 2032
- Table 6: Global Polymer Blends Alloys Industry Volume K Tons Forecast, by End-user Industry 2019 & 2032
- Table 7: Global Polymer Blends Alloys Industry Revenue Million Forecast, by Region 2019 & 2032
- Table 8: Global Polymer Blends Alloys Industry Volume K Tons Forecast, by Region 2019 & 2032
- Table 9: Global Polymer Blends Alloys Industry Revenue Million Forecast, by Country 2019 & 2032
- Table 10: Global Polymer Blends Alloys Industry Volume K Tons Forecast, by Country 2019 & 2032
- Table 11: United States Polymer Blends Alloys Industry Revenue (Million) Forecast, by Application 2019 & 2032
- Table 12: United States Polymer Blends Alloys Industry Volume (K Tons) Forecast, by Application 2019 & 2032
- Table 13: Canada Polymer Blends Alloys Industry Revenue (Million) Forecast, by Application 2019 & 2032
- Table 14: Canada Polymer Blends Alloys Industry Volume (K Tons) Forecast, by Application 2019 & 2032
- Table 15: Mexico Polymer Blends Alloys Industry Revenue (Million) Forecast, by Application 2019 & 2032
- Table 16: Mexico Polymer Blends Alloys Industry Volume (K Tons) Forecast, by Application 2019 & 2032
- Table 17: Global Polymer Blends Alloys Industry Revenue Million Forecast, by Country 2019 & 2032
- Table 18: Global Polymer Blends Alloys Industry Volume K Tons Forecast, by Country 2019 & 2032
- Table 19: Germany Polymer Blends Alloys Industry Revenue (Million) Forecast, by Application 2019 & 2032
- Table 20: Germany Polymer Blends Alloys Industry Volume (K Tons) Forecast, by Application 2019 & 2032
- Table 21: France Polymer Blends Alloys Industry Revenue (Million) Forecast, by Application 2019 & 2032
- Table 22: France Polymer Blends Alloys Industry Volume (K Tons) Forecast, by Application 2019 & 2032
- Table 23: Italy Polymer Blends Alloys Industry Revenue (Million) Forecast, by Application 2019 & 2032
- Table 24: Italy Polymer Blends Alloys Industry Volume (K Tons) Forecast, by Application 2019 & 2032
- Table 25: United Kingdom Polymer Blends Alloys Industry Revenue (Million) Forecast, by Application 2019 & 2032
- Table 26: United Kingdom Polymer Blends Alloys Industry Volume (K Tons) Forecast, by Application 2019 & 2032
- Table 27: Netherlands Polymer Blends Alloys Industry Revenue (Million) Forecast, by Application 2019 & 2032
- Table 28: Netherlands Polymer Blends Alloys Industry Volume (K Tons) Forecast, by Application 2019 & 2032
- Table 29: Rest of Europe Polymer Blends Alloys Industry Revenue (Million) Forecast, by Application 2019 & 2032
- Table 30: Rest of Europe Polymer Blends Alloys Industry Volume (K Tons) Forecast, by Application 2019 & 2032
- Table 31: Global Polymer Blends Alloys Industry Revenue Million Forecast, by Country 2019 & 2032
- Table 32: Global Polymer Blends Alloys Industry Volume K Tons Forecast, by Country 2019 & 2032
- Table 33: China Polymer Blends Alloys Industry Revenue (Million) Forecast, by Application 2019 & 2032
- Table 34: China Polymer Blends Alloys Industry Volume (K Tons) Forecast, by Application 2019 & 2032
- Table 35: Japan Polymer Blends Alloys Industry Revenue (Million) Forecast, by Application 2019 & 2032
- Table 36: Japan Polymer Blends Alloys Industry Volume (K Tons) Forecast, by Application 2019 & 2032
- Table 37: India Polymer Blends Alloys Industry Revenue (Million) Forecast, by Application 2019 & 2032
- Table 38: India Polymer Blends Alloys Industry Volume (K Tons) Forecast, by Application 2019 & 2032
- Table 39: South Korea Polymer Blends Alloys Industry Revenue (Million) Forecast, by Application 2019 & 2032
- Table 40: South Korea Polymer Blends Alloys Industry Volume (K Tons) Forecast, by Application 2019 & 2032
- Table 41: Taiwan Polymer Blends Alloys Industry Revenue (Million) Forecast, by Application 2019 & 2032
- Table 42: Taiwan Polymer Blends Alloys Industry Volume (K Tons) Forecast, by Application 2019 & 2032
- Table 43: Australia Polymer Blends Alloys Industry Revenue (Million) Forecast, by Application 2019 & 2032
- Table 44: Australia Polymer Blends Alloys Industry Volume (K Tons) Forecast, by Application 2019 & 2032
- Table 45: Rest of Asia-Pacific Polymer Blends Alloys Industry Revenue (Million) Forecast, by Application 2019 & 2032
- Table 46: Rest of Asia-Pacific Polymer Blends Alloys Industry Volume (K Tons) Forecast, by Application 2019 & 2032
- Table 47: Global Polymer Blends Alloys Industry Revenue Million Forecast, by Country 2019 & 2032
- Table 48: Global Polymer Blends Alloys Industry Volume K Tons Forecast, by Country 2019 & 2032
- Table 49: Brazil Polymer Blends Alloys Industry Revenue (Million) Forecast, by Application 2019 & 2032
- Table 50: Brazil Polymer Blends Alloys Industry Volume (K Tons) Forecast, by Application 2019 & 2032
- Table 51: Argentina Polymer Blends Alloys Industry Revenue (Million) Forecast, by Application 2019 & 2032
- Table 52: Argentina Polymer Blends Alloys Industry Volume (K Tons) Forecast, by Application 2019 & 2032
- Table 53: Rest of South America Polymer Blends Alloys Industry Revenue (Million) Forecast, by Application 2019 & 2032
- Table 54: Rest of South America Polymer Blends Alloys Industry Volume (K Tons) Forecast, by Application 2019 & 2032
- Table 55: Global Polymer Blends Alloys Industry Revenue Million Forecast, by Country 2019 & 2032
- Table 56: Global Polymer Blends Alloys Industry Volume K Tons Forecast, by Country 2019 & 2032
- Table 57: Middle East Polymer Blends Alloys Industry Revenue (Million) Forecast, by Application 2019 & 2032
- Table 58: Middle East Polymer Blends Alloys Industry Volume (K Tons) Forecast, by Application 2019 & 2032
- Table 59: Africa Polymer Blends Alloys Industry Revenue (Million) Forecast, by Application 2019 & 2032
- Table 60: Africa Polymer Blends Alloys Industry Volume (K Tons) Forecast, by Application 2019 & 2032
- Table 61: Global Polymer Blends Alloys Industry Revenue Million Forecast, by Type 2019 & 2032
- Table 62: Global Polymer Blends Alloys Industry Volume K Tons Forecast, by Type 2019 & 2032
- Table 63: Global Polymer Blends Alloys Industry Revenue Million Forecast, by End-user Industry 2019 & 2032
- Table 64: Global Polymer Blends Alloys Industry Volume K Tons Forecast, by End-user Industry 2019 & 2032
- Table 65: Global Polymer Blends Alloys Industry Revenue Million Forecast, by Country 2019 & 2032
- Table 66: Global Polymer Blends Alloys Industry Volume K Tons Forecast, by Country 2019 & 2032
- Table 67: China Polymer Blends Alloys Industry Revenue (Million) Forecast, by Application 2019 & 2032
- Table 68: China Polymer Blends Alloys Industry Volume (K Tons) Forecast, by Application 2019 & 2032
- Table 69: India Polymer Blends Alloys Industry Revenue (Million) Forecast, by Application 2019 & 2032
- Table 70: India Polymer Blends Alloys Industry Volume (K Tons) Forecast, by Application 2019 & 2032
- Table 71: Japan Polymer Blends Alloys Industry Revenue (Million) Forecast, by Application 2019 & 2032
- Table 72: Japan Polymer Blends Alloys Industry Volume (K Tons) Forecast, by Application 2019 & 2032
- Table 73: South Korea Polymer Blends Alloys Industry Revenue (Million) Forecast, by Application 2019 & 2032
- Table 74: South Korea Polymer Blends Alloys Industry Volume (K Tons) Forecast, by Application 2019 & 2032
- Table 75: Rest of Asia Pacific Polymer Blends Alloys Industry Revenue (Million) Forecast, by Application 2019 & 2032
- Table 76: Rest of Asia Pacific Polymer Blends Alloys Industry Volume (K Tons) Forecast, by Application 2019 & 2032
- Table 77: Global Polymer Blends Alloys Industry Revenue Million Forecast, by Type 2019 & 2032
- Table 78: Global Polymer Blends Alloys Industry Volume K Tons Forecast, by Type 2019 & 2032
- Table 79: Global Polymer Blends Alloys Industry Revenue Million Forecast, by End-user Industry 2019 & 2032
- Table 80: Global Polymer Blends Alloys Industry Volume K Tons Forecast, by End-user Industry 2019 & 2032
- Table 81: Global Polymer Blends Alloys Industry Revenue Million Forecast, by Country 2019 & 2032
- Table 82: Global Polymer Blends Alloys Industry Volume K Tons Forecast, by Country 2019 & 2032
- Table 83: United States Polymer Blends Alloys Industry Revenue (Million) Forecast, by Application 2019 & 2032
- Table 84: United States Polymer Blends Alloys Industry Volume (K Tons) Forecast, by Application 2019 & 2032
- Table 85: Canada Polymer Blends Alloys Industry Revenue (Million) Forecast, by Application 2019 & 2032
- Table 86: Canada Polymer Blends Alloys Industry Volume (K Tons) Forecast, by Application 2019 & 2032
- Table 87: Mexico Polymer Blends Alloys Industry Revenue (Million) Forecast, by Application 2019 & 2032
- Table 88: Mexico Polymer Blends Alloys Industry Volume (K Tons) Forecast, by Application 2019 & 2032
- Table 89: Global Polymer Blends Alloys Industry Revenue Million Forecast, by Type 2019 & 2032
- Table 90: Global Polymer Blends Alloys Industry Volume K Tons Forecast, by Type 2019 & 2032
- Table 91: Global Polymer Blends Alloys Industry Revenue Million Forecast, by End-user Industry 2019 & 2032
- Table 92: Global Polymer Blends Alloys Industry Volume K Tons Forecast, by End-user Industry 2019 & 2032
- Table 93: Global Polymer Blends Alloys Industry Revenue Million Forecast, by Country 2019 & 2032
- Table 94: Global Polymer Blends Alloys Industry Volume K Tons Forecast, by Country 2019 & 2032
- Table 95: Germany Polymer Blends Alloys Industry Revenue (Million) Forecast, by Application 2019 & 2032
- Table 96: Germany Polymer Blends Alloys Industry Volume (K Tons) Forecast, by Application 2019 & 2032
- Table 97: United Kingdom Polymer Blends Alloys Industry Revenue (Million) Forecast, by Application 2019 & 2032
- Table 98: United Kingdom Polymer Blends Alloys Industry Volume (K Tons) Forecast, by Application 2019 & 2032
- Table 99: France Polymer Blends Alloys Industry Revenue (Million) Forecast, by Application 2019 & 2032
- Table 100: France Polymer Blends Alloys Industry Volume (K Tons) Forecast, by Application 2019 & 2032
- Table 101: Italy Polymer Blends Alloys Industry Revenue (Million) Forecast, by Application 2019 & 2032
- Table 102: Italy Polymer Blends Alloys Industry Volume (K Tons) Forecast, by Application 2019 & 2032
- Table 103: Rest of Europe Polymer Blends Alloys Industry Revenue (Million) Forecast, by Application 2019 & 2032
- Table 104: Rest of Europe Polymer Blends Alloys Industry Volume (K Tons) Forecast, by Application 2019 & 2032
- Table 105: Global Polymer Blends Alloys Industry Revenue Million Forecast, by Type 2019 & 2032
- Table 106: Global Polymer Blends Alloys Industry Volume K Tons Forecast, by Type 2019 & 2032
- Table 107: Global Polymer Blends Alloys Industry Revenue Million Forecast, by End-user Industry 2019 & 2032
- Table 108: Global Polymer Blends Alloys Industry Volume K Tons Forecast, by End-user Industry 2019 & 2032
- Table 109: Global Polymer Blends Alloys Industry Revenue Million Forecast, by Country 2019 & 2032
- Table 110: Global Polymer Blends Alloys Industry Volume K Tons Forecast, by Country 2019 & 2032
- Table 111: Brazil Polymer Blends Alloys Industry Revenue (Million) Forecast, by Application 2019 & 2032
- Table 112: Brazil Polymer Blends Alloys Industry Volume (K Tons) Forecast, by Application 2019 & 2032
- Table 113: Argentina Polymer Blends Alloys Industry Revenue (Million) Forecast, by Application 2019 & 2032
- Table 114: Argentina Polymer Blends Alloys Industry Volume (K Tons) Forecast, by Application 2019 & 2032
- Table 115: Rest of South America Polymer Blends Alloys Industry Revenue (Million) Forecast, by Application 2019 & 2032
- Table 116: Rest of South America Polymer Blends Alloys Industry Volume (K Tons) Forecast, by Application 2019 & 2032
- Table 117: Global Polymer Blends Alloys Industry Revenue Million Forecast, by Type 2019 & 2032
- Table 118: Global Polymer Blends Alloys Industry Volume K Tons Forecast, by Type 2019 & 2032
- Table 119: Global Polymer Blends Alloys Industry Revenue Million Forecast, by End-user Industry 2019 & 2032
- Table 120: Global Polymer Blends Alloys Industry Volume K Tons Forecast, by End-user Industry 2019 & 2032
- Table 121: Global Polymer Blends Alloys Industry Revenue Million Forecast, by Country 2019 & 2032
- Table 122: Global Polymer Blends Alloys Industry Volume K Tons Forecast, by Country 2019 & 2032
- Table 123: Saudi Arabia Polymer Blends Alloys Industry Revenue (Million) Forecast, by Application 2019 & 2032
- Table 124: Saudi Arabia Polymer Blends Alloys Industry Volume (K Tons) Forecast, by Application 2019 & 2032
- Table 125: South Africa Polymer Blends Alloys Industry Revenue (Million) Forecast, by Application 2019 & 2032
- Table 126: South Africa Polymer Blends Alloys Industry Volume (K Tons) Forecast, by Application 2019 & 2032
- Table 127: Rest of Middle East and Africa Polymer Blends Alloys Industry Revenue (Million) Forecast, by Application 2019 & 2032
- Table 128: Rest of Middle East and Africa Polymer Blends Alloys Industry Volume (K Tons) Forecast, by Application 2019 & 2032
Frequently Asked Questions
1. What is the projected Compound Annual Growth Rate (CAGR) of the Polymer Blends Alloys Industry?
The projected CAGR is approximately > 5.40%.
2. Which companies are prominent players in the Polymer Blends Alloys Industry?
Key companies in the market include Arkema, LyondellBasell, Daicel Polymer Ltd, Ovation Polymers Inc, Chi Mei Corporation, BASF SE, SABIC, Mitsubishi Engineering-Plastics Corporation, JSR Corporation, Covestro AG, Donna Polymer.
3. What are the main segments of the Polymer Blends Alloys Industry?
The market segments include Type, End-user Industry.
4. Can you provide details about the market size?
The market size is estimated to be USD XX Million as of 2022.
5. What are some drivers contributing to market growth?
; Growing Demand from Electronics Segment; Other Drivers.
6. What are the notable trends driving market growth?
Automotive Segment to Dominate the Market.
7. Are there any restraints impacting market growth?
; High Costs Involved in Processing and Manufacturing of Polymer Blends Alloys; Unfavorable Conditions Arising Due to COVID-19 Outbreak.
8. Can you provide examples of recent developments in the market?
N/A
9. What pricing options are available for accessing the report?
Pricing options include single-user, multi-user, and enterprise licenses priced at USD 4750, USD 5250, and USD 8750 respectively.
10. Is the market size provided in terms of value or volume?
The market size is provided in terms of value, measured in Million and volume, measured in K Tons.
11. Are there any specific market keywords associated with the report?
Yes, the market keyword associated with the report is "Polymer Blends Alloys Industry," which aids in identifying and referencing the specific market segment covered.
12. How do I determine which pricing option suits my needs best?
The pricing options vary based on user requirements and access needs. Individual users may opt for single-user licenses, while businesses requiring broader access may choose multi-user or enterprise licenses for cost-effective access to the report.
13. Are there any additional resources or data provided in the Polymer Blends Alloys Industry report?
While the report offers comprehensive insights, it's advisable to review the specific contents or supplementary materials provided to ascertain if additional resources or data are available.
14. How can I stay updated on further developments or reports in the Polymer Blends Alloys Industry?
To stay informed about further developments, trends, and reports in the Polymer Blends Alloys Industry, consider subscribing to industry newsletters, following relevant companies and organizations, or regularly checking reputable industry news sources and publications.
Methodology
Step 1 - Identification of Relevant Samples Size from Population Database


Step 2 - Approaches for Defining Global Market Size (Value, Volume* & Price*)

Note*: In applicable scenarios
Step 3 - Data Sources
Primary Research
- Web Analytics
- Survey Reports
- Research Institute
- Latest Research Reports
- Opinion Leaders
Secondary Research
- Annual Reports
- White Paper
- Latest Press Release
- Industry Association
- Paid Database
- Investor Presentations

Step 4 - Data Triangulation
Involves using different sources of information in order to increase the validity of a study
These sources are likely to be stakeholders in a program - participants, other researchers, program staff, other community members, and so on.
Then we put all data in single framework & apply various statistical tools to find out the dynamic on the market.
During the analysis stage, feedback from the stakeholder groups would be compared to determine areas of agreement as well as areas of divergence
