

Key Insights
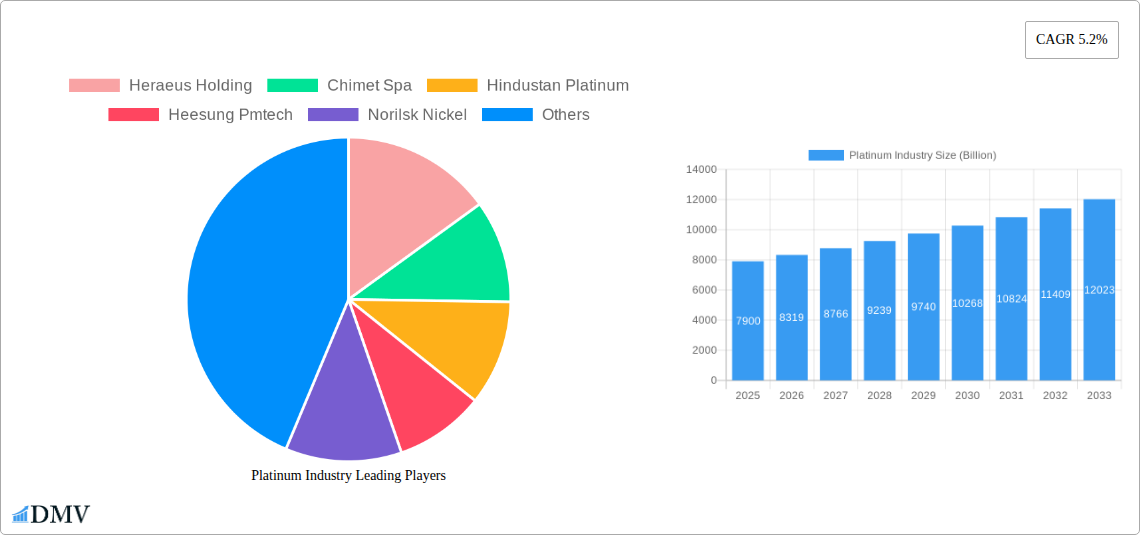
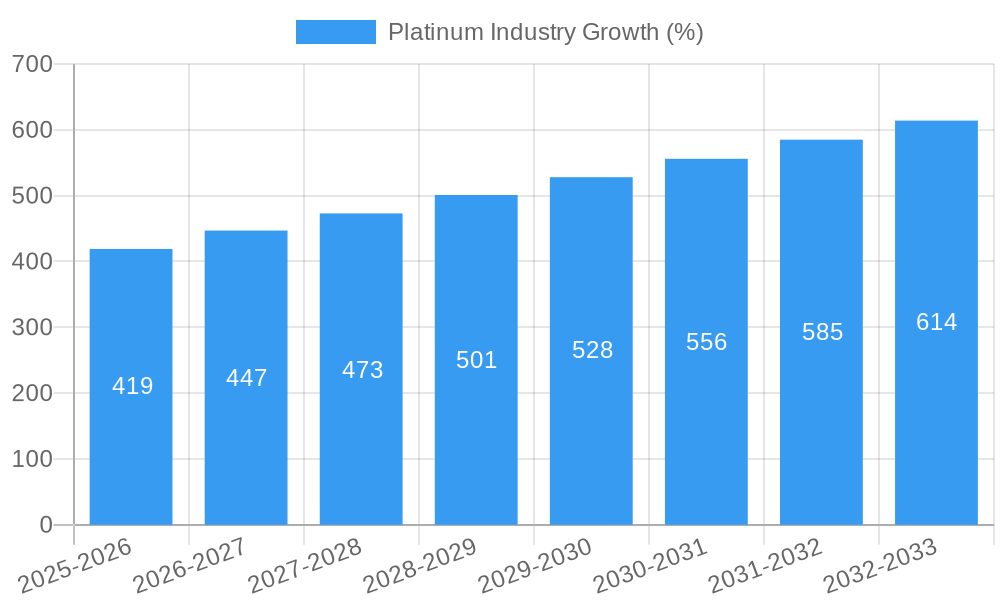
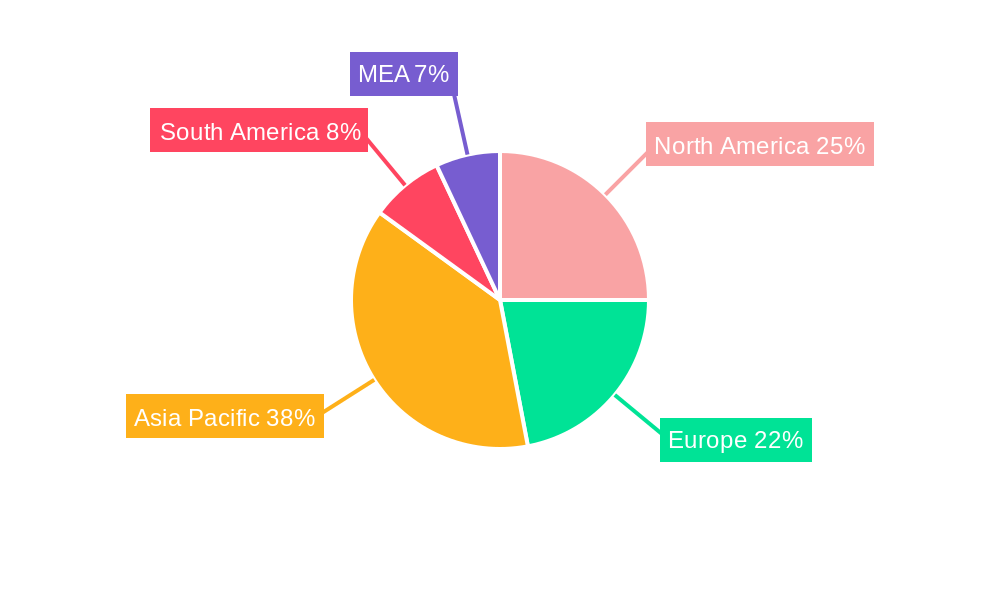
The global platinum market, valued at $7.9 billion in 2025, is projected to experience robust growth, driven by increasing demand across diverse sectors. A compound annual growth rate (CAGR) of 5.2% from 2025 to 2033 indicates a significant expansion, reaching an estimated $12.3 billion by 2033. Key growth drivers include the automotive industry's continued reliance on platinum group metals (PGMs) in catalytic converters, despite the rise of electric vehicles; the burgeoning electronics sector's use of platinum in various components; and the sustained demand from the jewelry industry. Furthermore, platinum's crucial role in chemical catalysis and glass production contributes to market stability. While potential restraints include fluctuating platinum prices influenced by supply chain dynamics and geopolitical factors, the overall market outlook remains positive, fueled by technological advancements and expanding applications across diverse industries. The market segmentation reveals a significant contribution from metal-form platinum, followed by powder and alloys. Primary sources currently dominate the supply chain, though secondary sources are likely to see increased relevance in the coming years due to recycling efforts and a growing focus on sustainability. Regional analysis indicates a strong presence in North America and Europe, with Asia-Pacific exhibiting high growth potential, particularly driven by China and India's expanding economies and industrialization.
The competitive landscape is characterized by established players such as Heraeus Holding, Johnson Matthey, and Sibanye-Stillwater, along with regional players focusing on specific applications or geographic markets. Ongoing innovation in platinum-based technologies and the exploration of new applications, particularly in areas like fuel cells and hydrogen technologies, are expected to further stimulate market expansion. The consistent demand from established sectors combined with the emergence of new applications promises a sustained trajectory of growth for the platinum market in the coming years. Strategic partnerships, mergers, and acquisitions are expected to shape the industry landscape, resulting in greater market consolidation. A focus on sustainable sourcing and responsible mining practices will also play a vital role in determining the future trajectory of the platinum market.
Platinum Industry Market Report: 2019-2033
This comprehensive report provides an in-depth analysis of the global platinum industry, projecting a market value exceeding $XX Billion by 2033. Covering the historical period (2019-2024), base year (2025), and forecast period (2025-2033), this study offers invaluable insights for stakeholders seeking to navigate this dynamic market. We delve into market composition, technological advancements, key players, and future opportunities, providing a robust foundation for strategic decision-making.
Platinum Industry Market Composition & Trends
This section analyzes the competitive landscape, innovation drivers, regulatory influences, and market dynamics within the $XX Billion platinum industry. We examine market share distribution among key players like Anglo American Platinum Limited, Sibanye-Stillwater, Impala Platinum Holdings Limited, and Norilsk Nickel, revealing a moderately concentrated market. The report quantifies M&A activity, including deal values totaling $XX Billion over the study period. Innovation is driven by the increasing demand for platinum in applications such as automotive catalysts and electronics, pushing continuous advancements in extraction and refining technologies. Stringent environmental regulations also play a significant role, shaping industry practices and investment strategies. Substitute materials present a competitive threat, requiring ongoing analysis of their cost-effectiveness and performance capabilities. Finally, end-user profiles are segmented by application (exhaust systems, jewelry, chemical catalysts, glass production, electronics, and other applications), providing a detailed understanding of market demand trends.
- Market Concentration: Moderately concentrated, with top players holding significant market share.
- M&A Activity: $XX Billion in deal value over 2019-2024.
- Key Players: Anglo American Platinum Limited, Sibanye-Stillwater, Impala Platinum Holdings Limited, Norilsk Nickel, Johnson Matthey, Heraeus Holding, Chimet Spa, Hindustan Platinum, Heesung Pmtech, Nihon Material Co Ltd, and Northam Platinum Holdings Limited.
- Substitute Products: Ongoing evaluation of substitute materials' impact on market dynamics.
Platinum Industry Industry Evolution
The platinum industry has witnessed significant evolution during the 2019-2033 period, marked by fluctuating growth trajectories influenced by economic cycles, technological advancements, and evolving consumer preferences. From 2019 to 2024, the market experienced an average annual growth rate (AAGR) of XX%, primarily driven by the increasing demand for platinum in the automotive and jewelry sectors. Technological innovations in refining and processing techniques have improved efficiency and reduced production costs, while shifting consumer preferences towards sustainable and ethically sourced platinum have impacted the market. The integration of advanced analytics and automation is enhancing operational efficiency and optimizing resource utilization. Demand projections for the forecast period (2025-2033) indicate an anticipated AAGR of XX%, driven by factors such as the increasing adoption of electric vehicles and the growth of emerging markets.
Leading Regions, Countries, or Segments in Platinum Industry
This section identifies the dominant regions, countries, and market segments within the platinum industry. While precise market share data requires in-depth analysis within the full report, we anticipate South Africa to maintain its position as the leading producer of primary platinum, driven by substantial reserves and established mining infrastructure. In terms of application, automotive catalysts continue to represent a significant segment, with consistent demand fueled by stringent emission regulations worldwide. The jewelry sector also remains a crucial segment, driven by ongoing consumer demand for platinum's precious metal attributes.
- Key Drivers for South Africa's Dominance: Abundant platinum reserves, well-established mining infrastructure, and government support.
- Key Drivers for Automotive Catalyst Segment: Stringent emission regulations globally, increasing vehicle production, and technological advancements in catalytic converter technology.
- Key Drivers for Jewelry Segment: Sustained consumer demand for platinum jewelry, its durability, and its association with luxury and prestige.
- Form: Metal remains the dominant form, followed by powder and alloys.
- Source: Primary sources dominate, though secondary refining is gaining traction for sustainability reasons.
Platinum Industry Product Innovations
Recent innovations focus on enhancing the performance and applications of platinum. This includes the development of advanced catalysts with increased efficiency and durability for automotive applications, as well as the creation of novel platinum alloys for specialized electronics and medical devices. These innovations are driven by the ongoing demand for improved performance and increased sustainability within various applications. Unique selling propositions include improved catalytic activity, enhanced durability, and superior electrical conductivity, contributing to growth within specific sectors.
Propelling Factors for Platinum Industry Growth
Several factors contribute to the growth trajectory of the platinum industry. Technological advancements, such as improved refining techniques and the development of more efficient catalysts, are enhancing production efficiency and lowering costs. Furthermore, economic growth, particularly in developing economies, drives increased demand for platinum in various applications. Stringent environmental regulations in several countries are also driving the demand for platinum-based emission control technologies.
Obstacles in the Platinum Industry Market
The platinum industry faces several challenges, including price volatility due to supply and demand fluctuations. Supply chain disruptions, particularly due to geopolitical events or mining operational issues, can significantly impact production and pricing. Intense competition among major players, including both primary producers and secondary refiners, can also affect market profitability. Finally, regulatory changes related to mining and environmental standards can increase operational costs and complexity.
Future Opportunities in Platinum Industry
The future of the platinum industry holds significant opportunities. The growth of electric vehicles (EVs) presents a potential market for platinum-based fuel cells. Furthermore, the ongoing development of new applications in fields such as medicine and electronics could create additional demand. The increasing focus on sustainable practices within the mining sector offers opportunities for companies that prioritize ethical sourcing and environmental responsibility.
Major Players in the Platinum Industry Ecosystem
- Heraeus Holding
- Chimet Spa
- Hindustan Platinum
- Heesung Pmtech
- Norilsk Nickel
- Impala Platinum Holdings Limited
- Northam Platinum Holdings Limited
- Nihon Material Co Ltd
- Johnson Matthey
- Sibanye-Stillwater
- Anglo American Platinum Limited
Key Developments in Platinum Industry Industry
- April 2022: Impala Platinum Holdings Limited's planned acquisition of Royal Bafokeng Platinum, creating one of the world's largest platinum miners.
- February 2022: Heraeus Holding and BASF SE's joint venture to recover precious metals from spent automotive catalysts in China.
Strategic Platinum Industry Market Forecast
The platinum industry is poised for sustained growth driven by technological advancements, increasing demand from emerging markets, and the continued importance of platinum in various crucial applications. The market is expected to witness considerable expansion in the coming years, with specific growth trajectories dependent on technological innovation, evolving regulations, and macroeconomic conditions. Strategic investments in research and development, coupled with sustainable mining practices, will play a critical role in shaping the future of this dynamic industry.
Platinum Industry Segmentation
-
1. Application
- 1.1. Exhaust Systems
- 1.2. Jewelry
- 1.3. Chemical Catalysts
- 1.4. Glass Production
- 1.5. Electronics
- 1.6. Other Applications
Platinum Industry Segmentation By Geography
-
1. Asia Pacific
- 1.1. China
- 1.2. India
- 1.3. Japan
- 1.4. South Korea
- 1.5. Rest of Asia Pacific
-
2. North America
- 2.1. United States
- 2.2. Canada
- 2.3. Mexico
-
3. Europe
- 3.1. Germany
- 3.2. United Kingdom
- 3.3. Italy
- 3.4. France
- 3.5. Rest of Europe
-
4. Rest Of The World
- 4.1. South America
- 4.2. Middle East and Africa
Platinum Industry REPORT HIGHLIGHTS
| Aspects | Details |
|---|---|
| Study Period | 2019-2033 |
| Base Year | 2024 |
| Estimated Year | 2025 |
| Forecast Period | 2025-2033 |
| Historical Period | 2019-2024 |
| Growth Rate | CAGR of 5.2% from 2019-2033 |
| Segmentation |
|
Table of Contents
- 1. Introduction
- 1.1. Research Scope
- 1.2. Market Segmentation
- 1.3. Research Methodology
- 1.4. Definitions and Assumptions
- 2. Executive Summary
- 2.1. Introduction
- 3. Market Dynamics
- 3.1. Introduction
- 3.2. Market Drivers
- 3.2.1. Increasing Usage in the Industrial Applications; Growing Demand for Applications in the Automotive Industry
- 3.3. Market Restrains
- 3.3.1. High Product Prices
- 3.4. Market Trends
- 3.4.1. Growing Demand for Exhaust Systems in Automobile Industry
- 4. Market Factor Analysis
- 4.1. Porters Five Forces
- 4.2. Supply/Value Chain
- 4.3. PESTEL analysis
- 4.4. Market Entropy
- 4.5. Patent/Trademark Analysis
- 5. Global Platinum Industry Analysis, Insights and Forecast, 2019-2031
- 5.1. Market Analysis, Insights and Forecast - by Application
- 5.1.1. Exhaust Systems
- 5.1.2. Jewelry
- 5.1.3. Chemical Catalysts
- 5.1.4. Glass Production
- 5.1.5. Electronics
- 5.1.6. Other Applications
- 5.2. Market Analysis, Insights and Forecast - by Region
- 5.2.1. Asia Pacific
- 5.2.2. North America
- 5.2.3. Europe
- 5.2.4. Rest Of The World
- 5.1. Market Analysis, Insights and Forecast - by Application
- 6. Asia Pacific Platinum Industry Analysis, Insights and Forecast, 2019-2031
- 6.1. Market Analysis, Insights and Forecast - by Application
- 6.1.1. Exhaust Systems
- 6.1.2. Jewelry
- 6.1.3. Chemical Catalysts
- 6.1.4. Glass Production
- 6.1.5. Electronics
- 6.1.6. Other Applications
- 6.1. Market Analysis, Insights and Forecast - by Application
- 7. North America Platinum Industry Analysis, Insights and Forecast, 2019-2031
- 7.1. Market Analysis, Insights and Forecast - by Application
- 7.1.1. Exhaust Systems
- 7.1.2. Jewelry
- 7.1.3. Chemical Catalysts
- 7.1.4. Glass Production
- 7.1.5. Electronics
- 7.1.6. Other Applications
- 7.1. Market Analysis, Insights and Forecast - by Application
- 8. Europe Platinum Industry Analysis, Insights and Forecast, 2019-2031
- 8.1. Market Analysis, Insights and Forecast - by Application
- 8.1.1. Exhaust Systems
- 8.1.2. Jewelry
- 8.1.3. Chemical Catalysts
- 8.1.4. Glass Production
- 8.1.5. Electronics
- 8.1.6. Other Applications
- 8.1. Market Analysis, Insights and Forecast - by Application
- 9. Rest Of The World Platinum Industry Analysis, Insights and Forecast, 2019-2031
- 9.1. Market Analysis, Insights and Forecast - by Application
- 9.1.1. Exhaust Systems
- 9.1.2. Jewelry
- 9.1.3. Chemical Catalysts
- 9.1.4. Glass Production
- 9.1.5. Electronics
- 9.1.6. Other Applications
- 9.1. Market Analysis, Insights and Forecast - by Application
- 10. North America Platinum Industry Analysis, Insights and Forecast, 2019-2031
- 10.1. Market Analysis, Insights and Forecast - By Country/Sub-region
- 10.1.1 United States
- 10.1.2 Canada
- 10.1.3 Mexico
- 11. Europe Platinum Industry Analysis, Insights and Forecast, 2019-2031
- 11.1. Market Analysis, Insights and Forecast - By Country/Sub-region
- 11.1.1 Germany
- 11.1.2 France
- 11.1.3 Italy
- 11.1.4 United Kingdom
- 11.1.5 Netherlands
- 11.1.6 Rest of Europe
- 12. Asia Pacific Platinum Industry Analysis, Insights and Forecast, 2019-2031
- 12.1. Market Analysis, Insights and Forecast - By Country/Sub-region
- 12.1.1 China
- 12.1.2 Japan
- 12.1.3 India
- 12.1.4 South Korea
- 12.1.5 Taiwan
- 12.1.6 Australia
- 12.1.7 Rest of Asia-Pacific
- 13. South America Platinum Industry Analysis, Insights and Forecast, 2019-2031
- 13.1. Market Analysis, Insights and Forecast - By Country/Sub-region
- 13.1.1 Brazil
- 13.1.2 Argentina
- 13.1.3 Rest of South America
- 14. MEA Platinum Industry Analysis, Insights and Forecast, 2019-2031
- 14.1. Market Analysis, Insights and Forecast - By Country/Sub-region
- 14.1.1 Middle East
- 14.1.2 Africa
- 15. Competitive Analysis
- 15.1. Global Market Share Analysis 2024
- 15.2. Company Profiles
- 15.2.1 Heraeus Holding
- 15.2.1.1. Overview
- 15.2.1.2. Products
- 15.2.1.3. SWOT Analysis
- 15.2.1.4. Recent Developments
- 15.2.1.5. Financials (Based on Availability)
- 15.2.2 Chimet Spa
- 15.2.2.1. Overview
- 15.2.2.2. Products
- 15.2.2.3. SWOT Analysis
- 15.2.2.4. Recent Developments
- 15.2.2.5. Financials (Based on Availability)
- 15.2.3 Hindustan Platinum
- 15.2.3.1. Overview
- 15.2.3.2. Products
- 15.2.3.3. SWOT Analysis
- 15.2.3.4. Recent Developments
- 15.2.3.5. Financials (Based on Availability)
- 15.2.4 Heesung Pmtech
- 15.2.4.1. Overview
- 15.2.4.2. Products
- 15.2.4.3. SWOT Analysis
- 15.2.4.4. Recent Developments
- 15.2.4.5. Financials (Based on Availability)
- 15.2.5 Norilsk Nickel
- 15.2.5.1. Overview
- 15.2.5.2. Products
- 15.2.5.3. SWOT Analysis
- 15.2.5.4. Recent Developments
- 15.2.5.5. Financials (Based on Availability)
- 15.2.6 Impala Platinum Holdings Limited
- 15.2.6.1. Overview
- 15.2.6.2. Products
- 15.2.6.3. SWOT Analysis
- 15.2.6.4. Recent Developments
- 15.2.6.5. Financials (Based on Availability)
- 15.2.7 Northam Platinum Holdings Limited
- 15.2.7.1. Overview
- 15.2.7.2. Products
- 15.2.7.3. SWOT Analysis
- 15.2.7.4. Recent Developments
- 15.2.7.5. Financials (Based on Availability)
- 15.2.8 Nihon Material Co Ltd
- 15.2.8.1. Overview
- 15.2.8.2. Products
- 15.2.8.3. SWOT Analysis
- 15.2.8.4. Recent Developments
- 15.2.8.5. Financials (Based on Availability)
- 15.2.9 Johnson Matthey
- 15.2.9.1. Overview
- 15.2.9.2. Products
- 15.2.9.3. SWOT Analysis
- 15.2.9.4. Recent Developments
- 15.2.9.5. Financials (Based on Availability)
- 15.2.10 Sibanye-stillwater
- 15.2.10.1. Overview
- 15.2.10.2. Products
- 15.2.10.3. SWOT Analysis
- 15.2.10.4. Recent Developments
- 15.2.10.5. Financials (Based on Availability)
- 15.2.11 Anglo American Platinum Limited
- 15.2.11.1. Overview
- 15.2.11.2. Products
- 15.2.11.3. SWOT Analysis
- 15.2.11.4. Recent Developments
- 15.2.11.5. Financials (Based on Availability)
- 15.2.1 Heraeus Holding
List of Figures
- Figure 1: Global Platinum Industry Revenue Breakdown (Billion, %) by Region 2024 & 2032
- Figure 2: Global Platinum Industry Volume Breakdown (K Tons, %) by Region 2024 & 2032
- Figure 3: North America Platinum Industry Revenue (Billion), by Country 2024 & 2032
- Figure 4: North America Platinum Industry Volume (K Tons), by Country 2024 & 2032
- Figure 5: North America Platinum Industry Revenue Share (%), by Country 2024 & 2032
- Figure 6: North America Platinum Industry Volume Share (%), by Country 2024 & 2032
- Figure 7: Europe Platinum Industry Revenue (Billion), by Country 2024 & 2032
- Figure 8: Europe Platinum Industry Volume (K Tons), by Country 2024 & 2032
- Figure 9: Europe Platinum Industry Revenue Share (%), by Country 2024 & 2032
- Figure 10: Europe Platinum Industry Volume Share (%), by Country 2024 & 2032
- Figure 11: Asia Pacific Platinum Industry Revenue (Billion), by Country 2024 & 2032
- Figure 12: Asia Pacific Platinum Industry Volume (K Tons), by Country 2024 & 2032
- Figure 13: Asia Pacific Platinum Industry Revenue Share (%), by Country 2024 & 2032
- Figure 14: Asia Pacific Platinum Industry Volume Share (%), by Country 2024 & 2032
- Figure 15: South America Platinum Industry Revenue (Billion), by Country 2024 & 2032
- Figure 16: South America Platinum Industry Volume (K Tons), by Country 2024 & 2032
- Figure 17: South America Platinum Industry Revenue Share (%), by Country 2024 & 2032
- Figure 18: South America Platinum Industry Volume Share (%), by Country 2024 & 2032
- Figure 19: MEA Platinum Industry Revenue (Billion), by Country 2024 & 2032
- Figure 20: MEA Platinum Industry Volume (K Tons), by Country 2024 & 2032
- Figure 21: MEA Platinum Industry Revenue Share (%), by Country 2024 & 2032
- Figure 22: MEA Platinum Industry Volume Share (%), by Country 2024 & 2032
- Figure 23: Asia Pacific Platinum Industry Revenue (Billion), by Application 2024 & 2032
- Figure 24: Asia Pacific Platinum Industry Volume (K Tons), by Application 2024 & 2032
- Figure 25: Asia Pacific Platinum Industry Revenue Share (%), by Application 2024 & 2032
- Figure 26: Asia Pacific Platinum Industry Volume Share (%), by Application 2024 & 2032
- Figure 27: Asia Pacific Platinum Industry Revenue (Billion), by Country 2024 & 2032
- Figure 28: Asia Pacific Platinum Industry Volume (K Tons), by Country 2024 & 2032
- Figure 29: Asia Pacific Platinum Industry Revenue Share (%), by Country 2024 & 2032
- Figure 30: Asia Pacific Platinum Industry Volume Share (%), by Country 2024 & 2032
- Figure 31: North America Platinum Industry Revenue (Billion), by Application 2024 & 2032
- Figure 32: North America Platinum Industry Volume (K Tons), by Application 2024 & 2032
- Figure 33: North America Platinum Industry Revenue Share (%), by Application 2024 & 2032
- Figure 34: North America Platinum Industry Volume Share (%), by Application 2024 & 2032
- Figure 35: North America Platinum Industry Revenue (Billion), by Country 2024 & 2032
- Figure 36: North America Platinum Industry Volume (K Tons), by Country 2024 & 2032
- Figure 37: North America Platinum Industry Revenue Share (%), by Country 2024 & 2032
- Figure 38: North America Platinum Industry Volume Share (%), by Country 2024 & 2032
- Figure 39: Europe Platinum Industry Revenue (Billion), by Application 2024 & 2032
- Figure 40: Europe Platinum Industry Volume (K Tons), by Application 2024 & 2032
- Figure 41: Europe Platinum Industry Revenue Share (%), by Application 2024 & 2032
- Figure 42: Europe Platinum Industry Volume Share (%), by Application 2024 & 2032
- Figure 43: Europe Platinum Industry Revenue (Billion), by Country 2024 & 2032
- Figure 44: Europe Platinum Industry Volume (K Tons), by Country 2024 & 2032
- Figure 45: Europe Platinum Industry Revenue Share (%), by Country 2024 & 2032
- Figure 46: Europe Platinum Industry Volume Share (%), by Country 2024 & 2032
- Figure 47: Rest Of The World Platinum Industry Revenue (Billion), by Application 2024 & 2032
- Figure 48: Rest Of The World Platinum Industry Volume (K Tons), by Application 2024 & 2032
- Figure 49: Rest Of The World Platinum Industry Revenue Share (%), by Application 2024 & 2032
- Figure 50: Rest Of The World Platinum Industry Volume Share (%), by Application 2024 & 2032
- Figure 51: Rest Of The World Platinum Industry Revenue (Billion), by Country 2024 & 2032
- Figure 52: Rest Of The World Platinum Industry Volume (K Tons), by Country 2024 & 2032
- Figure 53: Rest Of The World Platinum Industry Revenue Share (%), by Country 2024 & 2032
- Figure 54: Rest Of The World Platinum Industry Volume Share (%), by Country 2024 & 2032
List of Tables
- Table 1: Global Platinum Industry Revenue Billion Forecast, by Region 2019 & 2032
- Table 2: Global Platinum Industry Volume K Tons Forecast, by Region 2019 & 2032
- Table 3: Global Platinum Industry Revenue Billion Forecast, by Application 2019 & 2032
- Table 4: Global Platinum Industry Volume K Tons Forecast, by Application 2019 & 2032
- Table 5: Global Platinum Industry Revenue Billion Forecast, by Region 2019 & 2032
- Table 6: Global Platinum Industry Volume K Tons Forecast, by Region 2019 & 2032
- Table 7: Global Platinum Industry Revenue Billion Forecast, by Country 2019 & 2032
- Table 8: Global Platinum Industry Volume K Tons Forecast, by Country 2019 & 2032
- Table 9: United States Platinum Industry Revenue (Billion) Forecast, by Application 2019 & 2032
- Table 10: United States Platinum Industry Volume (K Tons) Forecast, by Application 2019 & 2032
- Table 11: Canada Platinum Industry Revenue (Billion) Forecast, by Application 2019 & 2032
- Table 12: Canada Platinum Industry Volume (K Tons) Forecast, by Application 2019 & 2032
- Table 13: Mexico Platinum Industry Revenue (Billion) Forecast, by Application 2019 & 2032
- Table 14: Mexico Platinum Industry Volume (K Tons) Forecast, by Application 2019 & 2032
- Table 15: Global Platinum Industry Revenue Billion Forecast, by Country 2019 & 2032
- Table 16: Global Platinum Industry Volume K Tons Forecast, by Country 2019 & 2032
- Table 17: Germany Platinum Industry Revenue (Billion) Forecast, by Application 2019 & 2032
- Table 18: Germany Platinum Industry Volume (K Tons) Forecast, by Application 2019 & 2032
- Table 19: France Platinum Industry Revenue (Billion) Forecast, by Application 2019 & 2032
- Table 20: France Platinum Industry Volume (K Tons) Forecast, by Application 2019 & 2032
- Table 21: Italy Platinum Industry Revenue (Billion) Forecast, by Application 2019 & 2032
- Table 22: Italy Platinum Industry Volume (K Tons) Forecast, by Application 2019 & 2032
- Table 23: United Kingdom Platinum Industry Revenue (Billion) Forecast, by Application 2019 & 2032
- Table 24: United Kingdom Platinum Industry Volume (K Tons) Forecast, by Application 2019 & 2032
- Table 25: Netherlands Platinum Industry Revenue (Billion) Forecast, by Application 2019 & 2032
- Table 26: Netherlands Platinum Industry Volume (K Tons) Forecast, by Application 2019 & 2032
- Table 27: Rest of Europe Platinum Industry Revenue (Billion) Forecast, by Application 2019 & 2032
- Table 28: Rest of Europe Platinum Industry Volume (K Tons) Forecast, by Application 2019 & 2032
- Table 29: Global Platinum Industry Revenue Billion Forecast, by Country 2019 & 2032
- Table 30: Global Platinum Industry Volume K Tons Forecast, by Country 2019 & 2032
- Table 31: China Platinum Industry Revenue (Billion) Forecast, by Application 2019 & 2032
- Table 32: China Platinum Industry Volume (K Tons) Forecast, by Application 2019 & 2032
- Table 33: Japan Platinum Industry Revenue (Billion) Forecast, by Application 2019 & 2032
- Table 34: Japan Platinum Industry Volume (K Tons) Forecast, by Application 2019 & 2032
- Table 35: India Platinum Industry Revenue (Billion) Forecast, by Application 2019 & 2032
- Table 36: India Platinum Industry Volume (K Tons) Forecast, by Application 2019 & 2032
- Table 37: South Korea Platinum Industry Revenue (Billion) Forecast, by Application 2019 & 2032
- Table 38: South Korea Platinum Industry Volume (K Tons) Forecast, by Application 2019 & 2032
- Table 39: Taiwan Platinum Industry Revenue (Billion) Forecast, by Application 2019 & 2032
- Table 40: Taiwan Platinum Industry Volume (K Tons) Forecast, by Application 2019 & 2032
- Table 41: Australia Platinum Industry Revenue (Billion) Forecast, by Application 2019 & 2032
- Table 42: Australia Platinum Industry Volume (K Tons) Forecast, by Application 2019 & 2032
- Table 43: Rest of Asia-Pacific Platinum Industry Revenue (Billion) Forecast, by Application 2019 & 2032
- Table 44: Rest of Asia-Pacific Platinum Industry Volume (K Tons) Forecast, by Application 2019 & 2032
- Table 45: Global Platinum Industry Revenue Billion Forecast, by Country 2019 & 2032
- Table 46: Global Platinum Industry Volume K Tons Forecast, by Country 2019 & 2032
- Table 47: Brazil Platinum Industry Revenue (Billion) Forecast, by Application 2019 & 2032
- Table 48: Brazil Platinum Industry Volume (K Tons) Forecast, by Application 2019 & 2032
- Table 49: Argentina Platinum Industry Revenue (Billion) Forecast, by Application 2019 & 2032
- Table 50: Argentina Platinum Industry Volume (K Tons) Forecast, by Application 2019 & 2032
- Table 51: Rest of South America Platinum Industry Revenue (Billion) Forecast, by Application 2019 & 2032
- Table 52: Rest of South America Platinum Industry Volume (K Tons) Forecast, by Application 2019 & 2032
- Table 53: Global Platinum Industry Revenue Billion Forecast, by Country 2019 & 2032
- Table 54: Global Platinum Industry Volume K Tons Forecast, by Country 2019 & 2032
- Table 55: Middle East Platinum Industry Revenue (Billion) Forecast, by Application 2019 & 2032
- Table 56: Middle East Platinum Industry Volume (K Tons) Forecast, by Application 2019 & 2032
- Table 57: Africa Platinum Industry Revenue (Billion) Forecast, by Application 2019 & 2032
- Table 58: Africa Platinum Industry Volume (K Tons) Forecast, by Application 2019 & 2032
- Table 59: Global Platinum Industry Revenue Billion Forecast, by Application 2019 & 2032
- Table 60: Global Platinum Industry Volume K Tons Forecast, by Application 2019 & 2032
- Table 61: Global Platinum Industry Revenue Billion Forecast, by Country 2019 & 2032
- Table 62: Global Platinum Industry Volume K Tons Forecast, by Country 2019 & 2032
- Table 63: China Platinum Industry Revenue (Billion) Forecast, by Application 2019 & 2032
- Table 64: China Platinum Industry Volume (K Tons) Forecast, by Application 2019 & 2032
- Table 65: India Platinum Industry Revenue (Billion) Forecast, by Application 2019 & 2032
- Table 66: India Platinum Industry Volume (K Tons) Forecast, by Application 2019 & 2032
- Table 67: Japan Platinum Industry Revenue (Billion) Forecast, by Application 2019 & 2032
- Table 68: Japan Platinum Industry Volume (K Tons) Forecast, by Application 2019 & 2032
- Table 69: South Korea Platinum Industry Revenue (Billion) Forecast, by Application 2019 & 2032
- Table 70: South Korea Platinum Industry Volume (K Tons) Forecast, by Application 2019 & 2032
- Table 71: Rest of Asia Pacific Platinum Industry Revenue (Billion) Forecast, by Application 2019 & 2032
- Table 72: Rest of Asia Pacific Platinum Industry Volume (K Tons) Forecast, by Application 2019 & 2032
- Table 73: Global Platinum Industry Revenue Billion Forecast, by Application 2019 & 2032
- Table 74: Global Platinum Industry Volume K Tons Forecast, by Application 2019 & 2032
- Table 75: Global Platinum Industry Revenue Billion Forecast, by Country 2019 & 2032
- Table 76: Global Platinum Industry Volume K Tons Forecast, by Country 2019 & 2032
- Table 77: United States Platinum Industry Revenue (Billion) Forecast, by Application 2019 & 2032
- Table 78: United States Platinum Industry Volume (K Tons) Forecast, by Application 2019 & 2032
- Table 79: Canada Platinum Industry Revenue (Billion) Forecast, by Application 2019 & 2032
- Table 80: Canada Platinum Industry Volume (K Tons) Forecast, by Application 2019 & 2032
- Table 81: Mexico Platinum Industry Revenue (Billion) Forecast, by Application 2019 & 2032
- Table 82: Mexico Platinum Industry Volume (K Tons) Forecast, by Application 2019 & 2032
- Table 83: Global Platinum Industry Revenue Billion Forecast, by Application 2019 & 2032
- Table 84: Global Platinum Industry Volume K Tons Forecast, by Application 2019 & 2032
- Table 85: Global Platinum Industry Revenue Billion Forecast, by Country 2019 & 2032
- Table 86: Global Platinum Industry Volume K Tons Forecast, by Country 2019 & 2032
- Table 87: Germany Platinum Industry Revenue (Billion) Forecast, by Application 2019 & 2032
- Table 88: Germany Platinum Industry Volume (K Tons) Forecast, by Application 2019 & 2032
- Table 89: United Kingdom Platinum Industry Revenue (Billion) Forecast, by Application 2019 & 2032
- Table 90: United Kingdom Platinum Industry Volume (K Tons) Forecast, by Application 2019 & 2032
- Table 91: Italy Platinum Industry Revenue (Billion) Forecast, by Application 2019 & 2032
- Table 92: Italy Platinum Industry Volume (K Tons) Forecast, by Application 2019 & 2032
- Table 93: France Platinum Industry Revenue (Billion) Forecast, by Application 2019 & 2032
- Table 94: France Platinum Industry Volume (K Tons) Forecast, by Application 2019 & 2032
- Table 95: Rest of Europe Platinum Industry Revenue (Billion) Forecast, by Application 2019 & 2032
- Table 96: Rest of Europe Platinum Industry Volume (K Tons) Forecast, by Application 2019 & 2032
- Table 97: Global Platinum Industry Revenue Billion Forecast, by Application 2019 & 2032
- Table 98: Global Platinum Industry Volume K Tons Forecast, by Application 2019 & 2032
- Table 99: Global Platinum Industry Revenue Billion Forecast, by Country 2019 & 2032
- Table 100: Global Platinum Industry Volume K Tons Forecast, by Country 2019 & 2032
- Table 101: South America Platinum Industry Revenue (Billion) Forecast, by Application 2019 & 2032
- Table 102: South America Platinum Industry Volume (K Tons) Forecast, by Application 2019 & 2032
- Table 103: Middle East and Africa Platinum Industry Revenue (Billion) Forecast, by Application 2019 & 2032
- Table 104: Middle East and Africa Platinum Industry Volume (K Tons) Forecast, by Application 2019 & 2032
Frequently Asked Questions
1. What is the projected Compound Annual Growth Rate (CAGR) of the Platinum Industry?
The projected CAGR is approximately 5.2%.
2. Which companies are prominent players in the Platinum Industry?
Key companies in the market include Heraeus Holding, Chimet Spa, Hindustan Platinum, Heesung Pmtech, Norilsk Nickel, Impala Platinum Holdings Limited, Northam Platinum Holdings Limited, Nihon Material Co Ltd, Johnson Matthey, Sibanye-stillwater, Anglo American Platinum Limited.
3. What are the main segments of the Platinum Industry?
The market segments include Application.
4. Can you provide details about the market size?
The market size is estimated to be USD 7.9 Billion as of 2022.
5. What are some drivers contributing to market growth?
Increasing Usage in the Industrial Applications; Growing Demand for Applications in the Automotive Industry.
6. What are the notable trends driving market growth?
Growing Demand for Exhaust Systems in Automobile Industry.
7. Are there any restraints impacting market growth?
High Product Prices.
8. Can you provide examples of recent developments in the market?
April 2022: Impala Platinum Holdings Limited plans to acquire a 100% stake in the South Africa-based platinum manufacturer Royal Bafokeng Platinum. It already owns 35.3% of the shares of Royal Bafokeng Platinum. The 100% acquisition will pave the way for creating one of the biggest platinum metal miners worldwide. It will also help Impala consolidate its market position.
9. What pricing options are available for accessing the report?
Pricing options include single-user, multi-user, and enterprise licenses priced at USD 4750, USD 5250, and USD 8750 respectively.
10. Is the market size provided in terms of value or volume?
The market size is provided in terms of value, measured in Billion and volume, measured in K Tons.
11. Are there any specific market keywords associated with the report?
Yes, the market keyword associated with the report is "Platinum Industry," which aids in identifying and referencing the specific market segment covered.
12. How do I determine which pricing option suits my needs best?
The pricing options vary based on user requirements and access needs. Individual users may opt for single-user licenses, while businesses requiring broader access may choose multi-user or enterprise licenses for cost-effective access to the report.
13. Are there any additional resources or data provided in the Platinum Industry report?
While the report offers comprehensive insights, it's advisable to review the specific contents or supplementary materials provided to ascertain if additional resources or data are available.
14. How can I stay updated on further developments or reports in the Platinum Industry?
To stay informed about further developments, trends, and reports in the Platinum Industry, consider subscribing to industry newsletters, following relevant companies and organizations, or regularly checking reputable industry news sources and publications.
Methodology
Step 1 - Identification of Relevant Samples Size from Population Database


Step 2 - Approaches for Defining Global Market Size (Value, Volume* & Price*)

Note*: In applicable scenarios
Step 3 - Data Sources
Primary Research
- Web Analytics
- Survey Reports
- Research Institute
- Latest Research Reports
- Opinion Leaders
Secondary Research
- Annual Reports
- White Paper
- Latest Press Release
- Industry Association
- Paid Database
- Investor Presentations

Step 4 - Data Triangulation
Involves using different sources of information in order to increase the validity of a study
These sources are likely to be stakeholders in a program - participants, other researchers, program staff, other community members, and so on.
Then we put all data in single framework & apply various statistical tools to find out the dynamic on the market.
During the analysis stage, feedback from the stakeholder groups would be compared to determine areas of agreement as well as areas of divergence
