

Key Insights
The global phthalic anhydride derivatives market is experiencing robust growth, driven by the increasing demand from key end-use industries such as construction, automotive, and electrical and electronics. The market's Compound Annual Growth Rate (CAGR) exceeding 4.40% from 2019 to 2024 indicates a sustained upward trajectory. This growth is fueled by several factors, including the rising construction activities globally, particularly in developing economies, which significantly boosts the demand for unsaturated polyester resins and alkyd resins – major derivatives of phthalic anhydride. Furthermore, the burgeoning automotive industry's need for lightweight and durable materials is driving demand for plasticizers derived from phthalic anhydride. The market segmentation reveals that unsaturated polyester resins hold the largest market share among derivatives due to their extensive applications in fiberglass reinforced plastics (FRP) commonly used in construction and transportation. Technological advancements leading to improved performance characteristics and eco-friendly alternatives are also shaping the market landscape.
However, the market faces challenges, primarily related to the volatility of raw material prices and environmental regulations concerning the production and disposal of phthalic anhydride and its derivatives. Stringent emission norms and the increasing adoption of sustainable materials are potential restraints. Nevertheless, innovation in production processes, focusing on energy efficiency and reduced environmental impact, is expected to mitigate some of these restraints. The regional market is diversified, with North America and Asia Pacific currently leading in terms of consumption, driven by strong industrial bases and significant infrastructure development. The competitive landscape is characterized by a mix of large multinational chemical companies and specialized regional players, indicating a dynamic and evolving market structure. Growth projections for the forecast period (2025-2033) suggest continued expansion, albeit at a potentially moderated pace compared to the historical period due to the market nearing maturity in certain segments. Specific growth rates for individual segments and regions will depend on various macroeconomic factors and technological advancements.
Phthalic Anhydride Derivatives Market: A Comprehensive Industry Report (2019-2033)
This insightful report provides a detailed analysis of the global Phthalic Anhydride Derivatives market, offering a comprehensive overview of its current state, future trajectory, and key players. Spanning the period from 2019 to 2033, with 2025 as the base and estimated year, this study unveils crucial market dynamics, trends, and growth opportunities for stakeholders. The report meticulously examines various segments including Unsaturated Polyester Resins, Alkyd Resins, Plasticizers, and other derivatives, across diverse end-user industries like Construction, Automotive, Electrical & Electronics, and Aerospace. Expect in-depth analysis, robust data, and actionable insights to navigate this dynamic market effectively. The market size is projected to reach xx Million by 2033.
Phthalic Anhydride Derivatives Industry Market Composition & Trends
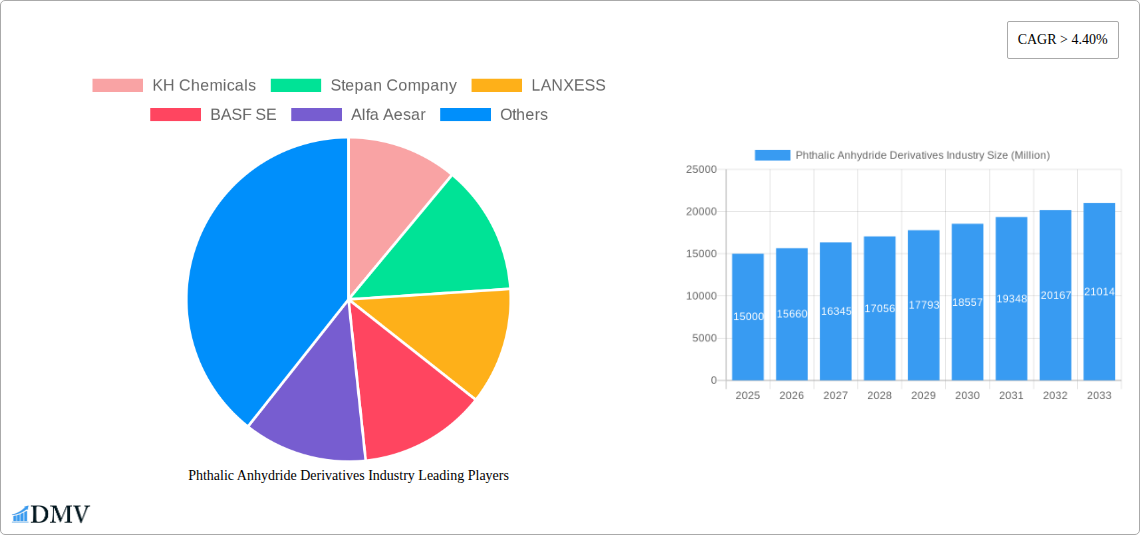
This section delves into the competitive landscape of the Phthalic Anhydride Derivatives market, examining market concentration, innovation drivers, regulatory frameworks, substitute products, end-user profiles, and mergers & acquisitions (M&A) activities. We analyze the market share distribution among key players, including BASF SE, LANXESS, and Stepan Company, revealing a moderately consolidated market with significant opportunities for both established players and emerging entrants. M&A activities are assessed based on deal values and their impact on market dynamics. The report further examines the regulatory environment's influence on market growth and identifies key substitute products impacting market competition. Innovation catalysts, such as advancements in resin formulations and sustainable manufacturing processes, are analyzed to understand their role in shaping future market trends. End-user profiles highlight the differing demands and preferences across various sectors, contributing to the market's segmented nature.
- Market Concentration: Moderately Consolidated (xx% market share held by top 5 players in 2025)
- M&A Activity: xx Million in deal value recorded between 2019-2024, with a predicted xx Million for 2025-2033.
- Key Innovation Catalysts: Sustainable production methods, advanced resin formulations.
- Regulatory Landscape: Analysis of key environmental regulations and their impact.
- Substitute Products: Assessment of competitive threats from alternative materials.
Phthalic Anhydride Derivatives Industry Evolution
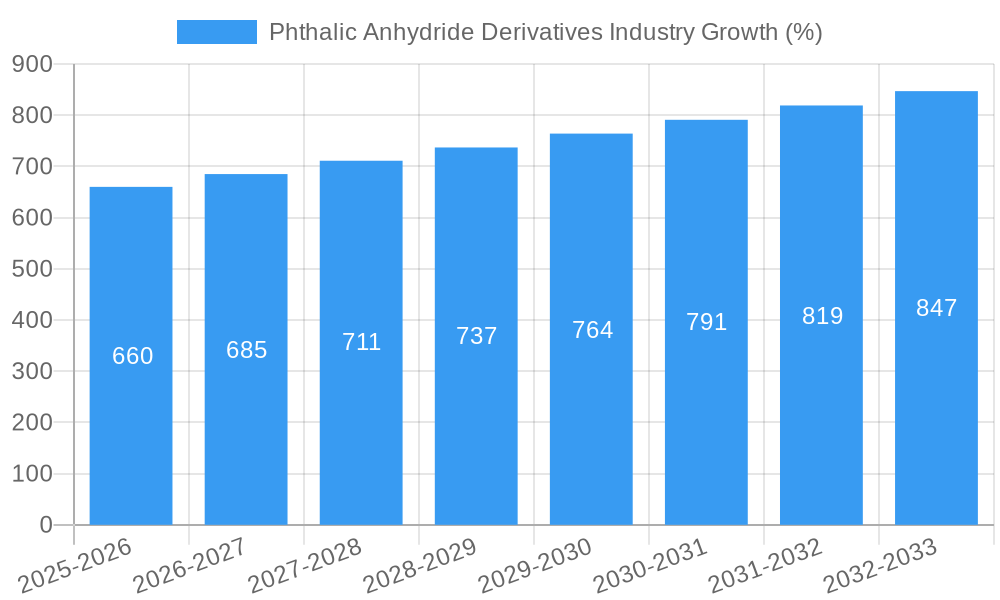
This section provides a historical and forward-looking perspective on the Phthalic Anhydride Derivatives market, charting its growth trajectory from 2019 to 2033. We analyze the factors driving market expansion, including technological advancements in resin production, evolving consumer demands for high-performance materials, and the expanding application of phthalic anhydride derivatives across diverse sectors. The report presents detailed growth rate projections for each segment, along with adoption metrics for innovative products and technologies. Technological advancements leading to enhanced product properties, such as improved durability and UV resistance, are examined for their contribution to market growth. The influence of shifting consumer demands, particularly in sustainable and eco-friendly products, is thoroughly assessed.
- Historical Growth Rate (2019-2024): xx% CAGR
- Projected Growth Rate (2025-2033): xx% CAGR
- Key Technological Advancements: Bio-based phthalic anhydride, improved resin formulations.
- Shifting Consumer Demands: Increased focus on sustainability and eco-friendly products.
Leading Regions, Countries, or Segments in Phthalic Anhydride Derivatives Industry
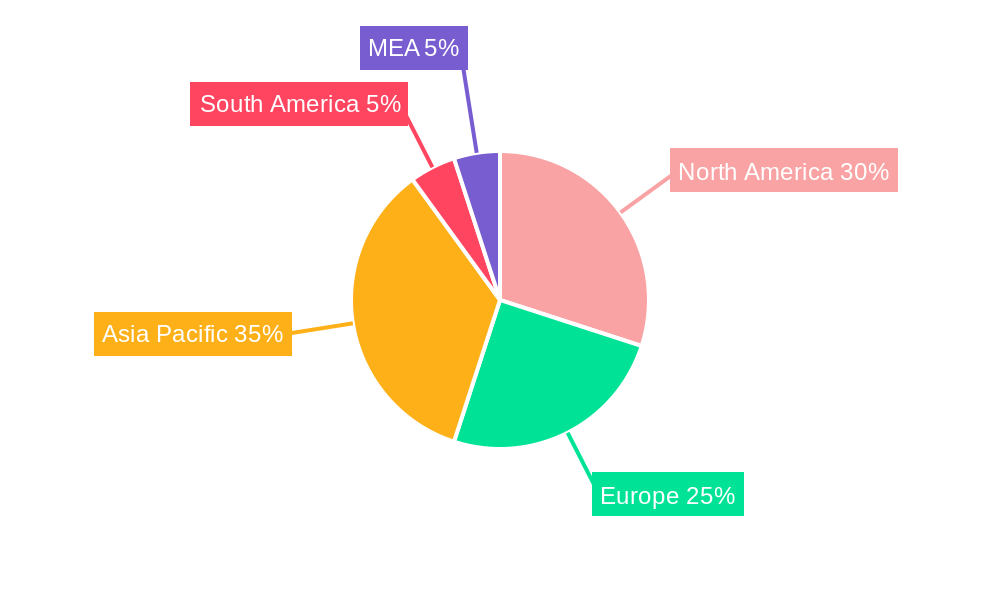
This section identifies the leading regions, countries, and segments within the Phthalic Anhydride Derivatives market. Analysis focuses on market share, growth drivers, and dominance factors. We highlight the key factors contributing to the dominance of specific regions or segments, including investment trends, government policies, and infrastructure development. The analysis covers all major derivatives (Unsaturated Polyester Resins, Alkyd Resin, Plasticizer, Other) and end-user industries (Construction, Automotive, Electrical & Electronics, Aerospace, Others).
- Dominant Region: Asia-Pacific (Driven by robust construction and automotive sectors)
- Dominant Derivative Segment: Unsaturated Polyester Resins (due to its extensive use in construction and transportation)
- Dominant End-User Industry: Construction (owing to high demand for durable and cost-effective materials).
Key Drivers (by Segment & Region):
- Asia-Pacific (Construction): Rapid infrastructure development, rising urbanization.
- North America (Automotive): Growth in light-weighting vehicle designs.
- Europe (Electrical & Electronics): Demand for high-performance insulation materials.
Phthalic Anhydride Derivatives Industry Product Innovations
Recent innovations in Phthalic Anhydride Derivatives have focused on enhancing product performance, sustainability, and cost-effectiveness. New resin formulations offer improved durability, UV resistance, and thermal stability, catering to the growing demand for high-performance materials in various applications. The development of bio-based phthalic anhydride alternatives is also gaining traction, driven by growing environmental concerns and sustainability initiatives. These innovations are expected to significantly impact market dynamics, leading to improved product quality and a wider range of applications.
Propelling Factors for Phthalic Anhydride Derivatives Industry Growth
The growth of the Phthalic Anhydride Derivatives market is propelled by several factors. Technological advancements in resin production, coupled with the rising demand for high-performance materials in diverse industries, are key drivers. Economic growth, particularly in developing economies, fuels the demand for construction materials and consumer goods, further stimulating market growth. Government regulations and initiatives promoting sustainable development also contribute to the adoption of eco-friendly phthalic anhydride derivatives.
Obstacles in the Phthalic Anhydride Derivatives Industry Market
The Phthalic Anhydride Derivatives market faces challenges such as stringent environmental regulations that increase production costs and complicate compliance. Supply chain disruptions caused by geopolitical instability and raw material price volatility pose significant risks to production and profitability. Intense competition from substitute products and the emergence of new technologies also present obstacles to market expansion.
Future Opportunities in Phthalic Anhydride Derivatives Industry
Future opportunities lie in developing bio-based phthalic anhydride alternatives and exploring new applications in emerging markets. The increasing demand for sustainable and eco-friendly products presents a significant opportunity for manufacturers to innovate and capture market share. Expansion into niche applications, such as advanced composites and specialized coatings, also holds significant growth potential.
Major Players in the Phthalic Anhydride Derivatives Industry Ecosystem
- BASF SE
- LANXESS
- Stepan Company
- KH Chemicals
- Alfa Aesar
- PENPET Petrochemical Trading GmbH
- JFE Chemical Corporation
- I G Petrochemicals Ltd
- Polynt SpA
- Thirumalai Chemicals Ltd
- Tokyo Chemical Industry
- S I Group Inc
- Koppers Inc
- Perstorp
- The Chemical Company
Key Developments in Phthalic Anhydride Derivatives Industry Industry
- 2022 Q3: BASF SE announces investment in a new phthalic anhydride production facility.
- 2023 Q1: LANXESS launches a new line of sustainable alkyd resins.
- 2024 Q2: Merger between two smaller players, resulting in increased market consolidation. (Further details on specific dates and companies will be available in the full report).
Strategic Phthalic Anhydride Derivatives Industry Market Forecast
The Phthalic Anhydride Derivatives market is poised for continued growth, driven by technological innovations, expanding applications, and a rising global demand for high-performance materials. The increasing focus on sustainability presents significant opportunities for the adoption of bio-based alternatives and eco-friendly production processes. Strategic investments in research and development, coupled with effective market penetration strategies, are crucial for companies seeking to capitalize on the market's growth potential.
Phthalic Anhydride Derivatives Industry Segmentation
-
1. Derivatives
- 1.1. Unsaturated Polyester Resins
- 1.2. Alkyd Resin
- 1.3. Plasticizer
- 1.4. Other
-
2. End-user Industry
- 2.1. Construction
- 2.2. Automotive
- 2.3. Electrical and Electronics
- 2.4. Aerospace
- 2.5. Others
Phthalic Anhydride Derivatives Industry Segmentation By Geography
-
1. Asia Pacific
- 1.1. China
- 1.2. India
- 1.3. Japan
- 1.4. South Korea
- 1.5. Rest of Asia Pacific
-
2. North America
- 2.1. United States
- 2.2. Canada
- 2.3. Mexico
-
3. Europe
- 3.1. Germany
- 3.2. United Kingdom
- 3.3. France
- 3.4. Italy
- 3.5. Rest of Europe
-
4. South America
- 4.1. Brazil
- 4.2. Argentina
- 4.3. Rest of South America
-
5. Middle East and Africa
- 5.1. Saudi Arabia
- 5.2. South Africa
- 5.3. Rest of Middle East and Africa
Phthalic Anhydride Derivatives Industry REPORT HIGHLIGHTS
| Aspects | Details |
|---|---|
| Study Period | 2019-2033 |
| Base Year | 2024 |
| Estimated Year | 2025 |
| Forecast Period | 2025-2033 |
| Historical Period | 2019-2024 |
| Growth Rate | CAGR of > 4.40% from 2019-2033 |
| Segmentation |
|
Table of Contents
- 1. Introduction
- 1.1. Research Scope
- 1.2. Market Segmentation
- 1.3. Research Methodology
- 1.4. Definitions and Assumptions
- 2. Executive Summary
- 2.1. Introduction
- 3. Market Dynamics
- 3.1. Introduction
- 3.2. Market Drivers
- 3.2.1. ; Increasing Consumption of Plastics in Construction Sector; Other Drivers
- 3.3. Market Restrains
- 3.3.1. ; Toxicity related to Phthalic Anhydride; Unfavorable Conditions Arising Due to COVID-19 Outbreak
- 3.4. Market Trends
- 3.4.1. Construction Sector to Dominate the Market
- 4. Market Factor Analysis
- 4.1. Porters Five Forces
- 4.2. Supply/Value Chain
- 4.3. PESTEL analysis
- 4.4. Market Entropy
- 4.5. Patent/Trademark Analysis
- 5. Global Phthalic Anhydride Derivatives Industry Analysis, Insights and Forecast, 2019-2031
- 5.1. Market Analysis, Insights and Forecast - by Derivatives
- 5.1.1. Unsaturated Polyester Resins
- 5.1.2. Alkyd Resin
- 5.1.3. Plasticizer
- 5.1.4. Other
- 5.2. Market Analysis, Insights and Forecast - by End-user Industry
- 5.2.1. Construction
- 5.2.2. Automotive
- 5.2.3. Electrical and Electronics
- 5.2.4. Aerospace
- 5.2.5. Others
- 5.3. Market Analysis, Insights and Forecast - by Region
- 5.3.1. Asia Pacific
- 5.3.2. North America
- 5.3.3. Europe
- 5.3.4. South America
- 5.3.5. Middle East and Africa
- 5.1. Market Analysis, Insights and Forecast - by Derivatives
- 6. Asia Pacific Phthalic Anhydride Derivatives Industry Analysis, Insights and Forecast, 2019-2031
- 6.1. Market Analysis, Insights and Forecast - by Derivatives
- 6.1.1. Unsaturated Polyester Resins
- 6.1.2. Alkyd Resin
- 6.1.3. Plasticizer
- 6.1.4. Other
- 6.2. Market Analysis, Insights and Forecast - by End-user Industry
- 6.2.1. Construction
- 6.2.2. Automotive
- 6.2.3. Electrical and Electronics
- 6.2.4. Aerospace
- 6.2.5. Others
- 6.1. Market Analysis, Insights and Forecast - by Derivatives
- 7. North America Phthalic Anhydride Derivatives Industry Analysis, Insights and Forecast, 2019-2031
- 7.1. Market Analysis, Insights and Forecast - by Derivatives
- 7.1.1. Unsaturated Polyester Resins
- 7.1.2. Alkyd Resin
- 7.1.3. Plasticizer
- 7.1.4. Other
- 7.2. Market Analysis, Insights and Forecast - by End-user Industry
- 7.2.1. Construction
- 7.2.2. Automotive
- 7.2.3. Electrical and Electronics
- 7.2.4. Aerospace
- 7.2.5. Others
- 7.1. Market Analysis, Insights and Forecast - by Derivatives
- 8. Europe Phthalic Anhydride Derivatives Industry Analysis, Insights and Forecast, 2019-2031
- 8.1. Market Analysis, Insights and Forecast - by Derivatives
- 8.1.1. Unsaturated Polyester Resins
- 8.1.2. Alkyd Resin
- 8.1.3. Plasticizer
- 8.1.4. Other
- 8.2. Market Analysis, Insights and Forecast - by End-user Industry
- 8.2.1. Construction
- 8.2.2. Automotive
- 8.2.3. Electrical and Electronics
- 8.2.4. Aerospace
- 8.2.5. Others
- 8.1. Market Analysis, Insights and Forecast - by Derivatives
- 9. South America Phthalic Anhydride Derivatives Industry Analysis, Insights and Forecast, 2019-2031
- 9.1. Market Analysis, Insights and Forecast - by Derivatives
- 9.1.1. Unsaturated Polyester Resins
- 9.1.2. Alkyd Resin
- 9.1.3. Plasticizer
- 9.1.4. Other
- 9.2. Market Analysis, Insights and Forecast - by End-user Industry
- 9.2.1. Construction
- 9.2.2. Automotive
- 9.2.3. Electrical and Electronics
- 9.2.4. Aerospace
- 9.2.5. Others
- 9.1. Market Analysis, Insights and Forecast - by Derivatives
- 10. Middle East and Africa Phthalic Anhydride Derivatives Industry Analysis, Insights and Forecast, 2019-2031
- 10.1. Market Analysis, Insights and Forecast - by Derivatives
- 10.1.1. Unsaturated Polyester Resins
- 10.1.2. Alkyd Resin
- 10.1.3. Plasticizer
- 10.1.4. Other
- 10.2. Market Analysis, Insights and Forecast - by End-user Industry
- 10.2.1. Construction
- 10.2.2. Automotive
- 10.2.3. Electrical and Electronics
- 10.2.4. Aerospace
- 10.2.5. Others
- 10.1. Market Analysis, Insights and Forecast - by Derivatives
- 11. North America Phthalic Anhydride Derivatives Industry Analysis, Insights and Forecast, 2019-2031
- 11.1. Market Analysis, Insights and Forecast - By Country/Sub-region
- 11.1.1 United States
- 11.1.2 Canada
- 11.1.3 Mexico
- 12. Europe Phthalic Anhydride Derivatives Industry Analysis, Insights and Forecast, 2019-2031
- 12.1. Market Analysis, Insights and Forecast - By Country/Sub-region
- 12.1.1 Germany
- 12.1.2 France
- 12.1.3 Italy
- 12.1.4 United Kingdom
- 12.1.5 Netherlands
- 12.1.6 Rest of Europe
- 13. Asia Pacific Phthalic Anhydride Derivatives Industry Analysis, Insights and Forecast, 2019-2031
- 13.1. Market Analysis, Insights and Forecast - By Country/Sub-region
- 13.1.1 China
- 13.1.2 Japan
- 13.1.3 India
- 13.1.4 South Korea
- 13.1.5 Taiwan
- 13.1.6 Australia
- 13.1.7 Rest of Asia-Pacific
- 14. South America Phthalic Anhydride Derivatives Industry Analysis, Insights and Forecast, 2019-2031
- 14.1. Market Analysis, Insights and Forecast - By Country/Sub-region
- 14.1.1 Brazil
- 14.1.2 Argentina
- 14.1.3 Rest of South America
- 15. MEA Phthalic Anhydride Derivatives Industry Analysis, Insights and Forecast, 2019-2031
- 15.1. Market Analysis, Insights and Forecast - By Country/Sub-region
- 15.1.1 Middle East
- 15.1.2 Africa
- 16. Competitive Analysis
- 16.1. Global Market Share Analysis 2024
- 16.2. Company Profiles
- 16.2.1 KH Chemicals
- 16.2.1.1. Overview
- 16.2.1.2. Products
- 16.2.1.3. SWOT Analysis
- 16.2.1.4. Recent Developments
- 16.2.1.5. Financials (Based on Availability)
- 16.2.2 Stepan Company
- 16.2.2.1. Overview
- 16.2.2.2. Products
- 16.2.2.3. SWOT Analysis
- 16.2.2.4. Recent Developments
- 16.2.2.5. Financials (Based on Availability)
- 16.2.3 LANXESS
- 16.2.3.1. Overview
- 16.2.3.2. Products
- 16.2.3.3. SWOT Analysis
- 16.2.3.4. Recent Developments
- 16.2.3.5. Financials (Based on Availability)
- 16.2.4 BASF SE
- 16.2.4.1. Overview
- 16.2.4.2. Products
- 16.2.4.3. SWOT Analysis
- 16.2.4.4. Recent Developments
- 16.2.4.5. Financials (Based on Availability)
- 16.2.5 Alfa Aesar
- 16.2.5.1. Overview
- 16.2.5.2. Products
- 16.2.5.3. SWOT Analysis
- 16.2.5.4. Recent Developments
- 16.2.5.5. Financials (Based on Availability)
- 16.2.6 PENPET Petrochemical Trading GmbH
- 16.2.6.1. Overview
- 16.2.6.2. Products
- 16.2.6.3. SWOT Analysis
- 16.2.6.4. Recent Developments
- 16.2.6.5. Financials (Based on Availability)
- 16.2.7 JFE Chemical Corporation
- 16.2.7.1. Overview
- 16.2.7.2. Products
- 16.2.7.3. SWOT Analysis
- 16.2.7.4. Recent Developments
- 16.2.7.5. Financials (Based on Availability)
- 16.2.8 I G Petrochemicals Ltd
- 16.2.8.1. Overview
- 16.2.8.2. Products
- 16.2.8.3. SWOT Analysis
- 16.2.8.4. Recent Developments
- 16.2.8.5. Financials (Based on Availability)
- 16.2.9 Polynt SpA
- 16.2.9.1. Overview
- 16.2.9.2. Products
- 16.2.9.3. SWOT Analysis
- 16.2.9.4. Recent Developments
- 16.2.9.5. Financials (Based on Availability)
- 16.2.10 Thirumalai Chemicals Ltd
- 16.2.10.1. Overview
- 16.2.10.2. Products
- 16.2.10.3. SWOT Analysis
- 16.2.10.4. Recent Developments
- 16.2.10.5. Financials (Based on Availability)
- 16.2.11 Tokyo Chemical Industry
- 16.2.11.1. Overview
- 16.2.11.2. Products
- 16.2.11.3. SWOT Analysis
- 16.2.11.4. Recent Developments
- 16.2.11.5. Financials (Based on Availability)
- 16.2.12 S I Group Inc
- 16.2.12.1. Overview
- 16.2.12.2. Products
- 16.2.12.3. SWOT Analysis
- 16.2.12.4. Recent Developments
- 16.2.12.5. Financials (Based on Availability)
- 16.2.13 Koppers Inc
- 16.2.13.1. Overview
- 16.2.13.2. Products
- 16.2.13.3. SWOT Analysis
- 16.2.13.4. Recent Developments
- 16.2.13.5. Financials (Based on Availability)
- 16.2.14 Perstorp
- 16.2.14.1. Overview
- 16.2.14.2. Products
- 16.2.14.3. SWOT Analysis
- 16.2.14.4. Recent Developments
- 16.2.14.5. Financials (Based on Availability)
- 16.2.15 The Chemical Company
- 16.2.15.1. Overview
- 16.2.15.2. Products
- 16.2.15.3. SWOT Analysis
- 16.2.15.4. Recent Developments
- 16.2.15.5. Financials (Based on Availability)
- 16.2.1 KH Chemicals
List of Figures
- Figure 1: Global Phthalic Anhydride Derivatives Industry Revenue Breakdown (Million, %) by Region 2024 & 2032
- Figure 2: Global Phthalic Anhydride Derivatives Industry Volume Breakdown (K Tons, %) by Region 2024 & 2032
- Figure 3: North America Phthalic Anhydride Derivatives Industry Revenue (Million), by Country 2024 & 2032
- Figure 4: North America Phthalic Anhydride Derivatives Industry Volume (K Tons), by Country 2024 & 2032
- Figure 5: North America Phthalic Anhydride Derivatives Industry Revenue Share (%), by Country 2024 & 2032
- Figure 6: North America Phthalic Anhydride Derivatives Industry Volume Share (%), by Country 2024 & 2032
- Figure 7: Europe Phthalic Anhydride Derivatives Industry Revenue (Million), by Country 2024 & 2032
- Figure 8: Europe Phthalic Anhydride Derivatives Industry Volume (K Tons), by Country 2024 & 2032
- Figure 9: Europe Phthalic Anhydride Derivatives Industry Revenue Share (%), by Country 2024 & 2032
- Figure 10: Europe Phthalic Anhydride Derivatives Industry Volume Share (%), by Country 2024 & 2032
- Figure 11: Asia Pacific Phthalic Anhydride Derivatives Industry Revenue (Million), by Country 2024 & 2032
- Figure 12: Asia Pacific Phthalic Anhydride Derivatives Industry Volume (K Tons), by Country 2024 & 2032
- Figure 13: Asia Pacific Phthalic Anhydride Derivatives Industry Revenue Share (%), by Country 2024 & 2032
- Figure 14: Asia Pacific Phthalic Anhydride Derivatives Industry Volume Share (%), by Country 2024 & 2032
- Figure 15: South America Phthalic Anhydride Derivatives Industry Revenue (Million), by Country 2024 & 2032
- Figure 16: South America Phthalic Anhydride Derivatives Industry Volume (K Tons), by Country 2024 & 2032
- Figure 17: South America Phthalic Anhydride Derivatives Industry Revenue Share (%), by Country 2024 & 2032
- Figure 18: South America Phthalic Anhydride Derivatives Industry Volume Share (%), by Country 2024 & 2032
- Figure 19: MEA Phthalic Anhydride Derivatives Industry Revenue (Million), by Country 2024 & 2032
- Figure 20: MEA Phthalic Anhydride Derivatives Industry Volume (K Tons), by Country 2024 & 2032
- Figure 21: MEA Phthalic Anhydride Derivatives Industry Revenue Share (%), by Country 2024 & 2032
- Figure 22: MEA Phthalic Anhydride Derivatives Industry Volume Share (%), by Country 2024 & 2032
- Figure 23: Asia Pacific Phthalic Anhydride Derivatives Industry Revenue (Million), by Derivatives 2024 & 2032
- Figure 24: Asia Pacific Phthalic Anhydride Derivatives Industry Volume (K Tons), by Derivatives 2024 & 2032
- Figure 25: Asia Pacific Phthalic Anhydride Derivatives Industry Revenue Share (%), by Derivatives 2024 & 2032
- Figure 26: Asia Pacific Phthalic Anhydride Derivatives Industry Volume Share (%), by Derivatives 2024 & 2032
- Figure 27: Asia Pacific Phthalic Anhydride Derivatives Industry Revenue (Million), by End-user Industry 2024 & 2032
- Figure 28: Asia Pacific Phthalic Anhydride Derivatives Industry Volume (K Tons), by End-user Industry 2024 & 2032
- Figure 29: Asia Pacific Phthalic Anhydride Derivatives Industry Revenue Share (%), by End-user Industry 2024 & 2032
- Figure 30: Asia Pacific Phthalic Anhydride Derivatives Industry Volume Share (%), by End-user Industry 2024 & 2032
- Figure 31: Asia Pacific Phthalic Anhydride Derivatives Industry Revenue (Million), by Country 2024 & 2032
- Figure 32: Asia Pacific Phthalic Anhydride Derivatives Industry Volume (K Tons), by Country 2024 & 2032
- Figure 33: Asia Pacific Phthalic Anhydride Derivatives Industry Revenue Share (%), by Country 2024 & 2032
- Figure 34: Asia Pacific Phthalic Anhydride Derivatives Industry Volume Share (%), by Country 2024 & 2032
- Figure 35: North America Phthalic Anhydride Derivatives Industry Revenue (Million), by Derivatives 2024 & 2032
- Figure 36: North America Phthalic Anhydride Derivatives Industry Volume (K Tons), by Derivatives 2024 & 2032
- Figure 37: North America Phthalic Anhydride Derivatives Industry Revenue Share (%), by Derivatives 2024 & 2032
- Figure 38: North America Phthalic Anhydride Derivatives Industry Volume Share (%), by Derivatives 2024 & 2032
- Figure 39: North America Phthalic Anhydride Derivatives Industry Revenue (Million), by End-user Industry 2024 & 2032
- Figure 40: North America Phthalic Anhydride Derivatives Industry Volume (K Tons), by End-user Industry 2024 & 2032
- Figure 41: North America Phthalic Anhydride Derivatives Industry Revenue Share (%), by End-user Industry 2024 & 2032
- Figure 42: North America Phthalic Anhydride Derivatives Industry Volume Share (%), by End-user Industry 2024 & 2032
- Figure 43: North America Phthalic Anhydride Derivatives Industry Revenue (Million), by Country 2024 & 2032
- Figure 44: North America Phthalic Anhydride Derivatives Industry Volume (K Tons), by Country 2024 & 2032
- Figure 45: North America Phthalic Anhydride Derivatives Industry Revenue Share (%), by Country 2024 & 2032
- Figure 46: North America Phthalic Anhydride Derivatives Industry Volume Share (%), by Country 2024 & 2032
- Figure 47: Europe Phthalic Anhydride Derivatives Industry Revenue (Million), by Derivatives 2024 & 2032
- Figure 48: Europe Phthalic Anhydride Derivatives Industry Volume (K Tons), by Derivatives 2024 & 2032
- Figure 49: Europe Phthalic Anhydride Derivatives Industry Revenue Share (%), by Derivatives 2024 & 2032
- Figure 50: Europe Phthalic Anhydride Derivatives Industry Volume Share (%), by Derivatives 2024 & 2032
- Figure 51: Europe Phthalic Anhydride Derivatives Industry Revenue (Million), by End-user Industry 2024 & 2032
- Figure 52: Europe Phthalic Anhydride Derivatives Industry Volume (K Tons), by End-user Industry 2024 & 2032
- Figure 53: Europe Phthalic Anhydride Derivatives Industry Revenue Share (%), by End-user Industry 2024 & 2032
- Figure 54: Europe Phthalic Anhydride Derivatives Industry Volume Share (%), by End-user Industry 2024 & 2032
- Figure 55: Europe Phthalic Anhydride Derivatives Industry Revenue (Million), by Country 2024 & 2032
- Figure 56: Europe Phthalic Anhydride Derivatives Industry Volume (K Tons), by Country 2024 & 2032
- Figure 57: Europe Phthalic Anhydride Derivatives Industry Revenue Share (%), by Country 2024 & 2032
- Figure 58: Europe Phthalic Anhydride Derivatives Industry Volume Share (%), by Country 2024 & 2032
- Figure 59: South America Phthalic Anhydride Derivatives Industry Revenue (Million), by Derivatives 2024 & 2032
- Figure 60: South America Phthalic Anhydride Derivatives Industry Volume (K Tons), by Derivatives 2024 & 2032
- Figure 61: South America Phthalic Anhydride Derivatives Industry Revenue Share (%), by Derivatives 2024 & 2032
- Figure 62: South America Phthalic Anhydride Derivatives Industry Volume Share (%), by Derivatives 2024 & 2032
- Figure 63: South America Phthalic Anhydride Derivatives Industry Revenue (Million), by End-user Industry 2024 & 2032
- Figure 64: South America Phthalic Anhydride Derivatives Industry Volume (K Tons), by End-user Industry 2024 & 2032
- Figure 65: South America Phthalic Anhydride Derivatives Industry Revenue Share (%), by End-user Industry 2024 & 2032
- Figure 66: South America Phthalic Anhydride Derivatives Industry Volume Share (%), by End-user Industry 2024 & 2032
- Figure 67: South America Phthalic Anhydride Derivatives Industry Revenue (Million), by Country 2024 & 2032
- Figure 68: South America Phthalic Anhydride Derivatives Industry Volume (K Tons), by Country 2024 & 2032
- Figure 69: South America Phthalic Anhydride Derivatives Industry Revenue Share (%), by Country 2024 & 2032
- Figure 70: South America Phthalic Anhydride Derivatives Industry Volume Share (%), by Country 2024 & 2032
- Figure 71: Middle East and Africa Phthalic Anhydride Derivatives Industry Revenue (Million), by Derivatives 2024 & 2032
- Figure 72: Middle East and Africa Phthalic Anhydride Derivatives Industry Volume (K Tons), by Derivatives 2024 & 2032
- Figure 73: Middle East and Africa Phthalic Anhydride Derivatives Industry Revenue Share (%), by Derivatives 2024 & 2032
- Figure 74: Middle East and Africa Phthalic Anhydride Derivatives Industry Volume Share (%), by Derivatives 2024 & 2032
- Figure 75: Middle East and Africa Phthalic Anhydride Derivatives Industry Revenue (Million), by End-user Industry 2024 & 2032
- Figure 76: Middle East and Africa Phthalic Anhydride Derivatives Industry Volume (K Tons), by End-user Industry 2024 & 2032
- Figure 77: Middle East and Africa Phthalic Anhydride Derivatives Industry Revenue Share (%), by End-user Industry 2024 & 2032
- Figure 78: Middle East and Africa Phthalic Anhydride Derivatives Industry Volume Share (%), by End-user Industry 2024 & 2032
- Figure 79: Middle East and Africa Phthalic Anhydride Derivatives Industry Revenue (Million), by Country 2024 & 2032
- Figure 80: Middle East and Africa Phthalic Anhydride Derivatives Industry Volume (K Tons), by Country 2024 & 2032
- Figure 81: Middle East and Africa Phthalic Anhydride Derivatives Industry Revenue Share (%), by Country 2024 & 2032
- Figure 82: Middle East and Africa Phthalic Anhydride Derivatives Industry Volume Share (%), by Country 2024 & 2032
List of Tables
- Table 1: Global Phthalic Anhydride Derivatives Industry Revenue Million Forecast, by Region 2019 & 2032
- Table 2: Global Phthalic Anhydride Derivatives Industry Volume K Tons Forecast, by Region 2019 & 2032
- Table 3: Global Phthalic Anhydride Derivatives Industry Revenue Million Forecast, by Derivatives 2019 & 2032
- Table 4: Global Phthalic Anhydride Derivatives Industry Volume K Tons Forecast, by Derivatives 2019 & 2032
- Table 5: Global Phthalic Anhydride Derivatives Industry Revenue Million Forecast, by End-user Industry 2019 & 2032
- Table 6: Global Phthalic Anhydride Derivatives Industry Volume K Tons Forecast, by End-user Industry 2019 & 2032
- Table 7: Global Phthalic Anhydride Derivatives Industry Revenue Million Forecast, by Region 2019 & 2032
- Table 8: Global Phthalic Anhydride Derivatives Industry Volume K Tons Forecast, by Region 2019 & 2032
- Table 9: Global Phthalic Anhydride Derivatives Industry Revenue Million Forecast, by Country 2019 & 2032
- Table 10: Global Phthalic Anhydride Derivatives Industry Volume K Tons Forecast, by Country 2019 & 2032
- Table 11: United States Phthalic Anhydride Derivatives Industry Revenue (Million) Forecast, by Application 2019 & 2032
- Table 12: United States Phthalic Anhydride Derivatives Industry Volume (K Tons) Forecast, by Application 2019 & 2032
- Table 13: Canada Phthalic Anhydride Derivatives Industry Revenue (Million) Forecast, by Application 2019 & 2032
- Table 14: Canada Phthalic Anhydride Derivatives Industry Volume (K Tons) Forecast, by Application 2019 & 2032
- Table 15: Mexico Phthalic Anhydride Derivatives Industry Revenue (Million) Forecast, by Application 2019 & 2032
- Table 16: Mexico Phthalic Anhydride Derivatives Industry Volume (K Tons) Forecast, by Application 2019 & 2032
- Table 17: Global Phthalic Anhydride Derivatives Industry Revenue Million Forecast, by Country 2019 & 2032
- Table 18: Global Phthalic Anhydride Derivatives Industry Volume K Tons Forecast, by Country 2019 & 2032
- Table 19: Germany Phthalic Anhydride Derivatives Industry Revenue (Million) Forecast, by Application 2019 & 2032
- Table 20: Germany Phthalic Anhydride Derivatives Industry Volume (K Tons) Forecast, by Application 2019 & 2032
- Table 21: France Phthalic Anhydride Derivatives Industry Revenue (Million) Forecast, by Application 2019 & 2032
- Table 22: France Phthalic Anhydride Derivatives Industry Volume (K Tons) Forecast, by Application 2019 & 2032
- Table 23: Italy Phthalic Anhydride Derivatives Industry Revenue (Million) Forecast, by Application 2019 & 2032
- Table 24: Italy Phthalic Anhydride Derivatives Industry Volume (K Tons) Forecast, by Application 2019 & 2032
- Table 25: United Kingdom Phthalic Anhydride Derivatives Industry Revenue (Million) Forecast, by Application 2019 & 2032
- Table 26: United Kingdom Phthalic Anhydride Derivatives Industry Volume (K Tons) Forecast, by Application 2019 & 2032
- Table 27: Netherlands Phthalic Anhydride Derivatives Industry Revenue (Million) Forecast, by Application 2019 & 2032
- Table 28: Netherlands Phthalic Anhydride Derivatives Industry Volume (K Tons) Forecast, by Application 2019 & 2032
- Table 29: Rest of Europe Phthalic Anhydride Derivatives Industry Revenue (Million) Forecast, by Application 2019 & 2032
- Table 30: Rest of Europe Phthalic Anhydride Derivatives Industry Volume (K Tons) Forecast, by Application 2019 & 2032
- Table 31: Global Phthalic Anhydride Derivatives Industry Revenue Million Forecast, by Country 2019 & 2032
- Table 32: Global Phthalic Anhydride Derivatives Industry Volume K Tons Forecast, by Country 2019 & 2032
- Table 33: China Phthalic Anhydride Derivatives Industry Revenue (Million) Forecast, by Application 2019 & 2032
- Table 34: China Phthalic Anhydride Derivatives Industry Volume (K Tons) Forecast, by Application 2019 & 2032
- Table 35: Japan Phthalic Anhydride Derivatives Industry Revenue (Million) Forecast, by Application 2019 & 2032
- Table 36: Japan Phthalic Anhydride Derivatives Industry Volume (K Tons) Forecast, by Application 2019 & 2032
- Table 37: India Phthalic Anhydride Derivatives Industry Revenue (Million) Forecast, by Application 2019 & 2032
- Table 38: India Phthalic Anhydride Derivatives Industry Volume (K Tons) Forecast, by Application 2019 & 2032
- Table 39: South Korea Phthalic Anhydride Derivatives Industry Revenue (Million) Forecast, by Application 2019 & 2032
- Table 40: South Korea Phthalic Anhydride Derivatives Industry Volume (K Tons) Forecast, by Application 2019 & 2032
- Table 41: Taiwan Phthalic Anhydride Derivatives Industry Revenue (Million) Forecast, by Application 2019 & 2032
- Table 42: Taiwan Phthalic Anhydride Derivatives Industry Volume (K Tons) Forecast, by Application 2019 & 2032
- Table 43: Australia Phthalic Anhydride Derivatives Industry Revenue (Million) Forecast, by Application 2019 & 2032
- Table 44: Australia Phthalic Anhydride Derivatives Industry Volume (K Tons) Forecast, by Application 2019 & 2032
- Table 45: Rest of Asia-Pacific Phthalic Anhydride Derivatives Industry Revenue (Million) Forecast, by Application 2019 & 2032
- Table 46: Rest of Asia-Pacific Phthalic Anhydride Derivatives Industry Volume (K Tons) Forecast, by Application 2019 & 2032
- Table 47: Global Phthalic Anhydride Derivatives Industry Revenue Million Forecast, by Country 2019 & 2032
- Table 48: Global Phthalic Anhydride Derivatives Industry Volume K Tons Forecast, by Country 2019 & 2032
- Table 49: Brazil Phthalic Anhydride Derivatives Industry Revenue (Million) Forecast, by Application 2019 & 2032
- Table 50: Brazil Phthalic Anhydride Derivatives Industry Volume (K Tons) Forecast, by Application 2019 & 2032
- Table 51: Argentina Phthalic Anhydride Derivatives Industry Revenue (Million) Forecast, by Application 2019 & 2032
- Table 52: Argentina Phthalic Anhydride Derivatives Industry Volume (K Tons) Forecast, by Application 2019 & 2032
- Table 53: Rest of South America Phthalic Anhydride Derivatives Industry Revenue (Million) Forecast, by Application 2019 & 2032
- Table 54: Rest of South America Phthalic Anhydride Derivatives Industry Volume (K Tons) Forecast, by Application 2019 & 2032
- Table 55: Global Phthalic Anhydride Derivatives Industry Revenue Million Forecast, by Country 2019 & 2032
- Table 56: Global Phthalic Anhydride Derivatives Industry Volume K Tons Forecast, by Country 2019 & 2032
- Table 57: Middle East Phthalic Anhydride Derivatives Industry Revenue (Million) Forecast, by Application 2019 & 2032
- Table 58: Middle East Phthalic Anhydride Derivatives Industry Volume (K Tons) Forecast, by Application 2019 & 2032
- Table 59: Africa Phthalic Anhydride Derivatives Industry Revenue (Million) Forecast, by Application 2019 & 2032
- Table 60: Africa Phthalic Anhydride Derivatives Industry Volume (K Tons) Forecast, by Application 2019 & 2032
- Table 61: Global Phthalic Anhydride Derivatives Industry Revenue Million Forecast, by Derivatives 2019 & 2032
- Table 62: Global Phthalic Anhydride Derivatives Industry Volume K Tons Forecast, by Derivatives 2019 & 2032
- Table 63: Global Phthalic Anhydride Derivatives Industry Revenue Million Forecast, by End-user Industry 2019 & 2032
- Table 64: Global Phthalic Anhydride Derivatives Industry Volume K Tons Forecast, by End-user Industry 2019 & 2032
- Table 65: Global Phthalic Anhydride Derivatives Industry Revenue Million Forecast, by Country 2019 & 2032
- Table 66: Global Phthalic Anhydride Derivatives Industry Volume K Tons Forecast, by Country 2019 & 2032
- Table 67: China Phthalic Anhydride Derivatives Industry Revenue (Million) Forecast, by Application 2019 & 2032
- Table 68: China Phthalic Anhydride Derivatives Industry Volume (K Tons) Forecast, by Application 2019 & 2032
- Table 69: India Phthalic Anhydride Derivatives Industry Revenue (Million) Forecast, by Application 2019 & 2032
- Table 70: India Phthalic Anhydride Derivatives Industry Volume (K Tons) Forecast, by Application 2019 & 2032
- Table 71: Japan Phthalic Anhydride Derivatives Industry Revenue (Million) Forecast, by Application 2019 & 2032
- Table 72: Japan Phthalic Anhydride Derivatives Industry Volume (K Tons) Forecast, by Application 2019 & 2032
- Table 73: South Korea Phthalic Anhydride Derivatives Industry Revenue (Million) Forecast, by Application 2019 & 2032
- Table 74: South Korea Phthalic Anhydride Derivatives Industry Volume (K Tons) Forecast, by Application 2019 & 2032
- Table 75: Rest of Asia Pacific Phthalic Anhydride Derivatives Industry Revenue (Million) Forecast, by Application 2019 & 2032
- Table 76: Rest of Asia Pacific Phthalic Anhydride Derivatives Industry Volume (K Tons) Forecast, by Application 2019 & 2032
- Table 77: Global Phthalic Anhydride Derivatives Industry Revenue Million Forecast, by Derivatives 2019 & 2032
- Table 78: Global Phthalic Anhydride Derivatives Industry Volume K Tons Forecast, by Derivatives 2019 & 2032
- Table 79: Global Phthalic Anhydride Derivatives Industry Revenue Million Forecast, by End-user Industry 2019 & 2032
- Table 80: Global Phthalic Anhydride Derivatives Industry Volume K Tons Forecast, by End-user Industry 2019 & 2032
- Table 81: Global Phthalic Anhydride Derivatives Industry Revenue Million Forecast, by Country 2019 & 2032
- Table 82: Global Phthalic Anhydride Derivatives Industry Volume K Tons Forecast, by Country 2019 & 2032
- Table 83: United States Phthalic Anhydride Derivatives Industry Revenue (Million) Forecast, by Application 2019 & 2032
- Table 84: United States Phthalic Anhydride Derivatives Industry Volume (K Tons) Forecast, by Application 2019 & 2032
- Table 85: Canada Phthalic Anhydride Derivatives Industry Revenue (Million) Forecast, by Application 2019 & 2032
- Table 86: Canada Phthalic Anhydride Derivatives Industry Volume (K Tons) Forecast, by Application 2019 & 2032
- Table 87: Mexico Phthalic Anhydride Derivatives Industry Revenue (Million) Forecast, by Application 2019 & 2032
- Table 88: Mexico Phthalic Anhydride Derivatives Industry Volume (K Tons) Forecast, by Application 2019 & 2032
- Table 89: Global Phthalic Anhydride Derivatives Industry Revenue Million Forecast, by Derivatives 2019 & 2032
- Table 90: Global Phthalic Anhydride Derivatives Industry Volume K Tons Forecast, by Derivatives 2019 & 2032
- Table 91: Global Phthalic Anhydride Derivatives Industry Revenue Million Forecast, by End-user Industry 2019 & 2032
- Table 92: Global Phthalic Anhydride Derivatives Industry Volume K Tons Forecast, by End-user Industry 2019 & 2032
- Table 93: Global Phthalic Anhydride Derivatives Industry Revenue Million Forecast, by Country 2019 & 2032
- Table 94: Global Phthalic Anhydride Derivatives Industry Volume K Tons Forecast, by Country 2019 & 2032
- Table 95: Germany Phthalic Anhydride Derivatives Industry Revenue (Million) Forecast, by Application 2019 & 2032
- Table 96: Germany Phthalic Anhydride Derivatives Industry Volume (K Tons) Forecast, by Application 2019 & 2032
- Table 97: United Kingdom Phthalic Anhydride Derivatives Industry Revenue (Million) Forecast, by Application 2019 & 2032
- Table 98: United Kingdom Phthalic Anhydride Derivatives Industry Volume (K Tons) Forecast, by Application 2019 & 2032
- Table 99: France Phthalic Anhydride Derivatives Industry Revenue (Million) Forecast, by Application 2019 & 2032
- Table 100: France Phthalic Anhydride Derivatives Industry Volume (K Tons) Forecast, by Application 2019 & 2032
- Table 101: Italy Phthalic Anhydride Derivatives Industry Revenue (Million) Forecast, by Application 2019 & 2032
- Table 102: Italy Phthalic Anhydride Derivatives Industry Volume (K Tons) Forecast, by Application 2019 & 2032
- Table 103: Rest of Europe Phthalic Anhydride Derivatives Industry Revenue (Million) Forecast, by Application 2019 & 2032
- Table 104: Rest of Europe Phthalic Anhydride Derivatives Industry Volume (K Tons) Forecast, by Application 2019 & 2032
- Table 105: Global Phthalic Anhydride Derivatives Industry Revenue Million Forecast, by Derivatives 2019 & 2032
- Table 106: Global Phthalic Anhydride Derivatives Industry Volume K Tons Forecast, by Derivatives 2019 & 2032
- Table 107: Global Phthalic Anhydride Derivatives Industry Revenue Million Forecast, by End-user Industry 2019 & 2032
- Table 108: Global Phthalic Anhydride Derivatives Industry Volume K Tons Forecast, by End-user Industry 2019 & 2032
- Table 109: Global Phthalic Anhydride Derivatives Industry Revenue Million Forecast, by Country 2019 & 2032
- Table 110: Global Phthalic Anhydride Derivatives Industry Volume K Tons Forecast, by Country 2019 & 2032
- Table 111: Brazil Phthalic Anhydride Derivatives Industry Revenue (Million) Forecast, by Application 2019 & 2032
- Table 112: Brazil Phthalic Anhydride Derivatives Industry Volume (K Tons) Forecast, by Application 2019 & 2032
- Table 113: Argentina Phthalic Anhydride Derivatives Industry Revenue (Million) Forecast, by Application 2019 & 2032
- Table 114: Argentina Phthalic Anhydride Derivatives Industry Volume (K Tons) Forecast, by Application 2019 & 2032
- Table 115: Rest of South America Phthalic Anhydride Derivatives Industry Revenue (Million) Forecast, by Application 2019 & 2032
- Table 116: Rest of South America Phthalic Anhydride Derivatives Industry Volume (K Tons) Forecast, by Application 2019 & 2032
- Table 117: Global Phthalic Anhydride Derivatives Industry Revenue Million Forecast, by Derivatives 2019 & 2032
- Table 118: Global Phthalic Anhydride Derivatives Industry Volume K Tons Forecast, by Derivatives 2019 & 2032
- Table 119: Global Phthalic Anhydride Derivatives Industry Revenue Million Forecast, by End-user Industry 2019 & 2032
- Table 120: Global Phthalic Anhydride Derivatives Industry Volume K Tons Forecast, by End-user Industry 2019 & 2032
- Table 121: Global Phthalic Anhydride Derivatives Industry Revenue Million Forecast, by Country 2019 & 2032
- Table 122: Global Phthalic Anhydride Derivatives Industry Volume K Tons Forecast, by Country 2019 & 2032
- Table 123: Saudi Arabia Phthalic Anhydride Derivatives Industry Revenue (Million) Forecast, by Application 2019 & 2032
- Table 124: Saudi Arabia Phthalic Anhydride Derivatives Industry Volume (K Tons) Forecast, by Application 2019 & 2032
- Table 125: South Africa Phthalic Anhydride Derivatives Industry Revenue (Million) Forecast, by Application 2019 & 2032
- Table 126: South Africa Phthalic Anhydride Derivatives Industry Volume (K Tons) Forecast, by Application 2019 & 2032
- Table 127: Rest of Middle East and Africa Phthalic Anhydride Derivatives Industry Revenue (Million) Forecast, by Application 2019 & 2032
- Table 128: Rest of Middle East and Africa Phthalic Anhydride Derivatives Industry Volume (K Tons) Forecast, by Application 2019 & 2032
Frequently Asked Questions
1. What is the projected Compound Annual Growth Rate (CAGR) of the Phthalic Anhydride Derivatives Industry?
The projected CAGR is approximately > 4.40%.
2. Which companies are prominent players in the Phthalic Anhydride Derivatives Industry?
Key companies in the market include KH Chemicals, Stepan Company, LANXESS, BASF SE, Alfa Aesar, PENPET Petrochemical Trading GmbH, JFE Chemical Corporation, I G Petrochemicals Ltd, Polynt SpA, Thirumalai Chemicals Ltd, Tokyo Chemical Industry, S I Group Inc, Koppers Inc, Perstorp, The Chemical Company.
3. What are the main segments of the Phthalic Anhydride Derivatives Industry?
The market segments include Derivatives, End-user Industry.
4. Can you provide details about the market size?
The market size is estimated to be USD XX Million as of 2022.
5. What are some drivers contributing to market growth?
; Increasing Consumption of Plastics in Construction Sector; Other Drivers.
6. What are the notable trends driving market growth?
Construction Sector to Dominate the Market.
7. Are there any restraints impacting market growth?
; Toxicity related to Phthalic Anhydride; Unfavorable Conditions Arising Due to COVID-19 Outbreak.
8. Can you provide examples of recent developments in the market?
N/A
9. What pricing options are available for accessing the report?
Pricing options include single-user, multi-user, and enterprise licenses priced at USD 4750, USD 5250, and USD 8750 respectively.
10. Is the market size provided in terms of value or volume?
The market size is provided in terms of value, measured in Million and volume, measured in K Tons.
11. Are there any specific market keywords associated with the report?
Yes, the market keyword associated with the report is "Phthalic Anhydride Derivatives Industry," which aids in identifying and referencing the specific market segment covered.
12. How do I determine which pricing option suits my needs best?
The pricing options vary based on user requirements and access needs. Individual users may opt for single-user licenses, while businesses requiring broader access may choose multi-user or enterprise licenses for cost-effective access to the report.
13. Are there any additional resources or data provided in the Phthalic Anhydride Derivatives Industry report?
While the report offers comprehensive insights, it's advisable to review the specific contents or supplementary materials provided to ascertain if additional resources or data are available.
14. How can I stay updated on further developments or reports in the Phthalic Anhydride Derivatives Industry?
To stay informed about further developments, trends, and reports in the Phthalic Anhydride Derivatives Industry, consider subscribing to industry newsletters, following relevant companies and organizations, or regularly checking reputable industry news sources and publications.
Methodology
Step 1 - Identification of Relevant Samples Size from Population Database


Step 2 - Approaches for Defining Global Market Size (Value, Volume* & Price*)

Note*: In applicable scenarios
Step 3 - Data Sources
Primary Research
- Web Analytics
- Survey Reports
- Research Institute
- Latest Research Reports
- Opinion Leaders
Secondary Research
- Annual Reports
- White Paper
- Latest Press Release
- Industry Association
- Paid Database
- Investor Presentations

Step 4 - Data Triangulation
Involves using different sources of information in order to increase the validity of a study
These sources are likely to be stakeholders in a program - participants, other researchers, program staff, other community members, and so on.
Then we put all data in single framework & apply various statistical tools to find out the dynamic on the market.
During the analysis stage, feedback from the stakeholder groups would be compared to determine areas of agreement as well as areas of divergence
