

Key Insights
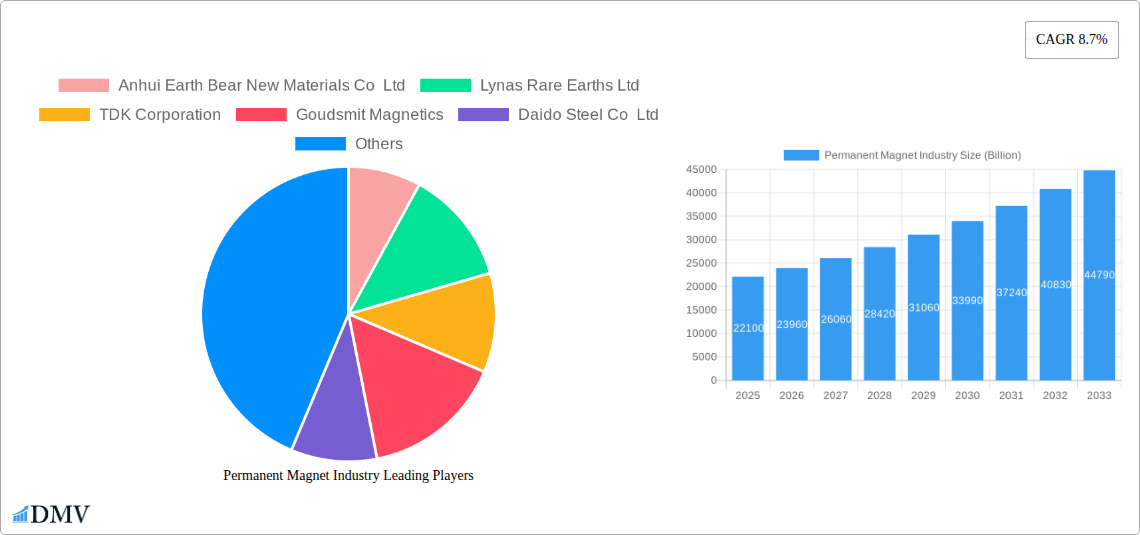
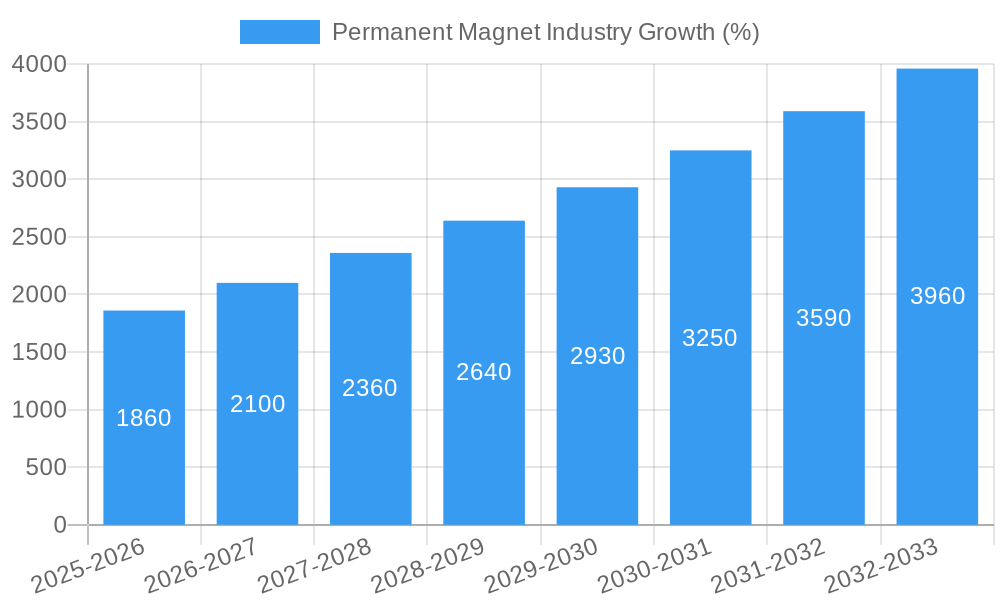
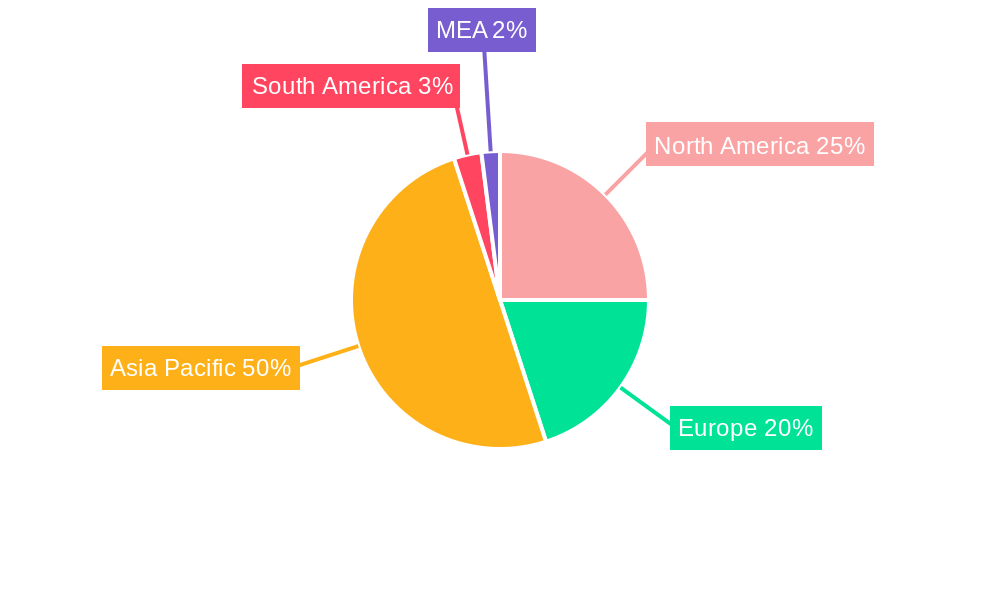
The global permanent magnet market, valued at $22.1 billion in 2025, is projected to experience robust growth, driven by a compound annual growth rate (CAGR) of 8.7% from 2025 to 2033. This expansion is fueled by several key factors. The burgeoning automotive sector, particularly electric vehicles (EVs) and hybrid electric vehicles (HEVs), is a significant driver, demanding high-performance permanent magnets for electric motors and generators. The electronics industry's continued growth, especially in consumer electronics and renewable energy technologies like wind turbines and solar inverters, further contributes to the market's expansion. Technological advancements leading to improved magnet properties, such as higher energy density and temperature resistance, are also boosting market growth. Furthermore, increasing government initiatives promoting energy efficiency and the adoption of green technologies are creating a favorable environment for permanent magnet manufacturers. Specific material types like Neodymium-Iron-Boron (NdFeB) magnets dominate the market due to their superior magnetic properties, though other types like Samarium Cobalt are gaining traction in niche applications demanding extreme temperature resistance. Geographic expansion, with Asia-Pacific regions like China and Japan leading the manufacturing and consumption of permanent magnets, plays a key role in the overall market dynamics.
Despite the positive outlook, challenges remain. Fluctuations in rare earth element prices, a key component in many permanent magnets, can impact profitability and production. Geopolitical factors and supply chain disruptions related to these raw materials can also create uncertainties. Furthermore, the development of alternative magnet technologies and materials is a potential restraint on the market growth of traditional permanent magnet types. However, ongoing research and development efforts are focusing on improving efficiency, reducing costs, and enhancing the sustainability of permanent magnet production. The competitive landscape is characterized by a mix of established global players and emerging regional manufacturers, leading to innovation and price competition. Companies like TDK Corporation, Hitachi Metals Ltd, and Lynas Rare Earths Ltd are key players navigating these market dynamics. The continued growth in end-user industries and technological advancements ensures the long-term potential of the permanent magnet market remains strong.
Permanent Magnet Industry: A Comprehensive Market Report (2019-2033)
This insightful report provides a detailed analysis of the global permanent magnet industry, projecting a market value exceeding $XX billion by 2033. The study covers the period from 2019 to 2033, with 2025 as the base and estimated year. It offers invaluable insights for stakeholders seeking to navigate this dynamic and rapidly evolving sector. The report leverages extensive primary and secondary research, incorporating key market trends, competitive landscapes, technological advancements, and future growth projections.
Permanent Magnet Industry Market Composition & Trends
This section analyzes the competitive landscape of the permanent magnet industry, evaluating market concentration, innovation drivers, regulatory influences, substitute products, end-user trends, and mergers & acquisitions (M&A) activity. The report meticulously assesses the market share distribution amongst key players, including Anhui Earth Bear New Materials Co Ltd, Lynas Rare Earths Ltd, TDK Corporation, Goudsmit Magnetics, Daido Steel Co Ltd, Galaxymagnets, Hitachi Metals Ltd, Arnold Magnetic Technologies, Shin-Etsu Chemical Co Ltd, and GKN Powder Metallurgy. The analysis incorporates data on M&A deal values, revealing significant shifts in market power and strategic alliances.
- Market Concentration: The industry exhibits a [High/Medium/Low - choose one] level of concentration, with the top 5 players holding approximately XX% of the global market share in 2024.
- Innovation Catalysts: Advancements in material science, particularly in Neodymium-Iron-Boron magnets, are driving significant innovation.
- Regulatory Landscape: Government regulations concerning rare earth element sourcing and environmental impact are shaping industry practices.
- Substitute Products: Electromagnets and other technologies present limited substitution, impacting market growth.
- End-User Profiles: Automotive, electronics, and industrial sectors represent the largest end-user segments.
- M&A Activity: The report details significant M&A activity with total deal values exceeding $XX billion during the historical period, driving consolidation and shaping the competitive landscape.
Permanent Magnet Industry Industry Evolution
This section delves into the historical and projected growth trajectories of the permanent magnet industry. The analysis covers technological advancements, evolving consumer demands, and the impact of macroeconomic factors on market dynamics. We examine growth rates from 2019 to 2024, projecting a Compound Annual Growth Rate (CAGR) of XX% from 2025 to 2033, driven by increasing demand from the electric vehicle and renewable energy sectors. The adoption of high-performance permanent magnets in various applications is accelerating, with a projected XX% increase in adoption rate between 2024 and 2033. Technological advancements, particularly in material composition and manufacturing processes, are further fueling market expansion. Emerging applications in advanced robotics and medical devices are also contributing to market growth. The shift towards sustainable energy solutions is a key driver, with the demand for permanent magnets in wind turbines and electric vehicles propelling industry growth.
Leading Regions, Countries, or Segments in Permanent Magnet Industry
This section identifies the dominant regions, countries, and segments within the permanent magnet industry.
End-user Industries:
- Automotive: The automotive sector is the leading end-user, driven by the rapid growth of electric vehicles (EVs). Key drivers include government incentives for EV adoption and increasing consumer demand for eco-friendly transportation.
- Electronics: The electronics sector represents a substantial market segment, with permanent magnets used in various applications, from speakers and motors to hard disk drives. Miniaturization trends and the growth of consumer electronics fuel this segment's expansion.
- Industrial: The industrial sector exhibits steady growth, driven by the use of permanent magnets in various machinery and automation systems.
- Power Generation: The renewable energy sector, particularly wind power, is a significant driver of growth, with permanent magnets playing a critical role in wind turbine generators.
- Other End-user Industries: Medical devices, robotics, and aerospace sectors are emerging markets showing high growth potential.
Material Types:
- Neodymium-Iron-Boron (NdFeB): NdFeB magnets dominate the market due to their superior performance and cost-effectiveness, holding approximately XX% of market share in 2024. Investment in advanced manufacturing techniques further enhances their market dominance.
- Ferrite: Ferrite magnets maintain a significant market share due to their lower cost, making them suitable for various low-performance applications.
- Samarium Cobalt (SmCo): SmCo magnets cater to niche applications requiring high-temperature stability and corrosion resistance.
- Alnico: Alnico magnets are used in specialized applications where high temperature stability is crucial.
- Others: This category encompasses emerging material types that are expected to gain traction in the future.
Permanent Magnet Industry Product Innovations
Recent innovations include the development of higher-performance NdFeB magnets with enhanced temperature stability and corrosion resistance. Advanced manufacturing techniques, such as additive manufacturing (3D printing), are enabling the creation of customized magnet geometries and improved efficiency. These innovations are driving the expansion of permanent magnet applications into high-performance sectors such as aerospace and medical devices. Unique selling propositions include increased magnetic strength, improved temperature stability, and reduced manufacturing costs.
Propelling Factors for Permanent Magnet Industry Growth
The permanent magnet industry's growth is fueled by several key factors: the burgeoning electric vehicle market; increasing demand for renewable energy technologies, such as wind turbines; technological advancements leading to higher-performance magnets; and government initiatives promoting energy efficiency and sustainable technologies. The rising adoption of automation in industrial settings is another significant driver.
Obstacles in the Permanent Magnet Industry Market
The industry faces challenges such as the fluctuating price and supply of rare earth elements, particularly neodymium and dysprosium, which are critical components of high-performance NdFeB magnets. Geopolitical uncertainties and supply chain disruptions can impact availability and cost. Intense competition among established players and the emergence of new entrants also create pressure on profitability.
Future Opportunities in Permanent Magnet Industry
Future opportunities lie in the development of more sustainable and cost-effective magnet materials, expanding applications in emerging sectors like robotics and medical devices, and advancements in magnet design and manufacturing processes. The growing demand for energy-efficient technologies will continue to drive market growth.
Major Players in the Permanent Magnet Industry Ecosystem
- TDK Corporation
- Lynas Rare Earths Ltd
- Hitachi Metals Ltd
- Anhui Earth Bear New Materials Co Ltd
- Goudsmit Magnetics
- Daido Steel Co Ltd
- Galaxymagnets
- Arnold Magnetic Technologies
- Shin-Etsu Chemical Co Ltd
- GKN Powder Metallurgy
Key Developments in Permanent Magnet Industry Industry
- July 2022: GKN Powder Metallurgy announced plans to establish a capacity to produce up to 4,000 tons of permanent magnets per year for the EV market by 2024. This signifies a significant investment in the EV sector and increased production capacity.
- September 2022: Solvay announced plans to expand its rare earths operations in La Rochelle, France, to enter the value chain for rare earths permanent magnets in Europe. This development aims to strengthen the European supply chain for permanent magnets, supporting the growth of wind power, electric vehicles, and electronics markets within Europe.
Strategic Permanent Magnet Industry Market Forecast
The permanent magnet market is poised for substantial growth, driven by the increasing demand for electric vehicles, renewable energy technologies, and advanced industrial applications. Continued innovation in material science and manufacturing processes will further fuel market expansion. The market's future prospects remain highly positive, with consistent growth anticipated throughout the forecast period.
Permanent Magnet Industry Segmentation
-
1. Material Type
- 1.1. Neodymium-Iron-Boron
- 1.2. Ferrite
- 1.3. Samarium Cobalt
- 1.4. Alnico
-
2. End-user Industry
- 2.1. Automotive
- 2.2. Electronics
- 2.3. Industrial
- 2.4. Power Generation
- 2.5. Other End-user Industries
Permanent Magnet Industry Segmentation By Geography
-
1. Asia Pacific
- 1.1. China
- 1.2. India
- 1.3. Japan
- 1.4. South Korea
- 1.5. Rest of Asia Pacific
-
2. North America
- 2.1. United States
- 2.2. Canada
- 2.3. Mexico
-
3. Europe
- 3.1. Germany
- 3.2. United Kingdom
- 3.3. France
- 3.4. Italy
- 3.5. Rest of Europe
-
4. South America
- 4.1. Brazil
- 4.2. Argentina
- 4.3. Rest of South America
-
5. Middle East and Africa
- 5.1. Saudi Arabia
- 5.2. South Africa
- 5.3. Rest of Middle East and Africa
Permanent Magnet Industry REPORT HIGHLIGHTS
| Aspects | Details |
|---|---|
| Study Period | 2019-2033 |
| Base Year | 2024 |
| Estimated Year | 2025 |
| Forecast Period | 2025-2033 |
| Historical Period | 2019-2024 |
| Growth Rate | CAGR of 8.7% from 2019-2033 |
| Segmentation |
|
Table of Contents
- 1. Introduction
- 1.1. Research Scope
- 1.2. Market Segmentation
- 1.3. Research Methodology
- 1.4. Definitions and Assumptions
- 2. Executive Summary
- 2.1. Introduction
- 3. Market Dynamics
- 3.1. Introduction
- 3.2. Market Drivers
- 3.2.1. Increasing Electro-mechanical Applications; Other Drivers
- 3.3. Market Restrains
- 3.3.1. Competition from Substitutes; Other Restraints
- 3.4. Market Trends
- 3.4.1. Growing Demand from Electronics Industry
- 4. Market Factor Analysis
- 4.1. Porters Five Forces
- 4.2. Supply/Value Chain
- 4.3. PESTEL analysis
- 4.4. Market Entropy
- 4.5. Patent/Trademark Analysis
- 5. Global Permanent Magnet Industry Analysis, Insights and Forecast, 2019-2031
- 5.1. Market Analysis, Insights and Forecast - by Material Type
- 5.1.1. Neodymium-Iron-Boron
- 5.1.2. Ferrite
- 5.1.3. Samarium Cobalt
- 5.1.4. Alnico
- 5.2. Market Analysis, Insights and Forecast - by End-user Industry
- 5.2.1. Automotive
- 5.2.2. Electronics
- 5.2.3. Industrial
- 5.2.4. Power Generation
- 5.2.5. Other End-user Industries
- 5.3. Market Analysis, Insights and Forecast - by Region
- 5.3.1. Asia Pacific
- 5.3.2. North America
- 5.3.3. Europe
- 5.3.4. South America
- 5.3.5. Middle East and Africa
- 5.1. Market Analysis, Insights and Forecast - by Material Type
- 6. Asia Pacific Permanent Magnet Industry Analysis, Insights and Forecast, 2019-2031
- 6.1. Market Analysis, Insights and Forecast - by Material Type
- 6.1.1. Neodymium-Iron-Boron
- 6.1.2. Ferrite
- 6.1.3. Samarium Cobalt
- 6.1.4. Alnico
- 6.2. Market Analysis, Insights and Forecast - by End-user Industry
- 6.2.1. Automotive
- 6.2.2. Electronics
- 6.2.3. Industrial
- 6.2.4. Power Generation
- 6.2.5. Other End-user Industries
- 6.1. Market Analysis, Insights and Forecast - by Material Type
- 7. North America Permanent Magnet Industry Analysis, Insights and Forecast, 2019-2031
- 7.1. Market Analysis, Insights and Forecast - by Material Type
- 7.1.1. Neodymium-Iron-Boron
- 7.1.2. Ferrite
- 7.1.3. Samarium Cobalt
- 7.1.4. Alnico
- 7.2. Market Analysis, Insights and Forecast - by End-user Industry
- 7.2.1. Automotive
- 7.2.2. Electronics
- 7.2.3. Industrial
- 7.2.4. Power Generation
- 7.2.5. Other End-user Industries
- 7.1. Market Analysis, Insights and Forecast - by Material Type
- 8. Europe Permanent Magnet Industry Analysis, Insights and Forecast, 2019-2031
- 8.1. Market Analysis, Insights and Forecast - by Material Type
- 8.1.1. Neodymium-Iron-Boron
- 8.1.2. Ferrite
- 8.1.3. Samarium Cobalt
- 8.1.4. Alnico
- 8.2. Market Analysis, Insights and Forecast - by End-user Industry
- 8.2.1. Automotive
- 8.2.2. Electronics
- 8.2.3. Industrial
- 8.2.4. Power Generation
- 8.2.5. Other End-user Industries
- 8.1. Market Analysis, Insights and Forecast - by Material Type
- 9. South America Permanent Magnet Industry Analysis, Insights and Forecast, 2019-2031
- 9.1. Market Analysis, Insights and Forecast - by Material Type
- 9.1.1. Neodymium-Iron-Boron
- 9.1.2. Ferrite
- 9.1.3. Samarium Cobalt
- 9.1.4. Alnico
- 9.2. Market Analysis, Insights and Forecast - by End-user Industry
- 9.2.1. Automotive
- 9.2.2. Electronics
- 9.2.3. Industrial
- 9.2.4. Power Generation
- 9.2.5. Other End-user Industries
- 9.1. Market Analysis, Insights and Forecast - by Material Type
- 10. Middle East and Africa Permanent Magnet Industry Analysis, Insights and Forecast, 2019-2031
- 10.1. Market Analysis, Insights and Forecast - by Material Type
- 10.1.1. Neodymium-Iron-Boron
- 10.1.2. Ferrite
- 10.1.3. Samarium Cobalt
- 10.1.4. Alnico
- 10.2. Market Analysis, Insights and Forecast - by End-user Industry
- 10.2.1. Automotive
- 10.2.2. Electronics
- 10.2.3. Industrial
- 10.2.4. Power Generation
- 10.2.5. Other End-user Industries
- 10.1. Market Analysis, Insights and Forecast - by Material Type
- 11. North America Permanent Magnet Industry Analysis, Insights and Forecast, 2019-2031
- 11.1. Market Analysis, Insights and Forecast - By Country/Sub-region
- 11.1.1 United States
- 11.1.2 Canada
- 11.1.3 Mexico
- 12. Europe Permanent Magnet Industry Analysis, Insights and Forecast, 2019-2031
- 12.1. Market Analysis, Insights and Forecast - By Country/Sub-region
- 12.1.1 Germany
- 12.1.2 France
- 12.1.3 Italy
- 12.1.4 United Kingdom
- 12.1.5 Netherlands
- 12.1.6 Rest of Europe
- 13. Asia Pacific Permanent Magnet Industry Analysis, Insights and Forecast, 2019-2031
- 13.1. Market Analysis, Insights and Forecast - By Country/Sub-region
- 13.1.1 China
- 13.1.2 Japan
- 13.1.3 India
- 13.1.4 South Korea
- 13.1.5 Taiwan
- 13.1.6 Australia
- 13.1.7 Rest of Asia-Pacific
- 14. South America Permanent Magnet Industry Analysis, Insights and Forecast, 2019-2031
- 14.1. Market Analysis, Insights and Forecast - By Country/Sub-region
- 14.1.1 Brazil
- 14.1.2 Argentina
- 14.1.3 Rest of South America
- 15. MEA Permanent Magnet Industry Analysis, Insights and Forecast, 2019-2031
- 15.1. Market Analysis, Insights and Forecast - By Country/Sub-region
- 15.1.1 Middle East
- 15.1.2 Africa
- 16. Competitive Analysis
- 16.1. Global Market Share Analysis 2024
- 16.2. Company Profiles
- 16.2.1 Anhui Earth Bear New Materials Co Ltd
- 16.2.1.1. Overview
- 16.2.1.2. Products
- 16.2.1.3. SWOT Analysis
- 16.2.1.4. Recent Developments
- 16.2.1.5. Financials (Based on Availability)
- 16.2.2 Lynas Rare Earths Ltd
- 16.2.2.1. Overview
- 16.2.2.2. Products
- 16.2.2.3. SWOT Analysis
- 16.2.2.4. Recent Developments
- 16.2.2.5. Financials (Based on Availability)
- 16.2.3 TDK Corporation
- 16.2.3.1. Overview
- 16.2.3.2. Products
- 16.2.3.3. SWOT Analysis
- 16.2.3.4. Recent Developments
- 16.2.3.5. Financials (Based on Availability)
- 16.2.4 Goudsmit Magnetics
- 16.2.4.1. Overview
- 16.2.4.2. Products
- 16.2.4.3. SWOT Analysis
- 16.2.4.4. Recent Developments
- 16.2.4.5. Financials (Based on Availability)
- 16.2.5 Daido Steel Co Ltd
- 16.2.5.1. Overview
- 16.2.5.2. Products
- 16.2.5.3. SWOT Analysis
- 16.2.5.4. Recent Developments
- 16.2.5.5. Financials (Based on Availability)
- 16.2.6 Galaxymagnets
- 16.2.6.1. Overview
- 16.2.6.2. Products
- 16.2.6.3. SWOT Analysis
- 16.2.6.4. Recent Developments
- 16.2.6.5. Financials (Based on Availability)
- 16.2.7 Hitachi Metals Ltd
- 16.2.7.1. Overview
- 16.2.7.2. Products
- 16.2.7.3. SWOT Analysis
- 16.2.7.4. Recent Developments
- 16.2.7.5. Financials (Based on Availability)
- 16.2.8 Arnold Magnetic Technologies
- 16.2.8.1. Overview
- 16.2.8.2. Products
- 16.2.8.3. SWOT Analysis
- 16.2.8.4. Recent Developments
- 16.2.8.5. Financials (Based on Availability)
- 16.2.9 Shin-Etsu Chemical Co Ltd
- 16.2.9.1. Overview
- 16.2.9.2. Products
- 16.2.9.3. SWOT Analysis
- 16.2.9.4. Recent Developments
- 16.2.9.5. Financials (Based on Availability)
- 16.2.10 GKN Powder Metallurgy
- 16.2.10.1. Overview
- 16.2.10.2. Products
- 16.2.10.3. SWOT Analysis
- 16.2.10.4. Recent Developments
- 16.2.10.5. Financials (Based on Availability)
- 16.2.1 Anhui Earth Bear New Materials Co Ltd
List of Figures
- Figure 1: Global Permanent Magnet Industry Revenue Breakdown (Billion, %) by Region 2024 & 2032
- Figure 2: Global Permanent Magnet Industry Volume Breakdown (K Tons, %) by Region 2024 & 2032
- Figure 3: North America Permanent Magnet Industry Revenue (Billion), by Country 2024 & 2032
- Figure 4: North America Permanent Magnet Industry Volume (K Tons), by Country 2024 & 2032
- Figure 5: North America Permanent Magnet Industry Revenue Share (%), by Country 2024 & 2032
- Figure 6: North America Permanent Magnet Industry Volume Share (%), by Country 2024 & 2032
- Figure 7: Europe Permanent Magnet Industry Revenue (Billion), by Country 2024 & 2032
- Figure 8: Europe Permanent Magnet Industry Volume (K Tons), by Country 2024 & 2032
- Figure 9: Europe Permanent Magnet Industry Revenue Share (%), by Country 2024 & 2032
- Figure 10: Europe Permanent Magnet Industry Volume Share (%), by Country 2024 & 2032
- Figure 11: Asia Pacific Permanent Magnet Industry Revenue (Billion), by Country 2024 & 2032
- Figure 12: Asia Pacific Permanent Magnet Industry Volume (K Tons), by Country 2024 & 2032
- Figure 13: Asia Pacific Permanent Magnet Industry Revenue Share (%), by Country 2024 & 2032
- Figure 14: Asia Pacific Permanent Magnet Industry Volume Share (%), by Country 2024 & 2032
- Figure 15: South America Permanent Magnet Industry Revenue (Billion), by Country 2024 & 2032
- Figure 16: South America Permanent Magnet Industry Volume (K Tons), by Country 2024 & 2032
- Figure 17: South America Permanent Magnet Industry Revenue Share (%), by Country 2024 & 2032
- Figure 18: South America Permanent Magnet Industry Volume Share (%), by Country 2024 & 2032
- Figure 19: MEA Permanent Magnet Industry Revenue (Billion), by Country 2024 & 2032
- Figure 20: MEA Permanent Magnet Industry Volume (K Tons), by Country 2024 & 2032
- Figure 21: MEA Permanent Magnet Industry Revenue Share (%), by Country 2024 & 2032
- Figure 22: MEA Permanent Magnet Industry Volume Share (%), by Country 2024 & 2032
- Figure 23: Asia Pacific Permanent Magnet Industry Revenue (Billion), by Material Type 2024 & 2032
- Figure 24: Asia Pacific Permanent Magnet Industry Volume (K Tons), by Material Type 2024 & 2032
- Figure 25: Asia Pacific Permanent Magnet Industry Revenue Share (%), by Material Type 2024 & 2032
- Figure 26: Asia Pacific Permanent Magnet Industry Volume Share (%), by Material Type 2024 & 2032
- Figure 27: Asia Pacific Permanent Magnet Industry Revenue (Billion), by End-user Industry 2024 & 2032
- Figure 28: Asia Pacific Permanent Magnet Industry Volume (K Tons), by End-user Industry 2024 & 2032
- Figure 29: Asia Pacific Permanent Magnet Industry Revenue Share (%), by End-user Industry 2024 & 2032
- Figure 30: Asia Pacific Permanent Magnet Industry Volume Share (%), by End-user Industry 2024 & 2032
- Figure 31: Asia Pacific Permanent Magnet Industry Revenue (Billion), by Country 2024 & 2032
- Figure 32: Asia Pacific Permanent Magnet Industry Volume (K Tons), by Country 2024 & 2032
- Figure 33: Asia Pacific Permanent Magnet Industry Revenue Share (%), by Country 2024 & 2032
- Figure 34: Asia Pacific Permanent Magnet Industry Volume Share (%), by Country 2024 & 2032
- Figure 35: North America Permanent Magnet Industry Revenue (Billion), by Material Type 2024 & 2032
- Figure 36: North America Permanent Magnet Industry Volume (K Tons), by Material Type 2024 & 2032
- Figure 37: North America Permanent Magnet Industry Revenue Share (%), by Material Type 2024 & 2032
- Figure 38: North America Permanent Magnet Industry Volume Share (%), by Material Type 2024 & 2032
- Figure 39: North America Permanent Magnet Industry Revenue (Billion), by End-user Industry 2024 & 2032
- Figure 40: North America Permanent Magnet Industry Volume (K Tons), by End-user Industry 2024 & 2032
- Figure 41: North America Permanent Magnet Industry Revenue Share (%), by End-user Industry 2024 & 2032
- Figure 42: North America Permanent Magnet Industry Volume Share (%), by End-user Industry 2024 & 2032
- Figure 43: North America Permanent Magnet Industry Revenue (Billion), by Country 2024 & 2032
- Figure 44: North America Permanent Magnet Industry Volume (K Tons), by Country 2024 & 2032
- Figure 45: North America Permanent Magnet Industry Revenue Share (%), by Country 2024 & 2032
- Figure 46: North America Permanent Magnet Industry Volume Share (%), by Country 2024 & 2032
- Figure 47: Europe Permanent Magnet Industry Revenue (Billion), by Material Type 2024 & 2032
- Figure 48: Europe Permanent Magnet Industry Volume (K Tons), by Material Type 2024 & 2032
- Figure 49: Europe Permanent Magnet Industry Revenue Share (%), by Material Type 2024 & 2032
- Figure 50: Europe Permanent Magnet Industry Volume Share (%), by Material Type 2024 & 2032
- Figure 51: Europe Permanent Magnet Industry Revenue (Billion), by End-user Industry 2024 & 2032
- Figure 52: Europe Permanent Magnet Industry Volume (K Tons), by End-user Industry 2024 & 2032
- Figure 53: Europe Permanent Magnet Industry Revenue Share (%), by End-user Industry 2024 & 2032
- Figure 54: Europe Permanent Magnet Industry Volume Share (%), by End-user Industry 2024 & 2032
- Figure 55: Europe Permanent Magnet Industry Revenue (Billion), by Country 2024 & 2032
- Figure 56: Europe Permanent Magnet Industry Volume (K Tons), by Country 2024 & 2032
- Figure 57: Europe Permanent Magnet Industry Revenue Share (%), by Country 2024 & 2032
- Figure 58: Europe Permanent Magnet Industry Volume Share (%), by Country 2024 & 2032
- Figure 59: South America Permanent Magnet Industry Revenue (Billion), by Material Type 2024 & 2032
- Figure 60: South America Permanent Magnet Industry Volume (K Tons), by Material Type 2024 & 2032
- Figure 61: South America Permanent Magnet Industry Revenue Share (%), by Material Type 2024 & 2032
- Figure 62: South America Permanent Magnet Industry Volume Share (%), by Material Type 2024 & 2032
- Figure 63: South America Permanent Magnet Industry Revenue (Billion), by End-user Industry 2024 & 2032
- Figure 64: South America Permanent Magnet Industry Volume (K Tons), by End-user Industry 2024 & 2032
- Figure 65: South America Permanent Magnet Industry Revenue Share (%), by End-user Industry 2024 & 2032
- Figure 66: South America Permanent Magnet Industry Volume Share (%), by End-user Industry 2024 & 2032
- Figure 67: South America Permanent Magnet Industry Revenue (Billion), by Country 2024 & 2032
- Figure 68: South America Permanent Magnet Industry Volume (K Tons), by Country 2024 & 2032
- Figure 69: South America Permanent Magnet Industry Revenue Share (%), by Country 2024 & 2032
- Figure 70: South America Permanent Magnet Industry Volume Share (%), by Country 2024 & 2032
- Figure 71: Middle East and Africa Permanent Magnet Industry Revenue (Billion), by Material Type 2024 & 2032
- Figure 72: Middle East and Africa Permanent Magnet Industry Volume (K Tons), by Material Type 2024 & 2032
- Figure 73: Middle East and Africa Permanent Magnet Industry Revenue Share (%), by Material Type 2024 & 2032
- Figure 74: Middle East and Africa Permanent Magnet Industry Volume Share (%), by Material Type 2024 & 2032
- Figure 75: Middle East and Africa Permanent Magnet Industry Revenue (Billion), by End-user Industry 2024 & 2032
- Figure 76: Middle East and Africa Permanent Magnet Industry Volume (K Tons), by End-user Industry 2024 & 2032
- Figure 77: Middle East and Africa Permanent Magnet Industry Revenue Share (%), by End-user Industry 2024 & 2032
- Figure 78: Middle East and Africa Permanent Magnet Industry Volume Share (%), by End-user Industry 2024 & 2032
- Figure 79: Middle East and Africa Permanent Magnet Industry Revenue (Billion), by Country 2024 & 2032
- Figure 80: Middle East and Africa Permanent Magnet Industry Volume (K Tons), by Country 2024 & 2032
- Figure 81: Middle East and Africa Permanent Magnet Industry Revenue Share (%), by Country 2024 & 2032
- Figure 82: Middle East and Africa Permanent Magnet Industry Volume Share (%), by Country 2024 & 2032
List of Tables
- Table 1: Global Permanent Magnet Industry Revenue Billion Forecast, by Region 2019 & 2032
- Table 2: Global Permanent Magnet Industry Volume K Tons Forecast, by Region 2019 & 2032
- Table 3: Global Permanent Magnet Industry Revenue Billion Forecast, by Material Type 2019 & 2032
- Table 4: Global Permanent Magnet Industry Volume K Tons Forecast, by Material Type 2019 & 2032
- Table 5: Global Permanent Magnet Industry Revenue Billion Forecast, by End-user Industry 2019 & 2032
- Table 6: Global Permanent Magnet Industry Volume K Tons Forecast, by End-user Industry 2019 & 2032
- Table 7: Global Permanent Magnet Industry Revenue Billion Forecast, by Region 2019 & 2032
- Table 8: Global Permanent Magnet Industry Volume K Tons Forecast, by Region 2019 & 2032
- Table 9: Global Permanent Magnet Industry Revenue Billion Forecast, by Country 2019 & 2032
- Table 10: Global Permanent Magnet Industry Volume K Tons Forecast, by Country 2019 & 2032
- Table 11: United States Permanent Magnet Industry Revenue (Billion) Forecast, by Application 2019 & 2032
- Table 12: United States Permanent Magnet Industry Volume (K Tons) Forecast, by Application 2019 & 2032
- Table 13: Canada Permanent Magnet Industry Revenue (Billion) Forecast, by Application 2019 & 2032
- Table 14: Canada Permanent Magnet Industry Volume (K Tons) Forecast, by Application 2019 & 2032
- Table 15: Mexico Permanent Magnet Industry Revenue (Billion) Forecast, by Application 2019 & 2032
- Table 16: Mexico Permanent Magnet Industry Volume (K Tons) Forecast, by Application 2019 & 2032
- Table 17: Global Permanent Magnet Industry Revenue Billion Forecast, by Country 2019 & 2032
- Table 18: Global Permanent Magnet Industry Volume K Tons Forecast, by Country 2019 & 2032
- Table 19: Germany Permanent Magnet Industry Revenue (Billion) Forecast, by Application 2019 & 2032
- Table 20: Germany Permanent Magnet Industry Volume (K Tons) Forecast, by Application 2019 & 2032
- Table 21: France Permanent Magnet Industry Revenue (Billion) Forecast, by Application 2019 & 2032
- Table 22: France Permanent Magnet Industry Volume (K Tons) Forecast, by Application 2019 & 2032
- Table 23: Italy Permanent Magnet Industry Revenue (Billion) Forecast, by Application 2019 & 2032
- Table 24: Italy Permanent Magnet Industry Volume (K Tons) Forecast, by Application 2019 & 2032
- Table 25: United Kingdom Permanent Magnet Industry Revenue (Billion) Forecast, by Application 2019 & 2032
- Table 26: United Kingdom Permanent Magnet Industry Volume (K Tons) Forecast, by Application 2019 & 2032
- Table 27: Netherlands Permanent Magnet Industry Revenue (Billion) Forecast, by Application 2019 & 2032
- Table 28: Netherlands Permanent Magnet Industry Volume (K Tons) Forecast, by Application 2019 & 2032
- Table 29: Rest of Europe Permanent Magnet Industry Revenue (Billion) Forecast, by Application 2019 & 2032
- Table 30: Rest of Europe Permanent Magnet Industry Volume (K Tons) Forecast, by Application 2019 & 2032
- Table 31: Global Permanent Magnet Industry Revenue Billion Forecast, by Country 2019 & 2032
- Table 32: Global Permanent Magnet Industry Volume K Tons Forecast, by Country 2019 & 2032
- Table 33: China Permanent Magnet Industry Revenue (Billion) Forecast, by Application 2019 & 2032
- Table 34: China Permanent Magnet Industry Volume (K Tons) Forecast, by Application 2019 & 2032
- Table 35: Japan Permanent Magnet Industry Revenue (Billion) Forecast, by Application 2019 & 2032
- Table 36: Japan Permanent Magnet Industry Volume (K Tons) Forecast, by Application 2019 & 2032
- Table 37: India Permanent Magnet Industry Revenue (Billion) Forecast, by Application 2019 & 2032
- Table 38: India Permanent Magnet Industry Volume (K Tons) Forecast, by Application 2019 & 2032
- Table 39: South Korea Permanent Magnet Industry Revenue (Billion) Forecast, by Application 2019 & 2032
- Table 40: South Korea Permanent Magnet Industry Volume (K Tons) Forecast, by Application 2019 & 2032
- Table 41: Taiwan Permanent Magnet Industry Revenue (Billion) Forecast, by Application 2019 & 2032
- Table 42: Taiwan Permanent Magnet Industry Volume (K Tons) Forecast, by Application 2019 & 2032
- Table 43: Australia Permanent Magnet Industry Revenue (Billion) Forecast, by Application 2019 & 2032
- Table 44: Australia Permanent Magnet Industry Volume (K Tons) Forecast, by Application 2019 & 2032
- Table 45: Rest of Asia-Pacific Permanent Magnet Industry Revenue (Billion) Forecast, by Application 2019 & 2032
- Table 46: Rest of Asia-Pacific Permanent Magnet Industry Volume (K Tons) Forecast, by Application 2019 & 2032
- Table 47: Global Permanent Magnet Industry Revenue Billion Forecast, by Country 2019 & 2032
- Table 48: Global Permanent Magnet Industry Volume K Tons Forecast, by Country 2019 & 2032
- Table 49: Brazil Permanent Magnet Industry Revenue (Billion) Forecast, by Application 2019 & 2032
- Table 50: Brazil Permanent Magnet Industry Volume (K Tons) Forecast, by Application 2019 & 2032
- Table 51: Argentina Permanent Magnet Industry Revenue (Billion) Forecast, by Application 2019 & 2032
- Table 52: Argentina Permanent Magnet Industry Volume (K Tons) Forecast, by Application 2019 & 2032
- Table 53: Rest of South America Permanent Magnet Industry Revenue (Billion) Forecast, by Application 2019 & 2032
- Table 54: Rest of South America Permanent Magnet Industry Volume (K Tons) Forecast, by Application 2019 & 2032
- Table 55: Global Permanent Magnet Industry Revenue Billion Forecast, by Country 2019 & 2032
- Table 56: Global Permanent Magnet Industry Volume K Tons Forecast, by Country 2019 & 2032
- Table 57: Middle East Permanent Magnet Industry Revenue (Billion) Forecast, by Application 2019 & 2032
- Table 58: Middle East Permanent Magnet Industry Volume (K Tons) Forecast, by Application 2019 & 2032
- Table 59: Africa Permanent Magnet Industry Revenue (Billion) Forecast, by Application 2019 & 2032
- Table 60: Africa Permanent Magnet Industry Volume (K Tons) Forecast, by Application 2019 & 2032
- Table 61: Global Permanent Magnet Industry Revenue Billion Forecast, by Material Type 2019 & 2032
- Table 62: Global Permanent Magnet Industry Volume K Tons Forecast, by Material Type 2019 & 2032
- Table 63: Global Permanent Magnet Industry Revenue Billion Forecast, by End-user Industry 2019 & 2032
- Table 64: Global Permanent Magnet Industry Volume K Tons Forecast, by End-user Industry 2019 & 2032
- Table 65: Global Permanent Magnet Industry Revenue Billion Forecast, by Country 2019 & 2032
- Table 66: Global Permanent Magnet Industry Volume K Tons Forecast, by Country 2019 & 2032
- Table 67: China Permanent Magnet Industry Revenue (Billion) Forecast, by Application 2019 & 2032
- Table 68: China Permanent Magnet Industry Volume (K Tons) Forecast, by Application 2019 & 2032
- Table 69: India Permanent Magnet Industry Revenue (Billion) Forecast, by Application 2019 & 2032
- Table 70: India Permanent Magnet Industry Volume (K Tons) Forecast, by Application 2019 & 2032
- Table 71: Japan Permanent Magnet Industry Revenue (Billion) Forecast, by Application 2019 & 2032
- Table 72: Japan Permanent Magnet Industry Volume (K Tons) Forecast, by Application 2019 & 2032
- Table 73: South Korea Permanent Magnet Industry Revenue (Billion) Forecast, by Application 2019 & 2032
- Table 74: South Korea Permanent Magnet Industry Volume (K Tons) Forecast, by Application 2019 & 2032
- Table 75: Rest of Asia Pacific Permanent Magnet Industry Revenue (Billion) Forecast, by Application 2019 & 2032
- Table 76: Rest of Asia Pacific Permanent Magnet Industry Volume (K Tons) Forecast, by Application 2019 & 2032
- Table 77: Global Permanent Magnet Industry Revenue Billion Forecast, by Material Type 2019 & 2032
- Table 78: Global Permanent Magnet Industry Volume K Tons Forecast, by Material Type 2019 & 2032
- Table 79: Global Permanent Magnet Industry Revenue Billion Forecast, by End-user Industry 2019 & 2032
- Table 80: Global Permanent Magnet Industry Volume K Tons Forecast, by End-user Industry 2019 & 2032
- Table 81: Global Permanent Magnet Industry Revenue Billion Forecast, by Country 2019 & 2032
- Table 82: Global Permanent Magnet Industry Volume K Tons Forecast, by Country 2019 & 2032
- Table 83: United States Permanent Magnet Industry Revenue (Billion) Forecast, by Application 2019 & 2032
- Table 84: United States Permanent Magnet Industry Volume (K Tons) Forecast, by Application 2019 & 2032
- Table 85: Canada Permanent Magnet Industry Revenue (Billion) Forecast, by Application 2019 & 2032
- Table 86: Canada Permanent Magnet Industry Volume (K Tons) Forecast, by Application 2019 & 2032
- Table 87: Mexico Permanent Magnet Industry Revenue (Billion) Forecast, by Application 2019 & 2032
- Table 88: Mexico Permanent Magnet Industry Volume (K Tons) Forecast, by Application 2019 & 2032
- Table 89: Global Permanent Magnet Industry Revenue Billion Forecast, by Material Type 2019 & 2032
- Table 90: Global Permanent Magnet Industry Volume K Tons Forecast, by Material Type 2019 & 2032
- Table 91: Global Permanent Magnet Industry Revenue Billion Forecast, by End-user Industry 2019 & 2032
- Table 92: Global Permanent Magnet Industry Volume K Tons Forecast, by End-user Industry 2019 & 2032
- Table 93: Global Permanent Magnet Industry Revenue Billion Forecast, by Country 2019 & 2032
- Table 94: Global Permanent Magnet Industry Volume K Tons Forecast, by Country 2019 & 2032
- Table 95: Germany Permanent Magnet Industry Revenue (Billion) Forecast, by Application 2019 & 2032
- Table 96: Germany Permanent Magnet Industry Volume (K Tons) Forecast, by Application 2019 & 2032
- Table 97: United Kingdom Permanent Magnet Industry Revenue (Billion) Forecast, by Application 2019 & 2032
- Table 98: United Kingdom Permanent Magnet Industry Volume (K Tons) Forecast, by Application 2019 & 2032
- Table 99: France Permanent Magnet Industry Revenue (Billion) Forecast, by Application 2019 & 2032
- Table 100: France Permanent Magnet Industry Volume (K Tons) Forecast, by Application 2019 & 2032
- Table 101: Italy Permanent Magnet Industry Revenue (Billion) Forecast, by Application 2019 & 2032
- Table 102: Italy Permanent Magnet Industry Volume (K Tons) Forecast, by Application 2019 & 2032
- Table 103: Rest of Europe Permanent Magnet Industry Revenue (Billion) Forecast, by Application 2019 & 2032
- Table 104: Rest of Europe Permanent Magnet Industry Volume (K Tons) Forecast, by Application 2019 & 2032
- Table 105: Global Permanent Magnet Industry Revenue Billion Forecast, by Material Type 2019 & 2032
- Table 106: Global Permanent Magnet Industry Volume K Tons Forecast, by Material Type 2019 & 2032
- Table 107: Global Permanent Magnet Industry Revenue Billion Forecast, by End-user Industry 2019 & 2032
- Table 108: Global Permanent Magnet Industry Volume K Tons Forecast, by End-user Industry 2019 & 2032
- Table 109: Global Permanent Magnet Industry Revenue Billion Forecast, by Country 2019 & 2032
- Table 110: Global Permanent Magnet Industry Volume K Tons Forecast, by Country 2019 & 2032
- Table 111: Brazil Permanent Magnet Industry Revenue (Billion) Forecast, by Application 2019 & 2032
- Table 112: Brazil Permanent Magnet Industry Volume (K Tons) Forecast, by Application 2019 & 2032
- Table 113: Argentina Permanent Magnet Industry Revenue (Billion) Forecast, by Application 2019 & 2032
- Table 114: Argentina Permanent Magnet Industry Volume (K Tons) Forecast, by Application 2019 & 2032
- Table 115: Rest of South America Permanent Magnet Industry Revenue (Billion) Forecast, by Application 2019 & 2032
- Table 116: Rest of South America Permanent Magnet Industry Volume (K Tons) Forecast, by Application 2019 & 2032
- Table 117: Global Permanent Magnet Industry Revenue Billion Forecast, by Material Type 2019 & 2032
- Table 118: Global Permanent Magnet Industry Volume K Tons Forecast, by Material Type 2019 & 2032
- Table 119: Global Permanent Magnet Industry Revenue Billion Forecast, by End-user Industry 2019 & 2032
- Table 120: Global Permanent Magnet Industry Volume K Tons Forecast, by End-user Industry 2019 & 2032
- Table 121: Global Permanent Magnet Industry Revenue Billion Forecast, by Country 2019 & 2032
- Table 122: Global Permanent Magnet Industry Volume K Tons Forecast, by Country 2019 & 2032
- Table 123: Saudi Arabia Permanent Magnet Industry Revenue (Billion) Forecast, by Application 2019 & 2032
- Table 124: Saudi Arabia Permanent Magnet Industry Volume (K Tons) Forecast, by Application 2019 & 2032
- Table 125: South Africa Permanent Magnet Industry Revenue (Billion) Forecast, by Application 2019 & 2032
- Table 126: South Africa Permanent Magnet Industry Volume (K Tons) Forecast, by Application 2019 & 2032
- Table 127: Rest of Middle East and Africa Permanent Magnet Industry Revenue (Billion) Forecast, by Application 2019 & 2032
- Table 128: Rest of Middle East and Africa Permanent Magnet Industry Volume (K Tons) Forecast, by Application 2019 & 2032
Frequently Asked Questions
1. What is the projected Compound Annual Growth Rate (CAGR) of the Permanent Magnet Industry?
The projected CAGR is approximately 8.7%.
2. Which companies are prominent players in the Permanent Magnet Industry?
Key companies in the market include Anhui Earth Bear New Materials Co Ltd, Lynas Rare Earths Ltd, TDK Corporation, Goudsmit Magnetics, Daido Steel Co Ltd, Galaxymagnets, Hitachi Metals Ltd, Arnold Magnetic Technologies, Shin-Etsu Chemical Co Ltd, GKN Powder Metallurgy.
3. What are the main segments of the Permanent Magnet Industry?
The market segments include Material Type, End-user Industry.
4. Can you provide details about the market size?
The market size is estimated to be USD 22.1 Billion as of 2022.
5. What are some drivers contributing to market growth?
Increasing Electro-mechanical Applications; Other Drivers.
6. What are the notable trends driving market growth?
Growing Demand from Electronics Industry.
7. Are there any restraints impacting market growth?
Competition from Substitutes; Other Restraints.
8. Can you provide examples of recent developments in the market?
September 2022: Solvay announced plans to expand its rare earths operations in La Rochelle, France to enter the value chain for rare earths permanent magnets in Europe and serve customers in the wind power, electric vehicles, and electronics markets.
9. What pricing options are available for accessing the report?
Pricing options include single-user, multi-user, and enterprise licenses priced at USD 4750, USD 5250, and USD 8750 respectively.
10. Is the market size provided in terms of value or volume?
The market size is provided in terms of value, measured in Billion and volume, measured in K Tons.
11. Are there any specific market keywords associated with the report?
Yes, the market keyword associated with the report is "Permanent Magnet Industry," which aids in identifying and referencing the specific market segment covered.
12. How do I determine which pricing option suits my needs best?
The pricing options vary based on user requirements and access needs. Individual users may opt for single-user licenses, while businesses requiring broader access may choose multi-user or enterprise licenses for cost-effective access to the report.
13. Are there any additional resources or data provided in the Permanent Magnet Industry report?
While the report offers comprehensive insights, it's advisable to review the specific contents or supplementary materials provided to ascertain if additional resources or data are available.
14. How can I stay updated on further developments or reports in the Permanent Magnet Industry?
To stay informed about further developments, trends, and reports in the Permanent Magnet Industry, consider subscribing to industry newsletters, following relevant companies and organizations, or regularly checking reputable industry news sources and publications.
Methodology
Step 1 - Identification of Relevant Samples Size from Population Database


Step 2 - Approaches for Defining Global Market Size (Value, Volume* & Price*)

Note*: In applicable scenarios
Step 3 - Data Sources
Primary Research
- Web Analytics
- Survey Reports
- Research Institute
- Latest Research Reports
- Opinion Leaders
Secondary Research
- Annual Reports
- White Paper
- Latest Press Release
- Industry Association
- Paid Database
- Investor Presentations

Step 4 - Data Triangulation
Involves using different sources of information in order to increase the validity of a study
These sources are likely to be stakeholders in a program - participants, other researchers, program staff, other community members, and so on.
Then we put all data in single framework & apply various statistical tools to find out the dynamic on the market.
During the analysis stage, feedback from the stakeholder groups would be compared to determine areas of agreement as well as areas of divergence
