

Key Insights
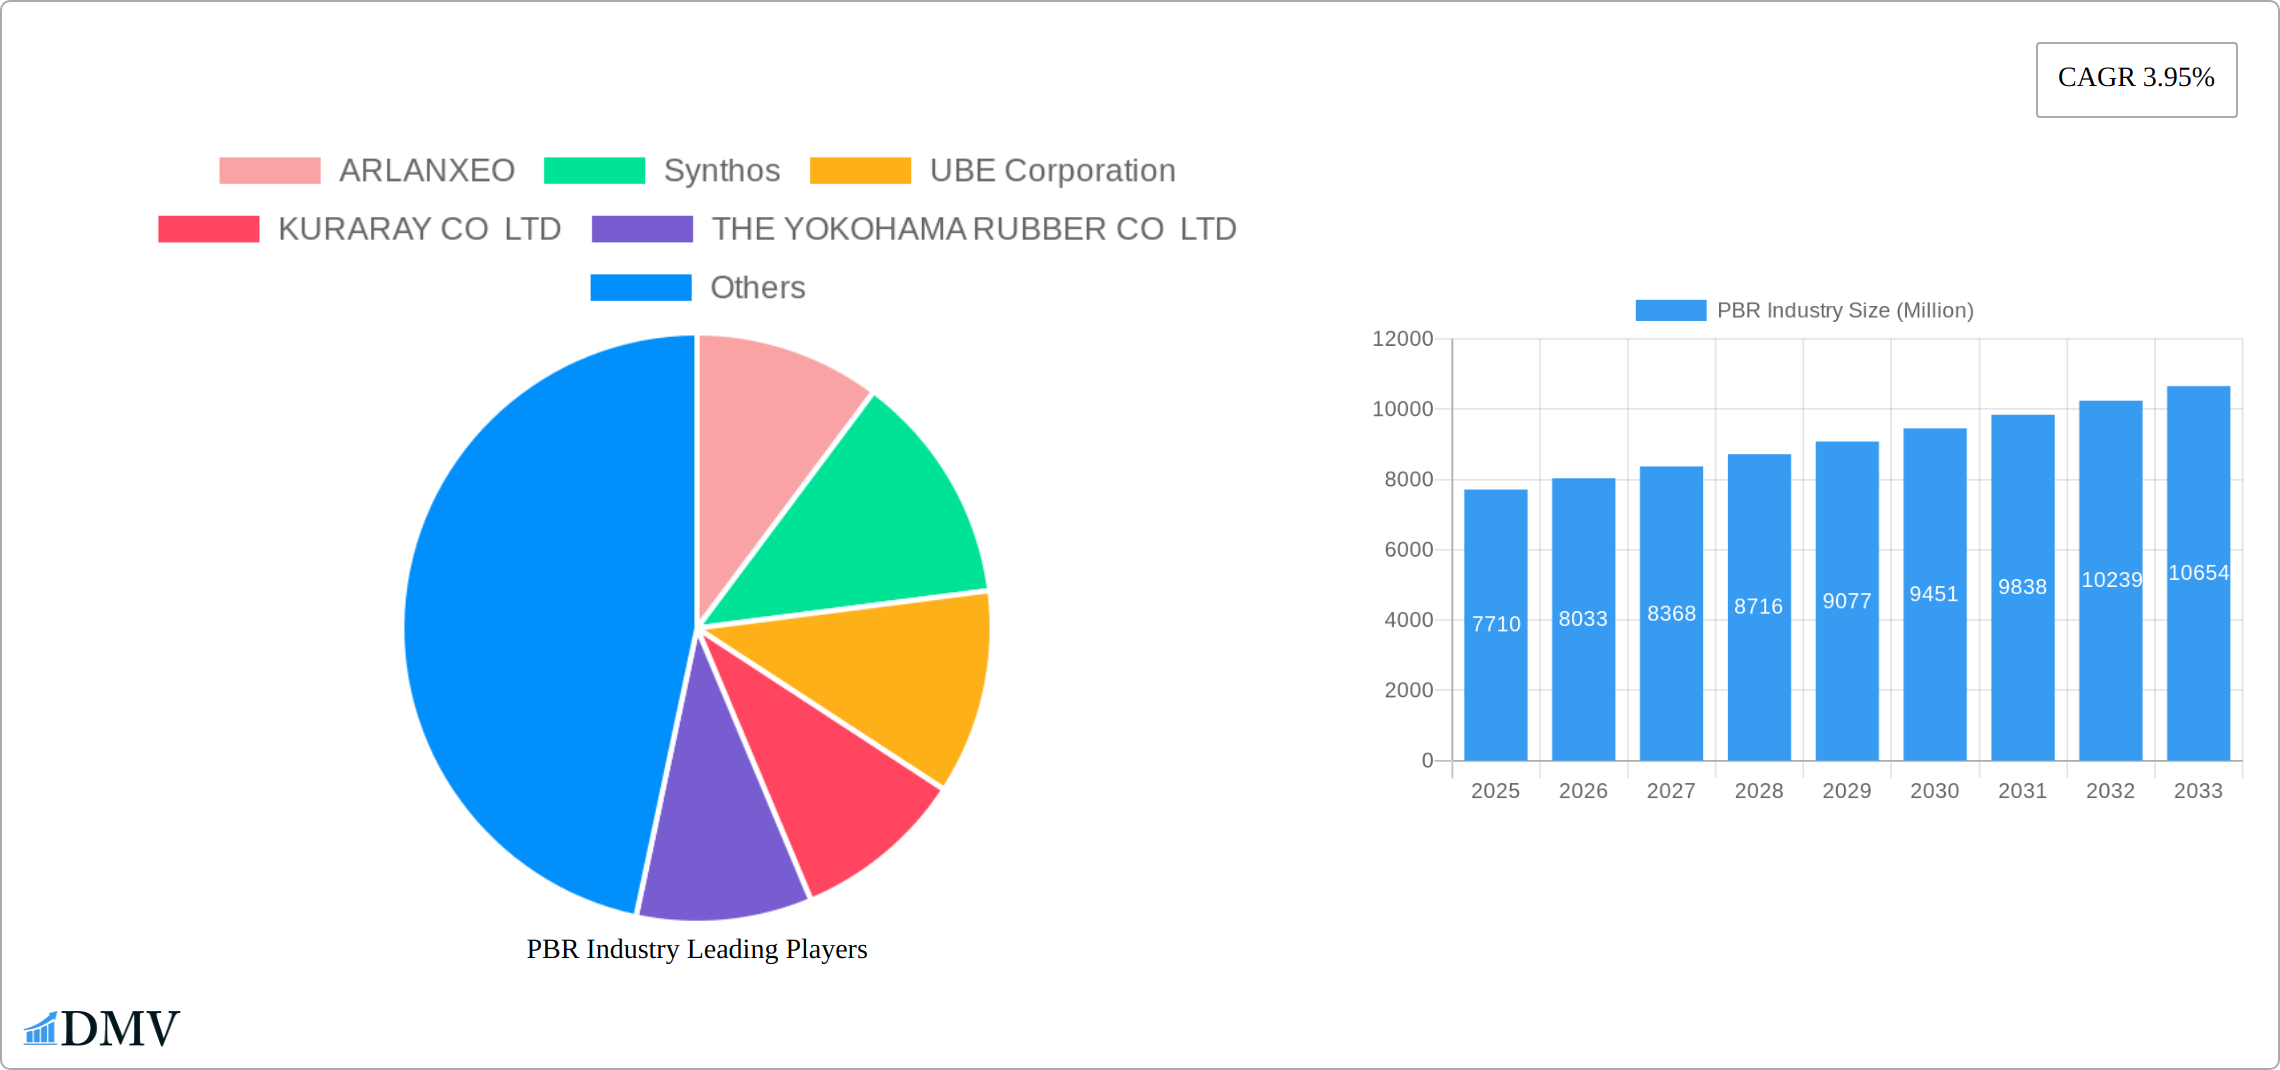
The Polybutadiene Rubber (PBR) market, valued at $7.71 billion in 2025, is projected to experience steady growth, driven primarily by the expanding tire manufacturing industry and increasing demand for high-performance materials in footwear and sports accessories. A Compound Annual Growth Rate (CAGR) of 3.95% from 2025 to 2033 indicates a robust market outlook. Key growth drivers include the rising global vehicle production, particularly in developing economies, fueling demand for tires. Furthermore, the increasing popularity of athletic and outdoor activities is boosting the demand for PBR in sports equipment manufacturing. Technological advancements in PBR synthesis, resulting in improved material properties like enhanced durability and elasticity, are also contributing to market expansion. However, fluctuating raw material prices and environmental concerns related to rubber production present potential restraints. The market is segmented by application (tire manufacturing, footwear, sports accessories, and other applications such as chemicals and polymer modification) and geographically spans across North America, Europe, Asia Pacific, South America, and the Middle East and Africa. Competition is intense, with key players including ARLANXEO, Synthos, UBE Corporation, and others, vying for market share through product innovation and strategic partnerships. The Asia-Pacific region, particularly China and India, is expected to be a significant growth driver due to the expanding automotive and manufacturing sectors. The European market is expected to maintain a consistent contribution, leveraging its well-established automotive and sporting goods industries.
The projected growth trajectory necessitates ongoing innovation within the PBR sector to cater to the evolving needs of end-use industries. Sustainable production methods, addressing environmental concerns, will play a crucial role in shaping the market landscape in the years ahead. Focus on developing high-performance, specialized PBR grades to meet specific industry requirements will be essential for sustained competitiveness. The competitive landscape will witness strategic mergers and acquisitions, capacity expansions, and technological collaborations as companies seek to consolidate market share and enhance their technological capabilities. Continuous monitoring of raw material costs and adaptation to changing market dynamics will be crucial for businesses to navigate effectively within this dynamic and growing sector. The anticipated growth signifies significant opportunities for players committed to innovation, sustainability, and effective market penetration strategies.
PBR Industry Market Composition & Trends
The Polybutadiene Rubber (PBR) industry is witnessing significant shifts in market composition and trends. Market concentration within the PBR sector remains moderate, with major players like ARLANXEO, Synthos, and UBE Corporation holding substantial market shares. In 2025, the top five companies are estimated to control around 55% of the global market, reflecting a competitive yet consolidated landscape. Innovation catalysts, such as the development of high-performance PBR grades, are driving growth. For instance, advancements in polymerization techniques have led to improved product durability and efficiency, which are pivotal for applications in tire manufacturing and other sectors.
Regulatory landscapes play a crucial role in shaping the PBR market, with stringent environmental regulations pushing companies towards more sustainable production methods. Substitute products, like synthetic rubbers and natural rubber, pose a constant threat to PBR's market share, yet PBR's superior properties in specific applications maintain its demand. End-user profiles indicate a growing preference for PBR in tire manufacturing due to its excellent wear resistance and low rolling resistance, which are essential for fuel efficiency.
Mergers and acquisitions (M&A) activities have been notable, with deal values reaching over 200 Million USD in the last five years. These M&As are aimed at expanding production capacities and enhancing technological capabilities. The market dynamics are further influenced by economic factors, including raw material costs and global trade policies, which impact the overall profitability and strategic decisions of PBR producers.
- Market share distribution in 2025: Top 5 companies - 55%
- M&A deal values in the last five years: Over 200 Million USD
- Key innovation areas: High-performance PBR grades, sustainable production methods

PBR Industry Industry Evolution
The evolution of the PBR industry from 2019 to 2033 has been marked by robust market growth trajectories, spurred by technological advancements and shifting consumer demands. The global PBR market is projected to grow at a compound annual growth rate (CAGR) of 4.5% from 2025 to 2033, driven primarily by the increasing demand from the tire manufacturing sector. Technological advancements, such as the development of neodymium-catalyzed PBR, have significantly enhanced product performance, offering better abrasion resistance and elasticity. These innovations have led to an adoption rate of over 30% in high-end tire applications by 2025.
Consumer demands have shifted towards more sustainable and high-performance materials, influencing the PBR industry to invest in eco-friendly production processes. The introduction of bio-based PBR, although in its nascent stage, is expected to gain traction, with an estimated market penetration of 5% by 2033. The industry has also seen a rise in the use of PBR in footwear and sports accessories, where its unique properties like flexibility and impact resistance are highly valued.
The historical period from 2019 to 2024 showed a steady growth rate of 3.2%, influenced by global economic recovery and increased automotive production. The forecast period from 2025 to 2033 is anticipated to witness a more accelerated growth, fueled by emerging markets and technological breakthroughs. The PBR industry's evolution is a testament to its adaptability and responsiveness to market needs, ensuring its relevance and growth in the global materials landscape.
Leading Regions, Countries, or Segments in PBR Industry
The Asia-Pacific region stands out as the dominant force in the PBR industry, driven by the robust demand from tire manufacturing and other applications. Countries like China and India are at the forefront, with China holding the largest market share due to its extensive automotive industry and manufacturing capabilities. The dominance of the Asia-Pacific region can be attributed to several key drivers:
- Investment trends: Significant investments in expanding production capacities, with over 1 Billion USD invested in new PBR plants in the region.
- Regulatory support: Government policies promoting the automotive and manufacturing sectors, including incentives for eco-friendly materials.
- Growing consumer base: Rising demand for vehicles and consumer goods, leading to increased PBR consumption.
In-depth analysis reveals that the tire manufacturing segment is the primary driver of PBR demand in the Asia-Pacific region. The region's tire production capacity is expected to reach 300 Million units annually by 2033, with PBR being a critical component due to its performance benefits. The footwear and sports accessories segments are also witnessing growth, albeit at a slower pace, with PBR's unique properties catering to the needs of these industries.
The dominance of the Asia-Pacific region is further reinforced by the presence of major PBR producers and their strategic expansions. For instance, companies like Reliance Industries Limited and Indian Oil Corporation Ltd are investing heavily in new PBR facilities to meet the regional demand. The region's economic growth, coupled with technological advancements and supportive government policies, positions it as a leader in the global PBR market.
PBR Industry Product Innovations
Product innovations in the PBR industry are centered around enhancing performance and sustainability. The development of neodymium-catalyzed PBR has revolutionized the market, offering superior abrasion resistance and elasticity, which are crucial for high-performance tires. Additionally, the introduction of bio-based PBR marks a significant step towards sustainability, aligning with global environmental goals. These innovations not only improve product performance but also cater to the growing demand for eco-friendly materials, positioning PBR as a versatile and future-ready material.
Propelling Factors for PBR Industry Growth
Several key factors are propelling the growth of the PBR industry. Technological advancements, such as the development of neodymium-catalyzed PBR, are enhancing product performance and expanding application areas. Economic factors, including the growing automotive industry, particularly in emerging markets like China and India, are driving demand for high-quality tires and other PBR-based products. Regulatory influences, such as government incentives for eco-friendly materials, are encouraging investments in sustainable PBR production, further fueling industry growth.
Obstacles in the PBR Industry Market
The PBR industry faces several obstacles that could hinder its growth. Regulatory challenges, such as stringent environmental regulations, increase production costs and necessitate significant investments in sustainable practices. Supply chain disruptions, particularly in raw material sourcing, can lead to production delays and increased costs, impacting overall market dynamics. Competitive pressures from substitute products, like natural rubber and other synthetic rubbers, pose a threat to PBR's market share, requiring continuous innovation and cost management to maintain competitiveness.
Future Opportunities in PBR Industry
The PBR industry is poised to capitalize on several emerging opportunities. New markets in regions like Africa and Southeast Asia offer untapped potential for PBR applications, driven by increasing industrialization and consumer demand. Technological advancements, such as the development of bio-based PBR, present opportunities for sustainable growth and market differentiation. Shifting consumer trends towards eco-friendly and high-performance materials are likely to boost demand for innovative PBR products, opening new avenues for industry expansion.
Major Players in the PBR Industry Ecosystem
- ARLANXEO
- Synthos
- UBE Corporation
- KURARAY CO LTD
- THE YOKOHAMA RUBBER CO LTD
- ENEOS Materials Corporation
- Reliance Industries Limited
- ZEON CORPORATION
- KUMHO PETROCHEMICAL
- LANXESS
- SABIC
- Trinseo
- LG Chem
- Versalis S p A
- Indian Oil Corporation Ltd
- SIBUR International GmbH
Key Developments in PBR Industry Industry
- February 2023: Arlanxeo revealed the commencement of a 65 ktpa polybutadiene rubber production plant in southern Brazil. This new facility, situated in the Triunfo petrochemical complex in Rio Grande do Sul, underlines the company's dedication to strengthening its presence in Latin America. The development is expected to boost Arlanxeo's market share and enhance its supply chain efficiency in the region.
- March 2022: Indian Oil Corporation Limited unveiled its plans to construct a 60 ktpa polybutadiene rubber (PBR) plant at the existing naphtha cracker complex in Panipat. With an investment of INR 14.6 billion (USD 169 million), the company aims to source the required feedstock, butadiene, from the 138 ktpa butadiene extraction unit (BDEU) at the Panipat complex for PBR production. This strategic move signifies Indian Oil Corporation Limited's commitment to expanding its capabilities in the petrochemical sector and meeting the growing demand for PBR in India.
Strategic PBR Industry Market Forecast
The strategic forecast for the PBR industry indicates a promising future, driven by several growth catalysts. The increasing demand from the tire manufacturing sector, coupled with technological advancements like neodymium-catalyzed PBR, is expected to propel market growth. Emerging markets in regions like Africa and Southeast Asia offer significant opportunities for expansion, while the shift towards sustainable materials opens new avenues for innovation. The PBR industry's ability to adapt to changing market dynamics and consumer preferences positions it well for sustained growth and market potential through the forecast period of 2025 to 2033.
PBR Industry Segmentation
-
1. Application
- 1.1. Tire Manufacturing
- 1.2. Footwear
- 1.3. Sports Accessories
- 1.4. Other Ap
PBR Industry Segmentation By Geography
-
1. Asia Pacific
- 1.1. China
- 1.2. India
- 1.3. Japan
- 1.4. South Korea
- 1.5. Indonesia
- 1.6. Malaysia
- 1.7. Thailand
- 1.8. Vietnam
- 1.9. Rest of Asia Pacific
-
2. North America
- 2.1. United States
- 2.2. Canada
- 2.3. Mexico
-
3. Europe
- 3.1. Germany
- 3.2. United Kingdom
- 3.3. Italy
- 3.4. France
- 3.5. Spain
- 3.6. Russia
- 3.7. NORDIC Countries
- 3.8. Turkey
- 3.9. Rest of Europe
-
4. South America
- 4.1. Brazil
- 4.2. Argentina
- 4.3. Colombia
- 4.4. Rest of South America
-
5. Middle East and Africa
- 5.1. Saudi Arabia
- 5.2. South Africa
- 5.3. Qatar
- 5.4. UAE
- 5.5. Nigeria
- 5.6. Egypt
- 5.7. Rest of Middle East and Africa

PBR Industry REPORT HIGHLIGHTS
| Aspects | Details |
|---|---|
| Study Period | 2019-2033 |
| Base Year | 2024 |
| Estimated Year | 2025 |
| Forecast Period | 2025-2033 |
| Historical Period | 2019-2024 |
| Growth Rate | CAGR of 3.95% from 2019-2033 |
| Segmentation |
|
Table of Contents
- 1. Introduction
- 1.1. Research Scope
- 1.2. Market Segmentation
- 1.3. Research Methodology
- 1.4. Definitions and Assumptions
- 2. Executive Summary
- 2.1. Introduction
- 3. Market Dynamics
- 3.1. Introduction
- 3.2. Market Drivers
- 3.2.1. Increasing Demand From the Automobile Industry; Growth in the Synthetic Rubber Industry; Other Drivers
- 3.3. Market Restrains
- 3.3.1. Stringent Enviornmental Regulations; Health Concerns Regarding Exposure to Polybutadiene
- 3.4. Market Trends
- 3.4.1. Tire Manufacturing Application Segment to Dominate The Market
- 4. Market Factor Analysis
- 4.1. Porters Five Forces
- 4.2. Supply/Value Chain
- 4.3. PESTEL analysis
- 4.4. Market Entropy
- 4.5. Patent/Trademark Analysis
- 5. Global PBR Industry Analysis, Insights and Forecast, 2019-2031
- 5.1. Market Analysis, Insights and Forecast - by Application
- 5.1.1. Tire Manufacturing
- 5.1.2. Footwear
- 5.1.3. Sports Accessories
- 5.1.4. Other Ap
- 5.2. Market Analysis, Insights and Forecast - by Region
- 5.2.1. Asia Pacific
- 5.2.2. North America
- 5.2.3. Europe
- 5.2.4. South America
- 5.2.5. Middle East and Africa
- 5.1. Market Analysis, Insights and Forecast - by Application
- 6. Asia Pacific PBR Industry Analysis, Insights and Forecast, 2019-2031
- 6.1. Market Analysis, Insights and Forecast - by Application
- 6.1.1. Tire Manufacturing
- 6.1.2. Footwear
- 6.1.3. Sports Accessories
- 6.1.4. Other Ap
- 6.1. Market Analysis, Insights and Forecast - by Application
- 7. North America PBR Industry Analysis, Insights and Forecast, 2019-2031
- 7.1. Market Analysis, Insights and Forecast - by Application
- 7.1.1. Tire Manufacturing
- 7.1.2. Footwear
- 7.1.3. Sports Accessories
- 7.1.4. Other Ap
- 7.1. Market Analysis, Insights and Forecast - by Application
- 8. Europe PBR Industry Analysis, Insights and Forecast, 2019-2031
- 8.1. Market Analysis, Insights and Forecast - by Application
- 8.1.1. Tire Manufacturing
- 8.1.2. Footwear
- 8.1.3. Sports Accessories
- 8.1.4. Other Ap
- 8.1. Market Analysis, Insights and Forecast - by Application
- 9. South America PBR Industry Analysis, Insights and Forecast, 2019-2031
- 9.1. Market Analysis, Insights and Forecast - by Application
- 9.1.1. Tire Manufacturing
- 9.1.2. Footwear
- 9.1.3. Sports Accessories
- 9.1.4. Other Ap
- 9.1. Market Analysis, Insights and Forecast - by Application
- 10. Middle East and Africa PBR Industry Analysis, Insights and Forecast, 2019-2031
- 10.1. Market Analysis, Insights and Forecast - by Application
- 10.1.1. Tire Manufacturing
- 10.1.2. Footwear
- 10.1.3. Sports Accessories
- 10.1.4. Other Ap
- 10.1. Market Analysis, Insights and Forecast - by Application
- 11. Europe PBR Industry Analysis, Insights and Forecast, 2019-2031
- 11.1. Market Analysis, Insights and Forecast - By Country/Sub-region
- 11.1.1 Germany
- 11.1.2 United Kingdom
- 11.1.3 France
- 11.1.4 Spain
- 11.1.5 Italy
- 11.1.6 Spain
- 11.1.7 Belgium
- 11.1.8 Netherland
- 11.1.9 Nordics
- 11.1.10 Rest of Europe
- 12. Asia Pacific PBR Industry Analysis, Insights and Forecast, 2019-2031
- 12.1. Market Analysis, Insights and Forecast - By Country/Sub-region
- 12.1.1 China
- 12.1.2 Japan
- 12.1.3 India
- 12.1.4 South Korea
- 12.1.5 Southeast Asia
- 12.1.6 Australia
- 12.1.7 Indonesia
- 12.1.8 Phillipes
- 12.1.9 Singapore
- 12.1.10 Thailandc
- 12.1.11 Rest of Asia Pacific
- 13. South America PBR Industry Analysis, Insights and Forecast, 2019-2031
- 13.1. Market Analysis, Insights and Forecast - By Country/Sub-region
- 13.1.1 Brazil
- 13.1.2 Argentina
- 13.1.3 Peru
- 13.1.4 Chile
- 13.1.5 Colombia
- 13.1.6 Ecuador
- 13.1.7 Venezuela
- 13.1.8 Rest of South America
- 14. North America PBR Industry Analysis, Insights and Forecast, 2019-2031
- 14.1. Market Analysis, Insights and Forecast - By Country/Sub-region
- 14.1.1 United States
- 14.1.2 Canada
- 14.1.3 Mexico
- 15. MEA PBR Industry Analysis, Insights and Forecast, 2019-2031
- 15.1. Market Analysis, Insights and Forecast - By Country/Sub-region
- 15.1.1 United Arab Emirates
- 15.1.2 Saudi Arabia
- 15.1.3 South Africa
- 15.1.4 Rest of Middle East and Africa
- 16. Competitive Analysis
- 16.1. Global Market Share Analysis 2024
- 16.2. Company Profiles
- 16.2.1 ARLANXEO
- 16.2.1.1. Overview
- 16.2.1.2. Products
- 16.2.1.3. SWOT Analysis
- 16.2.1.4. Recent Developments
- 16.2.1.5. Financials (Based on Availability)
- 16.2.2 Synthos
- 16.2.2.1. Overview
- 16.2.2.2. Products
- 16.2.2.3. SWOT Analysis
- 16.2.2.4. Recent Developments
- 16.2.2.5. Financials (Based on Availability)
- 16.2.3 UBE Corporation
- 16.2.3.1. Overview
- 16.2.3.2. Products
- 16.2.3.3. SWOT Analysis
- 16.2.3.4. Recent Developments
- 16.2.3.5. Financials (Based on Availability)
- 16.2.4 KURARAY CO LTD
- 16.2.4.1. Overview
- 16.2.4.2. Products
- 16.2.4.3. SWOT Analysis
- 16.2.4.4. Recent Developments
- 16.2.4.5. Financials (Based on Availability)
- 16.2.5 THE YOKOHAMA RUBBER CO LTD
- 16.2.5.1. Overview
- 16.2.5.2. Products
- 16.2.5.3. SWOT Analysis
- 16.2.5.4. Recent Developments
- 16.2.5.5. Financials (Based on Availability)
- 16.2.6 ENEOS Materials Corporation
- 16.2.6.1. Overview
- 16.2.6.2. Products
- 16.2.6.3. SWOT Analysis
- 16.2.6.4. Recent Developments
- 16.2.6.5. Financials (Based on Availability)
- 16.2.7 Reliance Industries Limited
- 16.2.7.1. Overview
- 16.2.7.2. Products
- 16.2.7.3. SWOT Analysis
- 16.2.7.4. Recent Developments
- 16.2.7.5. Financials (Based on Availability)
- 16.2.8 ZEON CORPORATION
- 16.2.8.1. Overview
- 16.2.8.2. Products
- 16.2.8.3. SWOT Analysis
- 16.2.8.4. Recent Developments
- 16.2.8.5. Financials (Based on Availability)
- 16.2.9 KUMHO PETROCHEMICAL
- 16.2.9.1. Overview
- 16.2.9.2. Products
- 16.2.9.3. SWOT Analysis
- 16.2.9.4. Recent Developments
- 16.2.9.5. Financials (Based on Availability)
- 16.2.10 LANXESS
- 16.2.10.1. Overview
- 16.2.10.2. Products
- 16.2.10.3. SWOT Analysis
- 16.2.10.4. Recent Developments
- 16.2.10.5. Financials (Based on Availability)
- 16.2.11 SABIC
- 16.2.11.1. Overview
- 16.2.11.2. Products
- 16.2.11.3. SWOT Analysis
- 16.2.11.4. Recent Developments
- 16.2.11.5. Financials (Based on Availability)
- 16.2.12 Trinseo
- 16.2.12.1. Overview
- 16.2.12.2. Products
- 16.2.12.3. SWOT Analysis
- 16.2.12.4. Recent Developments
- 16.2.12.5. Financials (Based on Availability)
- 16.2.13 LG Chem
- 16.2.13.1. Overview
- 16.2.13.2. Products
- 16.2.13.3. SWOT Analysis
- 16.2.13.4. Recent Developments
- 16.2.13.5. Financials (Based on Availability)
- 16.2.14 Versalis S p A *List Not Exhaustive
- 16.2.14.1. Overview
- 16.2.14.2. Products
- 16.2.14.3. SWOT Analysis
- 16.2.14.4. Recent Developments
- 16.2.14.5. Financials (Based on Availability)
- 16.2.15 Indian Oil Corporation Ltd
- 16.2.15.1. Overview
- 16.2.15.2. Products
- 16.2.15.3. SWOT Analysis
- 16.2.15.4. Recent Developments
- 16.2.15.5. Financials (Based on Availability)
- 16.2.16 SIBUR International GmbH
- 16.2.16.1. Overview
- 16.2.16.2. Products
- 16.2.16.3. SWOT Analysis
- 16.2.16.4. Recent Developments
- 16.2.16.5. Financials (Based on Availability)
- 16.2.1 ARLANXEO
List of Figures
- Figure 1: Global PBR Industry Revenue Breakdown (Million, %) by Region 2024 & 2032
- Figure 2: Europe PBR Industry Revenue (Million), by Country 2024 & 2032
- Figure 3: Europe PBR Industry Revenue Share (%), by Country 2024 & 2032
- Figure 4: Asia Pacific PBR Industry Revenue (Million), by Country 2024 & 2032
- Figure 5: Asia Pacific PBR Industry Revenue Share (%), by Country 2024 & 2032
- Figure 6: South America PBR Industry Revenue (Million), by Country 2024 & 2032
- Figure 7: South America PBR Industry Revenue Share (%), by Country 2024 & 2032
- Figure 8: North America PBR Industry Revenue (Million), by Country 2024 & 2032
- Figure 9: North America PBR Industry Revenue Share (%), by Country 2024 & 2032
- Figure 10: MEA PBR Industry Revenue (Million), by Country 2024 & 2032
- Figure 11: MEA PBR Industry Revenue Share (%), by Country 2024 & 2032
- Figure 12: Asia Pacific PBR Industry Revenue (Million), by Application 2024 & 2032
- Figure 13: Asia Pacific PBR Industry Revenue Share (%), by Application 2024 & 2032
- Figure 14: Asia Pacific PBR Industry Revenue (Million), by Country 2024 & 2032
- Figure 15: Asia Pacific PBR Industry Revenue Share (%), by Country 2024 & 2032
- Figure 16: North America PBR Industry Revenue (Million), by Application 2024 & 2032
- Figure 17: North America PBR Industry Revenue Share (%), by Application 2024 & 2032
- Figure 18: North America PBR Industry Revenue (Million), by Country 2024 & 2032
- Figure 19: North America PBR Industry Revenue Share (%), by Country 2024 & 2032
- Figure 20: Europe PBR Industry Revenue (Million), by Application 2024 & 2032
- Figure 21: Europe PBR Industry Revenue Share (%), by Application 2024 & 2032
- Figure 22: Europe PBR Industry Revenue (Million), by Country 2024 & 2032
- Figure 23: Europe PBR Industry Revenue Share (%), by Country 2024 & 2032
- Figure 24: South America PBR Industry Revenue (Million), by Application 2024 & 2032
- Figure 25: South America PBR Industry Revenue Share (%), by Application 2024 & 2032
- Figure 26: South America PBR Industry Revenue (Million), by Country 2024 & 2032
- Figure 27: South America PBR Industry Revenue Share (%), by Country 2024 & 2032
- Figure 28: Middle East and Africa PBR Industry Revenue (Million), by Application 2024 & 2032
- Figure 29: Middle East and Africa PBR Industry Revenue Share (%), by Application 2024 & 2032
- Figure 30: Middle East and Africa PBR Industry Revenue (Million), by Country 2024 & 2032
- Figure 31: Middle East and Africa PBR Industry Revenue Share (%), by Country 2024 & 2032
List of Tables
- Table 1: Global PBR Industry Revenue Million Forecast, by Region 2019 & 2032
- Table 2: Global PBR Industry Revenue Million Forecast, by Application 2019 & 2032
- Table 3: Global PBR Industry Revenue Million Forecast, by Region 2019 & 2032
- Table 4: Global PBR Industry Revenue Million Forecast, by Country 2019 & 2032
- Table 5: Germany PBR Industry Revenue (Million) Forecast, by Application 2019 & 2032
- Table 6: United Kingdom PBR Industry Revenue (Million) Forecast, by Application 2019 & 2032
- Table 7: France PBR Industry Revenue (Million) Forecast, by Application 2019 & 2032
- Table 8: Spain PBR Industry Revenue (Million) Forecast, by Application 2019 & 2032
- Table 9: Italy PBR Industry Revenue (Million) Forecast, by Application 2019 & 2032
- Table 10: Spain PBR Industry Revenue (Million) Forecast, by Application 2019 & 2032
- Table 11: Belgium PBR Industry Revenue (Million) Forecast, by Application 2019 & 2032
- Table 12: Netherland PBR Industry Revenue (Million) Forecast, by Application 2019 & 2032
- Table 13: Nordics PBR Industry Revenue (Million) Forecast, by Application 2019 & 2032
- Table 14: Rest of Europe PBR Industry Revenue (Million) Forecast, by Application 2019 & 2032
- Table 15: Global PBR Industry Revenue Million Forecast, by Country 2019 & 2032
- Table 16: China PBR Industry Revenue (Million) Forecast, by Application 2019 & 2032
- Table 17: Japan PBR Industry Revenue (Million) Forecast, by Application 2019 & 2032
- Table 18: India PBR Industry Revenue (Million) Forecast, by Application 2019 & 2032
- Table 19: South Korea PBR Industry Revenue (Million) Forecast, by Application 2019 & 2032
- Table 20: Southeast Asia PBR Industry Revenue (Million) Forecast, by Application 2019 & 2032
- Table 21: Australia PBR Industry Revenue (Million) Forecast, by Application 2019 & 2032
- Table 22: Indonesia PBR Industry Revenue (Million) Forecast, by Application 2019 & 2032
- Table 23: Phillipes PBR Industry Revenue (Million) Forecast, by Application 2019 & 2032
- Table 24: Singapore PBR Industry Revenue (Million) Forecast, by Application 2019 & 2032
- Table 25: Thailandc PBR Industry Revenue (Million) Forecast, by Application 2019 & 2032
- Table 26: Rest of Asia Pacific PBR Industry Revenue (Million) Forecast, by Application 2019 & 2032
- Table 27: Global PBR Industry Revenue Million Forecast, by Country 2019 & 2032
- Table 28: Brazil PBR Industry Revenue (Million) Forecast, by Application 2019 & 2032
- Table 29: Argentina PBR Industry Revenue (Million) Forecast, by Application 2019 & 2032
- Table 30: Peru PBR Industry Revenue (Million) Forecast, by Application 2019 & 2032
- Table 31: Chile PBR Industry Revenue (Million) Forecast, by Application 2019 & 2032
- Table 32: Colombia PBR Industry Revenue (Million) Forecast, by Application 2019 & 2032
- Table 33: Ecuador PBR Industry Revenue (Million) Forecast, by Application 2019 & 2032
- Table 34: Venezuela PBR Industry Revenue (Million) Forecast, by Application 2019 & 2032
- Table 35: Rest of South America PBR Industry Revenue (Million) Forecast, by Application 2019 & 2032
- Table 36: Global PBR Industry Revenue Million Forecast, by Country 2019 & 2032
- Table 37: United States PBR Industry Revenue (Million) Forecast, by Application 2019 & 2032
- Table 38: Canada PBR Industry Revenue (Million) Forecast, by Application 2019 & 2032
- Table 39: Mexico PBR Industry Revenue (Million) Forecast, by Application 2019 & 2032
- Table 40: Global PBR Industry Revenue Million Forecast, by Country 2019 & 2032
- Table 41: United Arab Emirates PBR Industry Revenue (Million) Forecast, by Application 2019 & 2032
- Table 42: Saudi Arabia PBR Industry Revenue (Million) Forecast, by Application 2019 & 2032
- Table 43: South Africa PBR Industry Revenue (Million) Forecast, by Application 2019 & 2032
- Table 44: Rest of Middle East and Africa PBR Industry Revenue (Million) Forecast, by Application 2019 & 2032
- Table 45: Global PBR Industry Revenue Million Forecast, by Application 2019 & 2032
- Table 46: Global PBR Industry Revenue Million Forecast, by Country 2019 & 2032
- Table 47: China PBR Industry Revenue (Million) Forecast, by Application 2019 & 2032
- Table 48: India PBR Industry Revenue (Million) Forecast, by Application 2019 & 2032
- Table 49: Japan PBR Industry Revenue (Million) Forecast, by Application 2019 & 2032
- Table 50: South Korea PBR Industry Revenue (Million) Forecast, by Application 2019 & 2032
- Table 51: Indonesia PBR Industry Revenue (Million) Forecast, by Application 2019 & 2032
- Table 52: Malaysia PBR Industry Revenue (Million) Forecast, by Application 2019 & 2032
- Table 53: Thailand PBR Industry Revenue (Million) Forecast, by Application 2019 & 2032
- Table 54: Vietnam PBR Industry Revenue (Million) Forecast, by Application 2019 & 2032
- Table 55: Rest of Asia Pacific PBR Industry Revenue (Million) Forecast, by Application 2019 & 2032
- Table 56: Global PBR Industry Revenue Million Forecast, by Application 2019 & 2032
- Table 57: Global PBR Industry Revenue Million Forecast, by Country 2019 & 2032
- Table 58: United States PBR Industry Revenue (Million) Forecast, by Application 2019 & 2032
- Table 59: Canada PBR Industry Revenue (Million) Forecast, by Application 2019 & 2032
- Table 60: Mexico PBR Industry Revenue (Million) Forecast, by Application 2019 & 2032
- Table 61: Global PBR Industry Revenue Million Forecast, by Application 2019 & 2032
- Table 62: Global PBR Industry Revenue Million Forecast, by Country 2019 & 2032
- Table 63: Germany PBR Industry Revenue (Million) Forecast, by Application 2019 & 2032
- Table 64: United Kingdom PBR Industry Revenue (Million) Forecast, by Application 2019 & 2032
- Table 65: Italy PBR Industry Revenue (Million) Forecast, by Application 2019 & 2032
- Table 66: France PBR Industry Revenue (Million) Forecast, by Application 2019 & 2032
- Table 67: Spain PBR Industry Revenue (Million) Forecast, by Application 2019 & 2032
- Table 68: Russia PBR Industry Revenue (Million) Forecast, by Application 2019 & 2032
- Table 69: NORDIC Countries PBR Industry Revenue (Million) Forecast, by Application 2019 & 2032
- Table 70: Turkey PBR Industry Revenue (Million) Forecast, by Application 2019 & 2032
- Table 71: Rest of Europe PBR Industry Revenue (Million) Forecast, by Application 2019 & 2032
- Table 72: Global PBR Industry Revenue Million Forecast, by Application 2019 & 2032
- Table 73: Global PBR Industry Revenue Million Forecast, by Country 2019 & 2032
- Table 74: Brazil PBR Industry Revenue (Million) Forecast, by Application 2019 & 2032
- Table 75: Argentina PBR Industry Revenue (Million) Forecast, by Application 2019 & 2032
- Table 76: Colombia PBR Industry Revenue (Million) Forecast, by Application 2019 & 2032
- Table 77: Rest of South America PBR Industry Revenue (Million) Forecast, by Application 2019 & 2032
- Table 78: Global PBR Industry Revenue Million Forecast, by Application 2019 & 2032
- Table 79: Global PBR Industry Revenue Million Forecast, by Country 2019 & 2032
- Table 80: Saudi Arabia PBR Industry Revenue (Million) Forecast, by Application 2019 & 2032
- Table 81: South Africa PBR Industry Revenue (Million) Forecast, by Application 2019 & 2032
- Table 82: Qatar PBR Industry Revenue (Million) Forecast, by Application 2019 & 2032
- Table 83: UAE PBR Industry Revenue (Million) Forecast, by Application 2019 & 2032
- Table 84: Nigeria PBR Industry Revenue (Million) Forecast, by Application 2019 & 2032
- Table 85: Egypt PBR Industry Revenue (Million) Forecast, by Application 2019 & 2032
- Table 86: Rest of Middle East and Africa PBR Industry Revenue (Million) Forecast, by Application 2019 & 2032
Frequently Asked Questions
1. What is the projected Compound Annual Growth Rate (CAGR) of the PBR Industry?
The projected CAGR is approximately 3.95%.
2. Which companies are prominent players in the PBR Industry?
Key companies in the market include ARLANXEO, Synthos, UBE Corporation, KURARAY CO LTD, THE YOKOHAMA RUBBER CO LTD, ENEOS Materials Corporation, Reliance Industries Limited, ZEON CORPORATION, KUMHO PETROCHEMICAL, LANXESS, SABIC, Trinseo, LG Chem, Versalis S p A *List Not Exhaustive, Indian Oil Corporation Ltd, SIBUR International GmbH.
3. What are the main segments of the PBR Industry?
The market segments include Application.
4. Can you provide details about the market size?
The market size is estimated to be USD 7.71 Million as of 2022.
5. What are some drivers contributing to market growth?
Increasing Demand From the Automobile Industry; Growth in the Synthetic Rubber Industry; Other Drivers.
6. What are the notable trends driving market growth?
Tire Manufacturing Application Segment to Dominate The Market.
7. Are there any restraints impacting market growth?
Stringent Enviornmental Regulations; Health Concerns Regarding Exposure to Polybutadiene.
8. Can you provide examples of recent developments in the market?
February 2023:Arlanxeo revealed the commencement of a 65 ktpa polybutadiene rubber production plant in southern Brazil. This new facility, situated in the Triunfo petrochemical complex in Rio Grande do Sul, underlines the company's dedication to strengthening its presence in Latin America.
9. What pricing options are available for accessing the report?
Pricing options include single-user, multi-user, and enterprise licenses priced at USD 4750, USD 5250, and USD 8750 respectively.
10. Is the market size provided in terms of value or volume?
The market size is provided in terms of value, measured in Million.
11. Are there any specific market keywords associated with the report?
Yes, the market keyword associated with the report is "PBR Industry," which aids in identifying and referencing the specific market segment covered.
12. How do I determine which pricing option suits my needs best?
The pricing options vary based on user requirements and access needs. Individual users may opt for single-user licenses, while businesses requiring broader access may choose multi-user or enterprise licenses for cost-effective access to the report.
13. Are there any additional resources or data provided in the PBR Industry report?
While the report offers comprehensive insights, it's advisable to review the specific contents or supplementary materials provided to ascertain if additional resources or data are available.
14. How can I stay updated on further developments or reports in the PBR Industry?
To stay informed about further developments, trends, and reports in the PBR Industry, consider subscribing to industry newsletters, following relevant companies and organizations, or regularly checking reputable industry news sources and publications.
Methodology
Step 1 - Identification of Relevant Samples Size from Population Database


Step 2 - Approaches for Defining Global Market Size (Value, Volume* & Price*)

Note*: In applicable scenarios
Step 3 - Data Sources
Primary Research
- Web Analytics
- Survey Reports
- Research Institute
- Latest Research Reports
- Opinion Leaders
Secondary Research
- Annual Reports
- White Paper
- Latest Press Release
- Industry Association
- Paid Database
- Investor Presentations

Step 4 - Data Triangulation
Involves using different sources of information in order to increase the validity of a study
These sources are likely to be stakeholders in a program - participants, other researchers, program staff, other community members, and so on.
Then we put all data in single framework & apply various statistical tools to find out the dynamic on the market.
During the analysis stage, feedback from the stakeholder groups would be compared to determine areas of agreement as well as areas of divergence
