

Key Insights
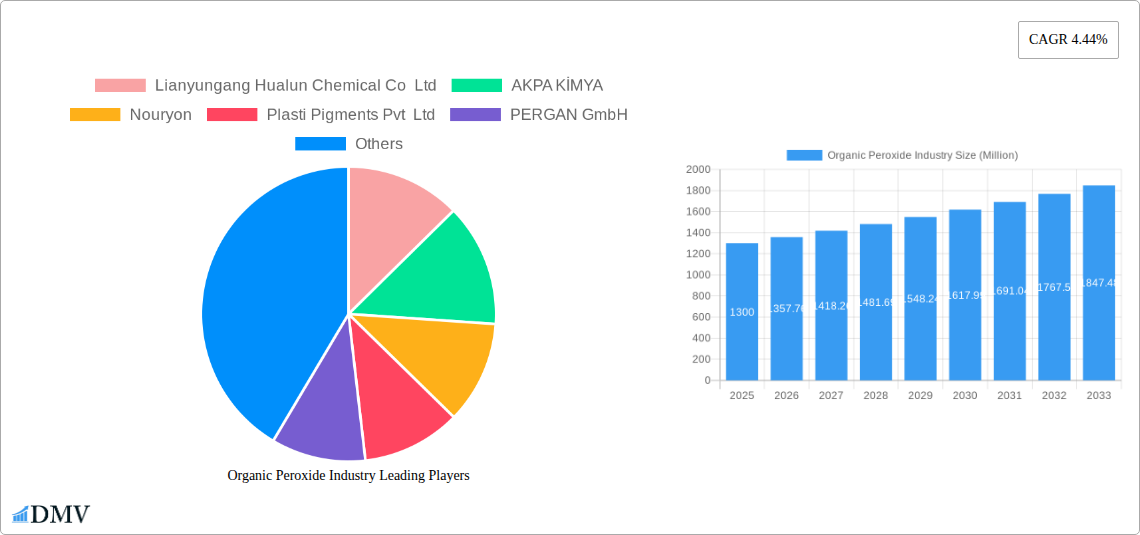
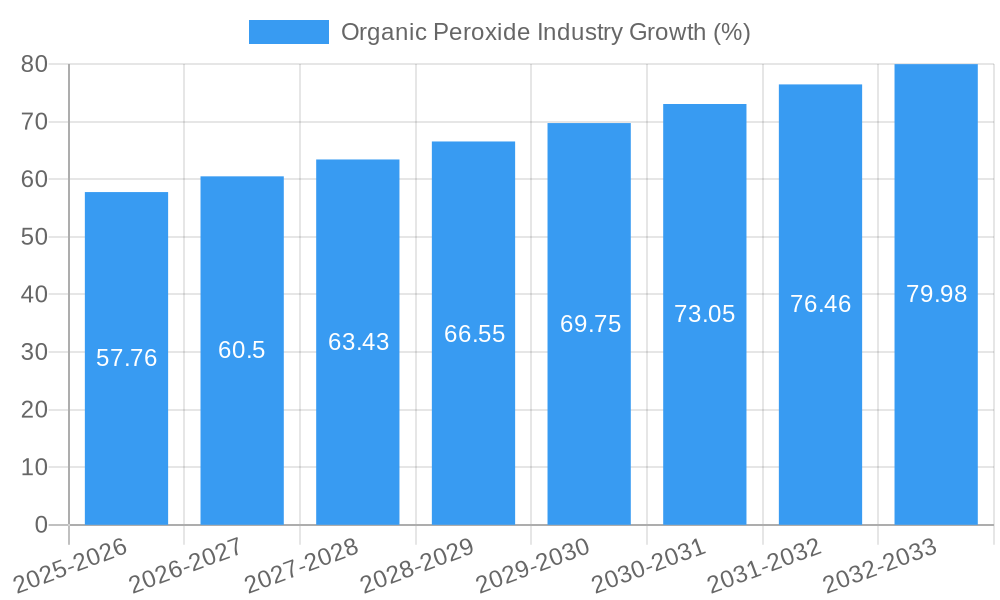
The global organic peroxide market, valued at $1.30 billion in 2025, is projected to experience steady growth, driven by a Compound Annual Growth Rate (CAGR) of 4.44% from 2025 to 2033. This expansion is fueled primarily by the increasing demand from key application sectors. The polymers and rubber industry's reliance on organic peroxides as polymerization initiators and cross-linking agents significantly contributes to market growth. The rising construction and automotive sectors, demanding more polymer-based materials, further boost this segment. Simultaneously, the coatings and adhesives industry utilizes organic peroxides for curing and cross-linking, driving demand. Growth in the paper and textile industries, where organic peroxides enhance bleaching and finishing processes, also contributes. Although the healthcare and cosmetics sectors represent a smaller share, their consistent demand for specialized peroxide formulations contributes to the overall market expansion. Geographic expansion, particularly in rapidly developing Asian economies, further supports the market's growth trajectory. However, potential restraints include stringent environmental regulations surrounding peroxide handling and disposal, along with the inherent safety concerns associated with their reactive nature. Product innovation, particularly in developing safer and more efficient peroxide formulations, is expected to mitigate these concerns and drive future market growth.
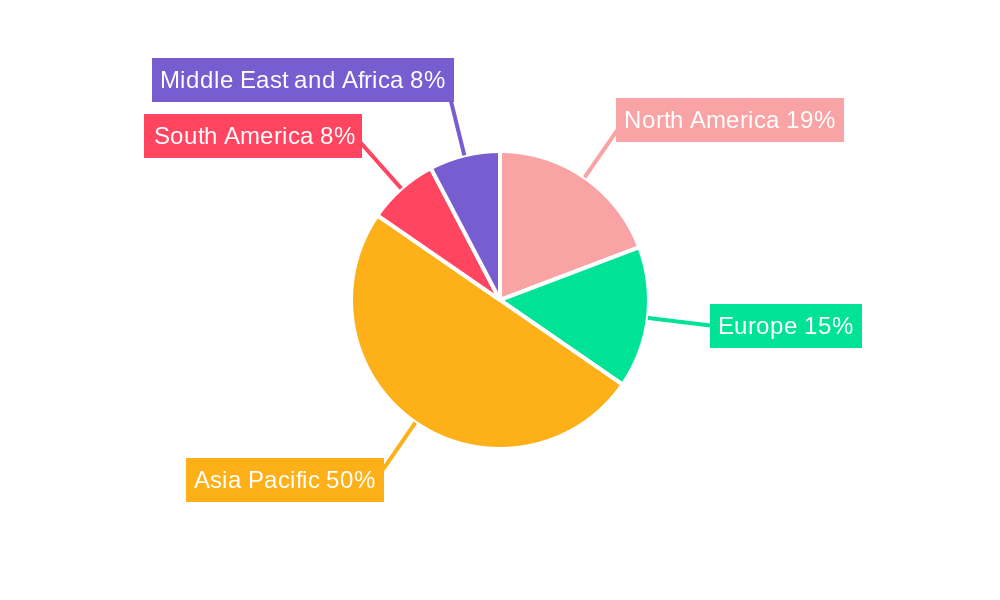
The market segmentation reveals a diverse landscape. Diacyl peroxides and benzoyl peroxide dominate the type segment due to their widespread use in various applications. Regionally, Asia Pacific, particularly China and India, holds a significant market share driven by robust industrial growth and rising consumption of polymer-based products. North America and Europe follow, exhibiting steady growth influenced by technological advancements and established industries. Competition within the market is intense, with major players like Arkema Group, Nouryon, and United Initiators, alongside several regional manufacturers, actively competing based on product quality, pricing, and technological innovation. The forecast period will likely see a continued focus on sustainable manufacturing practices and the development of specialized organic peroxide formulations for niche applications. This will shape the competitive dynamics and overall market growth, pushing the value significantly above the $1.30 billion mark by 2033.
Organic Peroxide Industry Market Report: 2019-2033
This comprehensive report provides an in-depth analysis of the global organic peroxide industry, offering invaluable insights for stakeholders seeking to navigate this dynamic market. The study covers the period from 2019 to 2033, with 2025 serving as the base and estimated year. The report's detailed forecast, spanning 2025-2033, builds on historical data from 2019-2024, providing a robust foundation for informed decision-making. The global organic peroxide market is projected to reach xx Million by 2033, presenting significant opportunities and challenges for businesses operating within this sector.
Organic Peroxide Industry Market Composition & Trends
This section analyzes the competitive landscape of the organic peroxide industry, evaluating market concentration, innovation drivers, regulatory influences, substitute products, end-user preferences, and merger & acquisition (M&A) activities. The market exhibits a moderately concentrated structure, with key players like Arkema Group, Nouryon, and United Initiators holding significant market share. However, smaller companies continue to innovate and contribute to market growth.
- Market Share Distribution: Arkema Group holds an estimated xx% market share, followed by Nouryon at xx% and United Initiators at xx%. The remaining share is distributed among numerous regional and specialized players.
- Innovation Catalysts: Continuous research and development in polymer chemistry and material science are key drivers of innovation. The development of novel organic peroxide formulations with improved performance characteristics is a key area of focus.
- Regulatory Landscape: Stringent safety regulations surrounding the handling and transportation of organic peroxides significantly impact the industry's operational dynamics. Compliance costs and safety procedures add operational complexity.
- Substitute Products: While organic peroxides have unique properties, alternative initiators and crosslinking agents are available, creating a competitive landscape.
- End-User Profiles: Major end-users include the polymers and rubber, coatings and adhesives, and healthcare sectors. The demand from each sector varies based on economic conditions and technological advancements.
- M&A Activities: The industry has witnessed several M&A activities in recent years, with deal values reaching xx Million in aggregate over the historical period, primarily driven by efforts to expand product portfolios and geographic reach. For example, Arkema’s reorganization of its Luperox and Retic organic peroxide distribution (detailed in the "Key Developments" section) demonstrates strategic market consolidation efforts.
Organic Peroxide Industry Industry Evolution
The organic peroxide industry has experienced significant evolution, characterized by fluctuating growth trajectories, technological breakthroughs, and shifts in consumer demand. During the historical period (2019-2024), the market experienced an average annual growth rate (AAGR) of xx%, primarily fueled by the expanding polymers and rubber sector. The forecast period (2025-2033) projects a more moderate but still substantial AAGR of xx%, driven by factors such as increasing demand for advanced materials in various applications and the continuous improvement of production technologies. Technological advancements, such as the development of more efficient and safer production processes, have significantly impacted manufacturing costs and product quality. This progress is matched by evolving consumer preferences, which increasingly demand eco-friendly and sustainable alternatives; thus, the production and application of organic peroxides are undergoing changes to address these preferences. Further, the shift towards sustainable and environmentally benign organic peroxide production methods, coupled with increasing demand from high-growth sectors such as renewable energy, will continue to drive market expansion. The adoption of new production technologies, while initially capital-intensive, offers long-term cost advantages and efficiency improvements, further fueling market growth.
Leading Regions, Countries, or Segments in Organic Peroxide Industry
The Asia-Pacific region dominates the organic peroxide market, driven by rapid industrialization and robust growth in the polymers and rubber sector. Within this region, China plays a particularly significant role, accounting for a significant share of global production.
Key Drivers (Asia-Pacific):
- Significant investments in manufacturing capacity.
- Strong government support for industrial development.
- Large and growing downstream industries like construction and automotive.
Dominance Factors:
- Abundant raw material availability.
- Lower production costs compared to other regions.
- High demand from expanding manufacturing sectors.
The polymers and rubber segment is the largest application sector, consuming the majority of organic peroxide production globally. This is followed by coatings and adhesives which demonstrates substantial market potential due to factors such as high consumption within the construction industry and growing demand for advanced coatings. The continued development of novel polymer formulations and the increased utilization of organic peroxides in advanced materials technology will propel continued growth in this area. Benzoyl peroxide, a key type of organic peroxide, holds a prominent position in the market owing to its widespread use across various applications.
Organic Peroxide Industry Product Innovations
Recent innovations include the development of specialized organic peroxides tailored for specific applications, such as high-performance polymers with improved durability and thermal stability. These new products offer unique selling propositions like enhanced reaction kinetics, reduced byproduct formation, and improved safety profiles. Further, technological advancements in production processes, such as the implementation of continuous flow reactors, have resulted in higher yields and reduced environmental impact. These advancements enhance the overall efficiency and competitiveness of organic peroxide production and provide a strong base for future growth and innovation within the sector.
Propelling Factors for Organic Peroxide Industry Growth
Several factors drive growth in the organic peroxide industry. Technological advancements in production processes and product formulations lead to cost efficiencies and superior product performance. The robust growth of downstream industries, particularly polymers and rubber, significantly increases the demand for organic peroxides. Favorable government policies and regulatory support in key regions contribute to market expansion. For instance, initiatives promoting sustainable materials and manufacturing practices encourage the adoption of eco-friendly organic peroxide alternatives.
Obstacles in the Organic Peroxide Industry Market
The organic peroxide industry faces challenges, including stringent safety regulations that increase production costs and operational complexity. Supply chain disruptions and volatility in raw material prices impact profitability and production stability. Intense competition among existing and new market entrants creates price pressures. The inherent hazards associated with handling and transportation of organic peroxides mandate extensive safety measures and compliance requirements, representing a significant operating cost.
Future Opportunities in Organic Peroxide Industry
Emerging opportunities include expansion into new and growing markets, especially in developing economies with rising demand for materials. The development of sustainable and environmentally friendly organic peroxides presents a significant avenue for growth, aligning with the industry's broader push toward environmentally conscious production. Further, new applications in fields like renewable energy and advanced materials will further drive demand.
Major Players in the Organic Peroxide Industry Ecosystem
- Arkema Group
- Nouryon
- Lianyungang Hualun Chemical Co Ltd
- AKPA KİMYA
- Plasti Pigments Pvt Ltd
- PERGAN GmbH
- Novichem Spzoo
- United Initiators
- Kawaguchi Chemical Co Ltd
- MPI Chemie BV
- ACE CHEMICAL CORP
- NOF CORPORATION
- Chinasun Specialty Products Co Ltd
Key Developments in Organic Peroxide Industry Industry
- October 2022: Arkema announced a reorganization of its Luperox and Retic organic peroxide distribution in several European countries, effective January 1st, 2023. This strategic move aims to enhance market penetration and customer reach.
- July 2022: United Initiators completed a new TBHP-TBA facility in China, significantly expanding its production capacity and strengthening its product portfolio. This expansion demonstrates a strategic investment in the Asian market.
Strategic Organic Peroxide Industry Market Forecast
The organic peroxide market is poised for continued growth driven by technological advancements, expanding downstream industries, and favorable regulatory environments. However, challenges related to safety regulations and supply chain stability must be addressed. The focus on sustainable and environmentally friendly alternatives will shape future market dynamics, offering significant opportunities for innovation and expansion in the years to come. The market's long-term prospects remain positive, with substantial growth potential across various segments and geographic regions.
Organic Peroxide Industry Segmentation
-
1. Type
- 1.1. Diacyl Peroxides
- 1.2. Ketone Peroxides
- 1.3. Percarbonates
- 1.4. Benzoyl Peroxide
- 1.5. Dialkyl Peroxides
- 1.6. Hydro-Peroxides
- 1.7. Peroxyesters
- 1.8. Other Types
-
2. Application
- 2.1. Polymers and Rubber
- 2.2. Coatings and Adhesives
- 2.3. Paper and Textile
- 2.4. Cosmetics
- 2.5. Healthcare
- 2.6. Other Applications
Organic Peroxide Industry Segmentation By Geography
-
1. Asia Pacific
- 1.1. China
- 1.2. India
- 1.3. Japan
- 1.4. South Korea
- 1.5. Rest of Asia Pacific
-
2. North America
- 2.1. United States
- 2.2. Canada
- 2.3. Mexico
-
3. Europe
- 3.1. Germany
- 3.2. United Kingdom
- 3.3. Italy
- 3.4. France
- 3.5. Spain
- 3.6. Rest of Europe
-
4. South America
- 4.1. Brazil
- 4.2. Argentina
- 4.3. Rest of South America
-
5. Middle East and Africa
- 5.1. Saudi Arabia
- 5.2. South Africa
- 5.3. Rest of Middle East and Africa
Organic Peroxide Industry REPORT HIGHLIGHTS
| Aspects | Details |
|---|---|
| Study Period | 2019-2033 |
| Base Year | 2024 |
| Estimated Year | 2025 |
| Forecast Period | 2025-2033 |
| Historical Period | 2019-2024 |
| Growth Rate | CAGR of 4.44% from 2019-2033 |
| Segmentation |
|
Table of Contents
- 1. Introduction
- 1.1. Research Scope
- 1.2. Market Segmentation
- 1.3. Research Methodology
- 1.4. Definitions and Assumptions
- 2. Executive Summary
- 2.1. Introduction
- 3. Market Dynamics
- 3.1. Introduction
- 3.2. Market Drivers
- 3.2.1. Increasing Demand for Polymers from Various End-user Industries; Surging Utilization in Coating Applications
- 3.3. Market Restrains
- 3.3.1 Difficulty in Storage
- 3.3.2 Transport
- 3.3.3 and Handling Organic Peroxides
- 3.4. Market Trends
- 3.4.1. Polymers and Rubbers to Dominate the Market
- 4. Market Factor Analysis
- 4.1. Porters Five Forces
- 4.2. Supply/Value Chain
- 4.3. PESTEL analysis
- 4.4. Market Entropy
- 4.5. Patent/Trademark Analysis
- 5. Global Organic Peroxide Industry Analysis, Insights and Forecast, 2019-2031
- 5.1. Market Analysis, Insights and Forecast - by Type
- 5.1.1. Diacyl Peroxides
- 5.1.2. Ketone Peroxides
- 5.1.3. Percarbonates
- 5.1.4. Benzoyl Peroxide
- 5.1.5. Dialkyl Peroxides
- 5.1.6. Hydro-Peroxides
- 5.1.7. Peroxyesters
- 5.1.8. Other Types
- 5.2. Market Analysis, Insights and Forecast - by Application
- 5.2.1. Polymers and Rubber
- 5.2.2. Coatings and Adhesives
- 5.2.3. Paper and Textile
- 5.2.4. Cosmetics
- 5.2.5. Healthcare
- 5.2.6. Other Applications
- 5.3. Market Analysis, Insights and Forecast - by Region
- 5.3.1. Asia Pacific
- 5.3.2. North America
- 5.3.3. Europe
- 5.3.4. South America
- 5.3.5. Middle East and Africa
- 5.1. Market Analysis, Insights and Forecast - by Type
- 6. Asia Pacific Organic Peroxide Industry Analysis, Insights and Forecast, 2019-2031
- 6.1. Market Analysis, Insights and Forecast - by Type
- 6.1.1. Diacyl Peroxides
- 6.1.2. Ketone Peroxides
- 6.1.3. Percarbonates
- 6.1.4. Benzoyl Peroxide
- 6.1.5. Dialkyl Peroxides
- 6.1.6. Hydro-Peroxides
- 6.1.7. Peroxyesters
- 6.1.8. Other Types
- 6.2. Market Analysis, Insights and Forecast - by Application
- 6.2.1. Polymers and Rubber
- 6.2.2. Coatings and Adhesives
- 6.2.3. Paper and Textile
- 6.2.4. Cosmetics
- 6.2.5. Healthcare
- 6.2.6. Other Applications
- 6.1. Market Analysis, Insights and Forecast - by Type
- 7. North America Organic Peroxide Industry Analysis, Insights and Forecast, 2019-2031
- 7.1. Market Analysis, Insights and Forecast - by Type
- 7.1.1. Diacyl Peroxides
- 7.1.2. Ketone Peroxides
- 7.1.3. Percarbonates
- 7.1.4. Benzoyl Peroxide
- 7.1.5. Dialkyl Peroxides
- 7.1.6. Hydro-Peroxides
- 7.1.7. Peroxyesters
- 7.1.8. Other Types
- 7.2. Market Analysis, Insights and Forecast - by Application
- 7.2.1. Polymers and Rubber
- 7.2.2. Coatings and Adhesives
- 7.2.3. Paper and Textile
- 7.2.4. Cosmetics
- 7.2.5. Healthcare
- 7.2.6. Other Applications
- 7.1. Market Analysis, Insights and Forecast - by Type
- 8. Europe Organic Peroxide Industry Analysis, Insights and Forecast, 2019-2031
- 8.1. Market Analysis, Insights and Forecast - by Type
- 8.1.1. Diacyl Peroxides
- 8.1.2. Ketone Peroxides
- 8.1.3. Percarbonates
- 8.1.4. Benzoyl Peroxide
- 8.1.5. Dialkyl Peroxides
- 8.1.6. Hydro-Peroxides
- 8.1.7. Peroxyesters
- 8.1.8. Other Types
- 8.2. Market Analysis, Insights and Forecast - by Application
- 8.2.1. Polymers and Rubber
- 8.2.2. Coatings and Adhesives
- 8.2.3. Paper and Textile
- 8.2.4. Cosmetics
- 8.2.5. Healthcare
- 8.2.6. Other Applications
- 8.1. Market Analysis, Insights and Forecast - by Type
- 9. South America Organic Peroxide Industry Analysis, Insights and Forecast, 2019-2031
- 9.1. Market Analysis, Insights and Forecast - by Type
- 9.1.1. Diacyl Peroxides
- 9.1.2. Ketone Peroxides
- 9.1.3. Percarbonates
- 9.1.4. Benzoyl Peroxide
- 9.1.5. Dialkyl Peroxides
- 9.1.6. Hydro-Peroxides
- 9.1.7. Peroxyesters
- 9.1.8. Other Types
- 9.2. Market Analysis, Insights and Forecast - by Application
- 9.2.1. Polymers and Rubber
- 9.2.2. Coatings and Adhesives
- 9.2.3. Paper and Textile
- 9.2.4. Cosmetics
- 9.2.5. Healthcare
- 9.2.6. Other Applications
- 9.1. Market Analysis, Insights and Forecast - by Type
- 10. Middle East and Africa Organic Peroxide Industry Analysis, Insights and Forecast, 2019-2031
- 10.1. Market Analysis, Insights and Forecast - by Type
- 10.1.1. Diacyl Peroxides
- 10.1.2. Ketone Peroxides
- 10.1.3. Percarbonates
- 10.1.4. Benzoyl Peroxide
- 10.1.5. Dialkyl Peroxides
- 10.1.6. Hydro-Peroxides
- 10.1.7. Peroxyesters
- 10.1.8. Other Types
- 10.2. Market Analysis, Insights and Forecast - by Application
- 10.2.1. Polymers and Rubber
- 10.2.2. Coatings and Adhesives
- 10.2.3. Paper and Textile
- 10.2.4. Cosmetics
- 10.2.5. Healthcare
- 10.2.6. Other Applications
- 10.1. Market Analysis, Insights and Forecast - by Type
- 11. Asia Pacific Organic Peroxide Industry Analysis, Insights and Forecast, 2019-2031
- 11.1. Market Analysis, Insights and Forecast - By Country/Sub-region
- 11.1.1 China
- 11.1.2 India
- 11.1.3 Japan
- 11.1.4 South Korea
- 11.1.5 Rest of Asia Pacific
- 12. North America Organic Peroxide Industry Analysis, Insights and Forecast, 2019-2031
- 12.1. Market Analysis, Insights and Forecast - By Country/Sub-region
- 12.1.1 United States
- 12.1.2 Canada
- 12.1.3 Mexico
- 13. Europe Organic Peroxide Industry Analysis, Insights and Forecast, 2019-2031
- 13.1. Market Analysis, Insights and Forecast - By Country/Sub-region
- 13.1.1 Germany
- 13.1.2 United Kingdom
- 13.1.3 Italy
- 13.1.4 France
- 13.1.5 Spain
- 13.1.6 Rest of Europe
- 14. South America Organic Peroxide Industry Analysis, Insights and Forecast, 2019-2031
- 14.1. Market Analysis, Insights and Forecast - By Country/Sub-region
- 14.1.1 Brazil
- 14.1.2 Argentina
- 14.1.3 Rest of South America
- 15. Middle East and Africa Organic Peroxide Industry Analysis, Insights and Forecast, 2019-2031
- 15.1. Market Analysis, Insights and Forecast - By Country/Sub-region
- 15.1.1 Saudi Arabia
- 15.1.2 South Africa
- 15.1.3 Rest of Middle East and Africa
- 16. Competitive Analysis
- 16.1. Global Market Share Analysis 2024
- 16.2. Company Profiles
- 16.2.1 Lianyungang Hualun Chemical Co Ltd
- 16.2.1.1. Overview
- 16.2.1.2. Products
- 16.2.1.3. SWOT Analysis
- 16.2.1.4. Recent Developments
- 16.2.1.5. Financials (Based on Availability)
- 16.2.2 AKPA KİMYA
- 16.2.2.1. Overview
- 16.2.2.2. Products
- 16.2.2.3. SWOT Analysis
- 16.2.2.4. Recent Developments
- 16.2.2.5. Financials (Based on Availability)
- 16.2.3 Nouryon
- 16.2.3.1. Overview
- 16.2.3.2. Products
- 16.2.3.3. SWOT Analysis
- 16.2.3.4. Recent Developments
- 16.2.3.5. Financials (Based on Availability)
- 16.2.4 Plasti Pigments Pvt Ltd
- 16.2.4.1. Overview
- 16.2.4.2. Products
- 16.2.4.3. SWOT Analysis
- 16.2.4.4. Recent Developments
- 16.2.4.5. Financials (Based on Availability)
- 16.2.5 PERGAN GmbH
- 16.2.5.1. Overview
- 16.2.5.2. Products
- 16.2.5.3. SWOT Analysis
- 16.2.5.4. Recent Developments
- 16.2.5.5. Financials (Based on Availability)
- 16.2.6 Novichem Spzoo
- 16.2.6.1. Overview
- 16.2.6.2. Products
- 16.2.6.3. SWOT Analysis
- 16.2.6.4. Recent Developments
- 16.2.6.5. Financials (Based on Availability)
- 16.2.7 United Initiators*List Not Exhaustive
- 16.2.7.1. Overview
- 16.2.7.2. Products
- 16.2.7.3. SWOT Analysis
- 16.2.7.4. Recent Developments
- 16.2.7.5. Financials (Based on Availability)
- 16.2.8 Kawaguchi Chemical Co Ltd
- 16.2.8.1. Overview
- 16.2.8.2. Products
- 16.2.8.3. SWOT Analysis
- 16.2.8.4. Recent Developments
- 16.2.8.5. Financials (Based on Availability)
- 16.2.9 MPI Chemie BV
- 16.2.9.1. Overview
- 16.2.9.2. Products
- 16.2.9.3. SWOT Analysis
- 16.2.9.4. Recent Developments
- 16.2.9.5. Financials (Based on Availability)
- 16.2.10 ACE CHEMICAL CORP
- 16.2.10.1. Overview
- 16.2.10.2. Products
- 16.2.10.3. SWOT Analysis
- 16.2.10.4. Recent Developments
- 16.2.10.5. Financials (Based on Availability)
- 16.2.11 Arkema Group
- 16.2.11.1. Overview
- 16.2.11.2. Products
- 16.2.11.3. SWOT Analysis
- 16.2.11.4. Recent Developments
- 16.2.11.5. Financials (Based on Availability)
- 16.2.12 NOF CORPORATION
- 16.2.12.1. Overview
- 16.2.12.2. Products
- 16.2.12.3. SWOT Analysis
- 16.2.12.4. Recent Developments
- 16.2.12.5. Financials (Based on Availability)
- 16.2.13 Chinasun Specialty Products Co Ltd
- 16.2.13.1. Overview
- 16.2.13.2. Products
- 16.2.13.3. SWOT Analysis
- 16.2.13.4. Recent Developments
- 16.2.13.5. Financials (Based on Availability)
- 16.2.1 Lianyungang Hualun Chemical Co Ltd
List of Figures
- Figure 1: Global Organic Peroxide Industry Revenue Breakdown (Million, %) by Region 2024 & 2032
- Figure 2: Asia Pacific Organic Peroxide Industry Revenue (Million), by Country 2024 & 2032
- Figure 3: Asia Pacific Organic Peroxide Industry Revenue Share (%), by Country 2024 & 2032
- Figure 4: North America Organic Peroxide Industry Revenue (Million), by Country 2024 & 2032
- Figure 5: North America Organic Peroxide Industry Revenue Share (%), by Country 2024 & 2032
- Figure 6: Europe Organic Peroxide Industry Revenue (Million), by Country 2024 & 2032
- Figure 7: Europe Organic Peroxide Industry Revenue Share (%), by Country 2024 & 2032
- Figure 8: South America Organic Peroxide Industry Revenue (Million), by Country 2024 & 2032
- Figure 9: South America Organic Peroxide Industry Revenue Share (%), by Country 2024 & 2032
- Figure 10: Middle East and Africa Organic Peroxide Industry Revenue (Million), by Country 2024 & 2032
- Figure 11: Middle East and Africa Organic Peroxide Industry Revenue Share (%), by Country 2024 & 2032
- Figure 12: Asia Pacific Organic Peroxide Industry Revenue (Million), by Type 2024 & 2032
- Figure 13: Asia Pacific Organic Peroxide Industry Revenue Share (%), by Type 2024 & 2032
- Figure 14: Asia Pacific Organic Peroxide Industry Revenue (Million), by Application 2024 & 2032
- Figure 15: Asia Pacific Organic Peroxide Industry Revenue Share (%), by Application 2024 & 2032
- Figure 16: Asia Pacific Organic Peroxide Industry Revenue (Million), by Country 2024 & 2032
- Figure 17: Asia Pacific Organic Peroxide Industry Revenue Share (%), by Country 2024 & 2032
- Figure 18: North America Organic Peroxide Industry Revenue (Million), by Type 2024 & 2032
- Figure 19: North America Organic Peroxide Industry Revenue Share (%), by Type 2024 & 2032
- Figure 20: North America Organic Peroxide Industry Revenue (Million), by Application 2024 & 2032
- Figure 21: North America Organic Peroxide Industry Revenue Share (%), by Application 2024 & 2032
- Figure 22: North America Organic Peroxide Industry Revenue (Million), by Country 2024 & 2032
- Figure 23: North America Organic Peroxide Industry Revenue Share (%), by Country 2024 & 2032
- Figure 24: Europe Organic Peroxide Industry Revenue (Million), by Type 2024 & 2032
- Figure 25: Europe Organic Peroxide Industry Revenue Share (%), by Type 2024 & 2032
- Figure 26: Europe Organic Peroxide Industry Revenue (Million), by Application 2024 & 2032
- Figure 27: Europe Organic Peroxide Industry Revenue Share (%), by Application 2024 & 2032
- Figure 28: Europe Organic Peroxide Industry Revenue (Million), by Country 2024 & 2032
- Figure 29: Europe Organic Peroxide Industry Revenue Share (%), by Country 2024 & 2032
- Figure 30: South America Organic Peroxide Industry Revenue (Million), by Type 2024 & 2032
- Figure 31: South America Organic Peroxide Industry Revenue Share (%), by Type 2024 & 2032
- Figure 32: South America Organic Peroxide Industry Revenue (Million), by Application 2024 & 2032
- Figure 33: South America Organic Peroxide Industry Revenue Share (%), by Application 2024 & 2032
- Figure 34: South America Organic Peroxide Industry Revenue (Million), by Country 2024 & 2032
- Figure 35: South America Organic Peroxide Industry Revenue Share (%), by Country 2024 & 2032
- Figure 36: Middle East and Africa Organic Peroxide Industry Revenue (Million), by Type 2024 & 2032
- Figure 37: Middle East and Africa Organic Peroxide Industry Revenue Share (%), by Type 2024 & 2032
- Figure 38: Middle East and Africa Organic Peroxide Industry Revenue (Million), by Application 2024 & 2032
- Figure 39: Middle East and Africa Organic Peroxide Industry Revenue Share (%), by Application 2024 & 2032
- Figure 40: Middle East and Africa Organic Peroxide Industry Revenue (Million), by Country 2024 & 2032
- Figure 41: Middle East and Africa Organic Peroxide Industry Revenue Share (%), by Country 2024 & 2032
List of Tables
- Table 1: Global Organic Peroxide Industry Revenue Million Forecast, by Region 2019 & 2032
- Table 2: Global Organic Peroxide Industry Revenue Million Forecast, by Type 2019 & 2032
- Table 3: Global Organic Peroxide Industry Revenue Million Forecast, by Application 2019 & 2032
- Table 4: Global Organic Peroxide Industry Revenue Million Forecast, by Region 2019 & 2032
- Table 5: Global Organic Peroxide Industry Revenue Million Forecast, by Country 2019 & 2032
- Table 6: China Organic Peroxide Industry Revenue (Million) Forecast, by Application 2019 & 2032
- Table 7: India Organic Peroxide Industry Revenue (Million) Forecast, by Application 2019 & 2032
- Table 8: Japan Organic Peroxide Industry Revenue (Million) Forecast, by Application 2019 & 2032
- Table 9: South Korea Organic Peroxide Industry Revenue (Million) Forecast, by Application 2019 & 2032
- Table 10: Rest of Asia Pacific Organic Peroxide Industry Revenue (Million) Forecast, by Application 2019 & 2032
- Table 11: Global Organic Peroxide Industry Revenue Million Forecast, by Country 2019 & 2032
- Table 12: United States Organic Peroxide Industry Revenue (Million) Forecast, by Application 2019 & 2032
- Table 13: Canada Organic Peroxide Industry Revenue (Million) Forecast, by Application 2019 & 2032
- Table 14: Mexico Organic Peroxide Industry Revenue (Million) Forecast, by Application 2019 & 2032
- Table 15: Global Organic Peroxide Industry Revenue Million Forecast, by Country 2019 & 2032
- Table 16: Germany Organic Peroxide Industry Revenue (Million) Forecast, by Application 2019 & 2032
- Table 17: United Kingdom Organic Peroxide Industry Revenue (Million) Forecast, by Application 2019 & 2032
- Table 18: Italy Organic Peroxide Industry Revenue (Million) Forecast, by Application 2019 & 2032
- Table 19: France Organic Peroxide Industry Revenue (Million) Forecast, by Application 2019 & 2032
- Table 20: Spain Organic Peroxide Industry Revenue (Million) Forecast, by Application 2019 & 2032
- Table 21: Rest of Europe Organic Peroxide Industry Revenue (Million) Forecast, by Application 2019 & 2032
- Table 22: Global Organic Peroxide Industry Revenue Million Forecast, by Country 2019 & 2032
- Table 23: Brazil Organic Peroxide Industry Revenue (Million) Forecast, by Application 2019 & 2032
- Table 24: Argentina Organic Peroxide Industry Revenue (Million) Forecast, by Application 2019 & 2032
- Table 25: Rest of South America Organic Peroxide Industry Revenue (Million) Forecast, by Application 2019 & 2032
- Table 26: Global Organic Peroxide Industry Revenue Million Forecast, by Country 2019 & 2032
- Table 27: Saudi Arabia Organic Peroxide Industry Revenue (Million) Forecast, by Application 2019 & 2032
- Table 28: South Africa Organic Peroxide Industry Revenue (Million) Forecast, by Application 2019 & 2032
- Table 29: Rest of Middle East and Africa Organic Peroxide Industry Revenue (Million) Forecast, by Application 2019 & 2032
- Table 30: Global Organic Peroxide Industry Revenue Million Forecast, by Type 2019 & 2032
- Table 31: Global Organic Peroxide Industry Revenue Million Forecast, by Application 2019 & 2032
- Table 32: Global Organic Peroxide Industry Revenue Million Forecast, by Country 2019 & 2032
- Table 33: China Organic Peroxide Industry Revenue (Million) Forecast, by Application 2019 & 2032
- Table 34: India Organic Peroxide Industry Revenue (Million) Forecast, by Application 2019 & 2032
- Table 35: Japan Organic Peroxide Industry Revenue (Million) Forecast, by Application 2019 & 2032
- Table 36: South Korea Organic Peroxide Industry Revenue (Million) Forecast, by Application 2019 & 2032
- Table 37: Rest of Asia Pacific Organic Peroxide Industry Revenue (Million) Forecast, by Application 2019 & 2032
- Table 38: Global Organic Peroxide Industry Revenue Million Forecast, by Type 2019 & 2032
- Table 39: Global Organic Peroxide Industry Revenue Million Forecast, by Application 2019 & 2032
- Table 40: Global Organic Peroxide Industry Revenue Million Forecast, by Country 2019 & 2032
- Table 41: United States Organic Peroxide Industry Revenue (Million) Forecast, by Application 2019 & 2032
- Table 42: Canada Organic Peroxide Industry Revenue (Million) Forecast, by Application 2019 & 2032
- Table 43: Mexico Organic Peroxide Industry Revenue (Million) Forecast, by Application 2019 & 2032
- Table 44: Global Organic Peroxide Industry Revenue Million Forecast, by Type 2019 & 2032
- Table 45: Global Organic Peroxide Industry Revenue Million Forecast, by Application 2019 & 2032
- Table 46: Global Organic Peroxide Industry Revenue Million Forecast, by Country 2019 & 2032
- Table 47: Germany Organic Peroxide Industry Revenue (Million) Forecast, by Application 2019 & 2032
- Table 48: United Kingdom Organic Peroxide Industry Revenue (Million) Forecast, by Application 2019 & 2032
- Table 49: Italy Organic Peroxide Industry Revenue (Million) Forecast, by Application 2019 & 2032
- Table 50: France Organic Peroxide Industry Revenue (Million) Forecast, by Application 2019 & 2032
- Table 51: Spain Organic Peroxide Industry Revenue (Million) Forecast, by Application 2019 & 2032
- Table 52: Rest of Europe Organic Peroxide Industry Revenue (Million) Forecast, by Application 2019 & 2032
- Table 53: Global Organic Peroxide Industry Revenue Million Forecast, by Type 2019 & 2032
- Table 54: Global Organic Peroxide Industry Revenue Million Forecast, by Application 2019 & 2032
- Table 55: Global Organic Peroxide Industry Revenue Million Forecast, by Country 2019 & 2032
- Table 56: Brazil Organic Peroxide Industry Revenue (Million) Forecast, by Application 2019 & 2032
- Table 57: Argentina Organic Peroxide Industry Revenue (Million) Forecast, by Application 2019 & 2032
- Table 58: Rest of South America Organic Peroxide Industry Revenue (Million) Forecast, by Application 2019 & 2032
- Table 59: Global Organic Peroxide Industry Revenue Million Forecast, by Type 2019 & 2032
- Table 60: Global Organic Peroxide Industry Revenue Million Forecast, by Application 2019 & 2032
- Table 61: Global Organic Peroxide Industry Revenue Million Forecast, by Country 2019 & 2032
- Table 62: Saudi Arabia Organic Peroxide Industry Revenue (Million) Forecast, by Application 2019 & 2032
- Table 63: South Africa Organic Peroxide Industry Revenue (Million) Forecast, by Application 2019 & 2032
- Table 64: Rest of Middle East and Africa Organic Peroxide Industry Revenue (Million) Forecast, by Application 2019 & 2032
Frequently Asked Questions
1. What is the projected Compound Annual Growth Rate (CAGR) of the Organic Peroxide Industry?
The projected CAGR is approximately 4.44%.
2. Which companies are prominent players in the Organic Peroxide Industry?
Key companies in the market include Lianyungang Hualun Chemical Co Ltd, AKPA KİMYA, Nouryon, Plasti Pigments Pvt Ltd, PERGAN GmbH, Novichem Spzoo, United Initiators*List Not Exhaustive, Kawaguchi Chemical Co Ltd, MPI Chemie BV, ACE CHEMICAL CORP, Arkema Group, NOF CORPORATION, Chinasun Specialty Products Co Ltd.
3. What are the main segments of the Organic Peroxide Industry?
The market segments include Type, Application.
4. Can you provide details about the market size?
The market size is estimated to be USD 1.30 Million as of 2022.
5. What are some drivers contributing to market growth?
Increasing Demand for Polymers from Various End-user Industries; Surging Utilization in Coating Applications.
6. What are the notable trends driving market growth?
Polymers and Rubbers to Dominate the Market.
7. Are there any restraints impacting market growth?
Difficulty in Storage. Transport. and Handling Organic Peroxides.
8. Can you provide examples of recent developments in the market?
In October 2022, Arkema announced that the company will reorganize the distribution of its Luperox and Retic organic peroxides, with Weber and Schaer, The Dolder company, and Univar Solutions, for the crosslinking market in several European countries as of January 1st, 2023.
9. What pricing options are available for accessing the report?
Pricing options include single-user, multi-user, and enterprise licenses priced at USD 4750, USD 5250, and USD 8750 respectively.
10. Is the market size provided in terms of value or volume?
The market size is provided in terms of value, measured in Million.
11. Are there any specific market keywords associated with the report?
Yes, the market keyword associated with the report is "Organic Peroxide Industry," which aids in identifying and referencing the specific market segment covered.
12. How do I determine which pricing option suits my needs best?
The pricing options vary based on user requirements and access needs. Individual users may opt for single-user licenses, while businesses requiring broader access may choose multi-user or enterprise licenses for cost-effective access to the report.
13. Are there any additional resources or data provided in the Organic Peroxide Industry report?
While the report offers comprehensive insights, it's advisable to review the specific contents or supplementary materials provided to ascertain if additional resources or data are available.
14. How can I stay updated on further developments or reports in the Organic Peroxide Industry?
To stay informed about further developments, trends, and reports in the Organic Peroxide Industry, consider subscribing to industry newsletters, following relevant companies and organizations, or regularly checking reputable industry news sources and publications.
Methodology
Step 1 - Identification of Relevant Samples Size from Population Database


Step 2 - Approaches for Defining Global Market Size (Value, Volume* & Price*)

Note*: In applicable scenarios
Step 3 - Data Sources
Primary Research
- Web Analytics
- Survey Reports
- Research Institute
- Latest Research Reports
- Opinion Leaders
Secondary Research
- Annual Reports
- White Paper
- Latest Press Release
- Industry Association
- Paid Database
- Investor Presentations

Step 4 - Data Triangulation
Involves using different sources of information in order to increase the validity of a study
These sources are likely to be stakeholders in a program - participants, other researchers, program staff, other community members, and so on.
Then we put all data in single framework & apply various statistical tools to find out the dynamic on the market.
During the analysis stage, feedback from the stakeholder groups would be compared to determine areas of agreement as well as areas of divergence
