

Key Insights
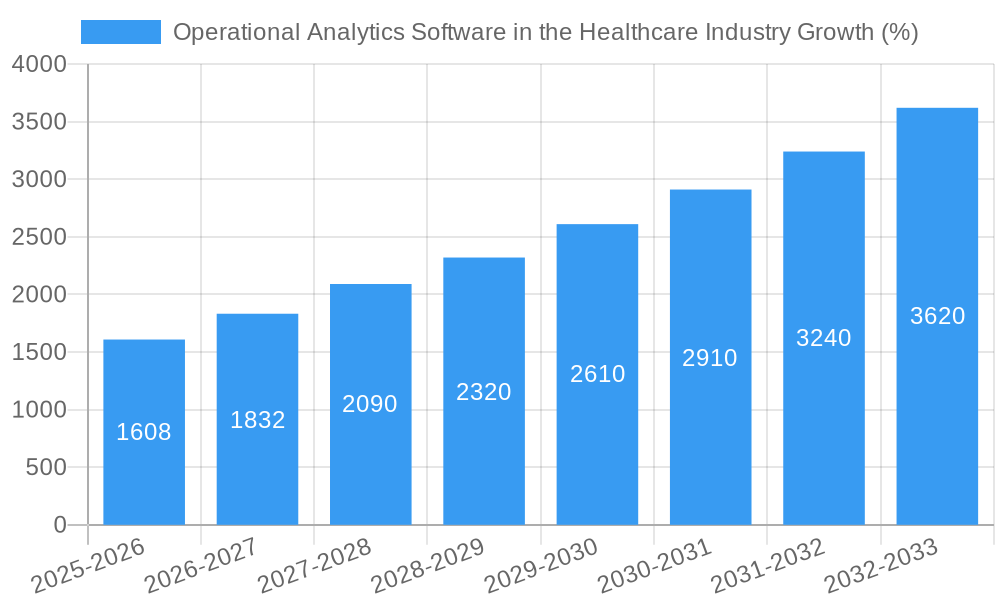
The healthcare industry is undergoing a significant transformation driven by the increasing volume of data generated from various sources. Operational analytics software plays a crucial role in harnessing this data to improve efficiency, reduce costs, and enhance patient care. The market, valued at $12.13 billion in 2025, is experiencing robust growth, projected to expand at a Compound Annual Growth Rate (CAGR) of 13.38% from 2025 to 2033. This growth is fueled by several key drivers: the rising adoption of electronic health records (EHRs), the increasing need for data-driven decision-making in healthcare operations, and the growing demand for improved patient outcomes. Specific segments such as supply chain analytics and human resource analytics are experiencing particularly strong growth, as healthcare organizations seek to optimize their operations across all areas. The software component holds the largest market share, driven by the increasing availability of sophisticated analytics platforms. While on-premise deployments remain prevalent, cloud-based solutions are gaining traction due to their scalability and cost-effectiveness. Major market players, including MedeAnalytics, Cotiviti, and IBM Watson Health, are actively investing in research and development to enhance their offerings and cater to the growing demand. Geographic distribution shows North America currently leading the market, followed by Europe, with the Asia-Pacific region demonstrating significant growth potential.
The restraints on market growth include the high initial investment costs associated with implementing operational analytics software, the need for specialized expertise to effectively utilize the software, and concerns regarding data security and privacy. However, the long-term benefits of improved efficiency, reduced costs, and enhanced patient outcomes are expected to outweigh these challenges. Future trends indicate a continued shift towards cloud-based solutions, increasing integration with EHR systems, and a focus on developing advanced analytics capabilities such as predictive modeling and artificial intelligence (AI) to proactively identify and address operational challenges. The market is expected to see further consolidation as larger players acquire smaller companies to expand their market share and product portfolios. The increasing adoption of value-based care models is also driving the demand for operational analytics software, as healthcare organizations need to track and analyze performance metrics to optimize resource allocation and improve financial outcomes.

Operational Analytics Software in the Healthcare Industry: A Comprehensive Market Report (2019-2033)
This insightful report provides a detailed analysis of the Operational Analytics Software market in the healthcare industry, offering a comprehensive overview of market trends, leading players, and future growth opportunities. With a study period spanning 2019-2033, a base year of 2025, and a forecast period of 2025-2033, this report is an indispensable resource for stakeholders seeking to understand and capitalize on this rapidly evolving market. The total market value is estimated at $XX Million in 2025 and is projected to reach $XX Million by 2033.
Operational Analytics Software in the Healthcare Industry Market Composition & Trends
This section delves into the competitive landscape of the Operational Analytics Software market within the healthcare sector. We analyze market concentration, identifying key players and their respective market shares. The report examines innovation drivers, including advancements in AI and machine learning, and assesses the impact of regulatory landscapes like HIPAA and GDPR on market growth. Furthermore, it explores the prevalence of substitute products and analyzes the evolving profiles of end-users, including hospitals, clinics, pharmaceutical companies, and other healthcare entities. Finally, we analyze mergers and acquisitions (M&A) activities, quantifying deal values and their influence on market dynamics. For example, the estimated total value of M&A deals within the study period (2019-2024) is approximately $XX Million.
- Market Share Distribution: The market is moderately concentrated, with the top five players (MedeAnalytics Inc, Cotiviti Inc, MERATIVE (IBM Watson), Oracle Corporation (Cerner Corporation), and Health Catalyst Inc) holding an estimated XX% of the market share in 2025.
- M&A Activity: Significant M&A activity has been observed, with deals primarily driven by strategic acquisitions aiming to expand product portfolios and market reach. Notable transactions have included acquisitions focused on enhancing data analytics capabilities and integrating advanced technologies.
- Regulatory Landscape: Stringent regulations concerning data privacy and security significantly impact the market, demanding robust compliance measures from vendors and end-users alike.
- Substitute Products: The emergence of cloud-based analytics platforms presents a potential threat to traditional on-premise solutions.
Operational Analytics Software in the Healthcare Industry Industry Evolution
This section charts the evolution of the Operational Analytics Software market in healthcare, examining market growth trajectories from 2019 to 2033. It traces technological advancements, including the adoption of big data analytics, AI, and machine learning, and analyzes how these innovations are shaping market dynamics. The report also explores shifting consumer demands, such as increased focus on data-driven decision-making and improved operational efficiency. The compound annual growth rate (CAGR) from 2025 to 2033 is projected to be XX%, driven by factors such as rising healthcare spending, increasing adoption of electronic health records (EHRs), and a growing need for improved operational efficiency. Adoption rates are projected to increase from XX% in 2025 to XX% by 2033.
Leading Regions, Countries, or Segments in Operational Analytics Software in the Healthcare Industry
This section identifies the leading regions, countries, and segments within the Operational Analytics Software market. The analysis covers various segments including Type (Supply Chain Analytics, Human Resource Analytics, Strategic Analytics), Component (Software, Hardware, Services), Deployment (On-Premise, Cloud), and End-User (Hospitals and Clinics, Pharmaceutical and Biotechnology Companies, Other End Users). North America currently holds the largest market share, driven by factors such as high healthcare expenditure and advanced technological infrastructure.
- Key Drivers:
- North America: High healthcare spending, robust technological infrastructure, and early adoption of advanced analytics.
- Europe: Increasing focus on value-based care and the implementation of stringent data privacy regulations.
- Asia-Pacific: Rapid growth in healthcare IT spending and a rising prevalence of chronic diseases.
- Segment Dominance: The Software component holds the largest market share due to its scalability and flexibility. Hospitals and Clinics represent the largest end-user segment. Strategic Analytics is the fastest-growing type of operational analytics in the healthcare industry.
Operational Analytics Software in the Healthcare Industry Product Innovations
Recent product innovations have focused on enhancing data visualization, improving predictive analytics capabilities, and integrating with existing EHR systems. Many vendors offer solutions with unique selling propositions such as real-time dashboards, predictive modeling capabilities for resource optimization, and specialized analytics modules for specific healthcare areas like supply chain management and patient care. These advancements improve operational efficiency, reduce costs, and enhance decision-making.
Propelling Factors for Operational Analytics Software in the Healthcare Industry Growth
Several factors drive the growth of the Operational Analytics Software market in healthcare. The increasing adoption of EHR systems provides a vast amount of data ripe for analysis. Government initiatives promoting value-based care and data interoperability further boost market growth. Technological advancements, particularly in AI and machine learning, enhance the capabilities of operational analytics software, leading to improved accuracy and efficiency.
Obstacles in the Operational Analytics Software in the Healthcare Industry Market
Despite significant growth potential, several challenges hinder market expansion. High implementation costs and the need for skilled personnel can present barriers to adoption. Data security and privacy concerns are critical, requiring robust compliance measures. Furthermore, the complex and fragmented nature of the healthcare industry can pose challenges to integration and data standardization. The competitive landscape also presents challenges, as established players and new entrants compete for market share. The estimated impact of these barriers results in a $XX Million reduction in the potential market size in 2025.
Future Opportunities in Operational Analytics Software in the Healthcare Industry
Emerging opportunities lie in expanding into underserved markets, developing specialized analytics solutions for niche healthcare areas, and leveraging new technologies like blockchain for enhanced data security and interoperability. The growth of telehealth and remote patient monitoring creates demand for advanced analytics solutions to manage and analyze data from these sources. The increasing emphasis on population health management also presents significant growth opportunities.
Major Players in the Operational Analytics Software in the Healthcare Industry Ecosystem
- MedeAnalytics Inc
- Cotiviti Inc
- MERATIVE (IBM Watson)
- Oracle Corporation (Cerner Corporation)
- Wipro Limited
- Vizient Inc
- Inovalon Inc
- Veradigm LLC (Allscripts Healthcare Solutions Inc)
- Health Catalyst Inc
- CVS Health Corporation
- Optum Inc
- McKesson Corporation
Key Developments in Operational Analytics Software in the Healthcare Industry Industry
- June 2023: Moody's Corporation and Microsoft's partnership to deliver next-generation data and analytics solutions for financial services highlights the increasing integration of AI and advanced analytics across various sectors, indirectly influencing the healthcare industry's adoption of similar technologies.
- August 2023: M3, Inc.'s acquisition of Frogwell Corporation, a Salesforce consulting service provider, signals a growing demand for specialized solutions that integrate operational analytics with CRM systems, potentially enhancing the efficiency of healthcare provider interactions and data management.
Strategic Operational Analytics Software in the Healthcare Industry Market Forecast
The Operational Analytics Software market in healthcare is poised for significant growth, driven by the increasing adoption of advanced technologies, the growing need for improved operational efficiency, and the rising demand for data-driven decision-making. The market is expected to witness sustained growth throughout the forecast period, driven primarily by investments in data analytics capabilities, technological advancements, and rising adoption rates across various segments. The market's potential is immense, with numerous opportunities for innovation and expansion.
Operational Analytics Software in the Healthcare Industry Segmentation
-
1. Type
- 1.1. Supply Chain Analytics
- 1.2. Human Resource Analytics
- 1.3. Strategic Analytics
-
2. Component
- 2.1. Software
- 2.2. Hardware
- 2.3. Services
-
3. Deployment
- 3.1. On-Premise
-
4. En User
- 4.1. Hospitals and Clinics
- 4.2. Pharmaceutical and Biotechnology Companies
- 4.3. Other End Users
Operational Analytics Software in the Healthcare Industry Segmentation By Geography
-
1. North America
- 1.1. United States
- 1.2. Canada
- 1.3. Mexico
-
2. Europe
- 2.1. Germany
- 2.2. United Kingdom
- 2.3. France
- 2.4. Italy
- 2.5. Spain
- 2.6. Rest of Europe
-
3. Asia Pacific
- 3.1. China
- 3.2. Japan
- 3.3. India
- 3.4. Australia
- 3.5. South Korea
- 3.6. Rest of Asia Pacific
-
4. Middle East and Africa
- 4.1. GCC
- 4.2. South Africa
- 4.3. Rest of Middle East and Africa
-
5. South America
- 5.1. Brazil
- 5.2. Argentina
- 5.3. Rest of South America

Operational Analytics Software in the Healthcare Industry REPORT HIGHLIGHTS
| Aspects | Details |
|---|---|
| Study Period | 2019-2033 |
| Base Year | 2024 |
| Estimated Year | 2025 |
| Forecast Period | 2025-2033 |
| Historical Period | 2019-2024 |
| Growth Rate | CAGR of 13.38% from 2019-2033 |
| Segmentation |
|
Table of Contents
- 1. Introduction
- 1.1. Research Scope
- 1.2. Market Segmentation
- 1.3. Research Methodology
- 1.4. Definitions and Assumptions
- 2. Executive Summary
- 2.1. Introduction
- 3. Market Dynamics
- 3.1. Introduction
- 3.2. Market Drivers
- 3.2.1. Increasing Demand for Value-Based Care (VBC); Rising Need to Analyze the Collected Healthcare Data; Rising Awareness regarding Healthcare Standards and Improving Technologies
- 3.3. Market Restrains
- 3.3.1. Concerns regarding Data Privacy and Security; Lack of Trained IT Professionals in Healthcare
- 3.4. Market Trends
- 3.4.1. Software Component is Expected to Witness Significant Growth Over a Forecast Period.
- 4. Market Factor Analysis
- 4.1. Porters Five Forces
- 4.2. Supply/Value Chain
- 4.3. PESTEL analysis
- 4.4. Market Entropy
- 4.5. Patent/Trademark Analysis
- 5. Global Operational Analytics Software in the Healthcare Industry Analysis, Insights and Forecast, 2019-2031
- 5.1. Market Analysis, Insights and Forecast - by Type
- 5.1.1. Supply Chain Analytics
- 5.1.2. Human Resource Analytics
- 5.1.3. Strategic Analytics
- 5.2. Market Analysis, Insights and Forecast - by Component
- 5.2.1. Software
- 5.2.2. Hardware
- 5.2.3. Services
- 5.3. Market Analysis, Insights and Forecast - by Deployment
- 5.3.1. On-Premise
- 5.4. Market Analysis, Insights and Forecast - by En User
- 5.4.1. Hospitals and Clinics
- 5.4.2. Pharmaceutical and Biotechnology Companies
- 5.4.3. Other End Users
- 5.5. Market Analysis, Insights and Forecast - by Region
- 5.5.1. North America
- 5.5.2. Europe
- 5.5.3. Asia Pacific
- 5.5.4. Middle East and Africa
- 5.5.5. South America
- 5.1. Market Analysis, Insights and Forecast - by Type
- 6. North America Operational Analytics Software in the Healthcare Industry Analysis, Insights and Forecast, 2019-2031
- 6.1. Market Analysis, Insights and Forecast - by Type
- 6.1.1. Supply Chain Analytics
- 6.1.2. Human Resource Analytics
- 6.1.3. Strategic Analytics
- 6.2. Market Analysis, Insights and Forecast - by Component
- 6.2.1. Software
- 6.2.2. Hardware
- 6.2.3. Services
- 6.3. Market Analysis, Insights and Forecast - by Deployment
- 6.3.1. On-Premise
- 6.4. Market Analysis, Insights and Forecast - by En User
- 6.4.1. Hospitals and Clinics
- 6.4.2. Pharmaceutical and Biotechnology Companies
- 6.4.3. Other End Users
- 6.1. Market Analysis, Insights and Forecast - by Type
- 7. Europe Operational Analytics Software in the Healthcare Industry Analysis, Insights and Forecast, 2019-2031
- 7.1. Market Analysis, Insights and Forecast - by Type
- 7.1.1. Supply Chain Analytics
- 7.1.2. Human Resource Analytics
- 7.1.3. Strategic Analytics
- 7.2. Market Analysis, Insights and Forecast - by Component
- 7.2.1. Software
- 7.2.2. Hardware
- 7.2.3. Services
- 7.3. Market Analysis, Insights and Forecast - by Deployment
- 7.3.1. On-Premise
- 7.4. Market Analysis, Insights and Forecast - by En User
- 7.4.1. Hospitals and Clinics
- 7.4.2. Pharmaceutical and Biotechnology Companies
- 7.4.3. Other End Users
- 7.1. Market Analysis, Insights and Forecast - by Type
- 8. Asia Pacific Operational Analytics Software in the Healthcare Industry Analysis, Insights and Forecast, 2019-2031
- 8.1. Market Analysis, Insights and Forecast - by Type
- 8.1.1. Supply Chain Analytics
- 8.1.2. Human Resource Analytics
- 8.1.3. Strategic Analytics
- 8.2. Market Analysis, Insights and Forecast - by Component
- 8.2.1. Software
- 8.2.2. Hardware
- 8.2.3. Services
- 8.3. Market Analysis, Insights and Forecast - by Deployment
- 8.3.1. On-Premise
- 8.4. Market Analysis, Insights and Forecast - by En User
- 8.4.1. Hospitals and Clinics
- 8.4.2. Pharmaceutical and Biotechnology Companies
- 8.4.3. Other End Users
- 8.1. Market Analysis, Insights and Forecast - by Type
- 9. Middle East and Africa Operational Analytics Software in the Healthcare Industry Analysis, Insights and Forecast, 2019-2031
- 9.1. Market Analysis, Insights and Forecast - by Type
- 9.1.1. Supply Chain Analytics
- 9.1.2. Human Resource Analytics
- 9.1.3. Strategic Analytics
- 9.2. Market Analysis, Insights and Forecast - by Component
- 9.2.1. Software
- 9.2.2. Hardware
- 9.2.3. Services
- 9.3. Market Analysis, Insights and Forecast - by Deployment
- 9.3.1. On-Premise
- 9.4. Market Analysis, Insights and Forecast - by En User
- 9.4.1. Hospitals and Clinics
- 9.4.2. Pharmaceutical and Biotechnology Companies
- 9.4.3. Other End Users
- 9.1. Market Analysis, Insights and Forecast - by Type
- 10. South America Operational Analytics Software in the Healthcare Industry Analysis, Insights and Forecast, 2019-2031
- 10.1. Market Analysis, Insights and Forecast - by Type
- 10.1.1. Supply Chain Analytics
- 10.1.2. Human Resource Analytics
- 10.1.3. Strategic Analytics
- 10.2. Market Analysis, Insights and Forecast - by Component
- 10.2.1. Software
- 10.2.2. Hardware
- 10.2.3. Services
- 10.3. Market Analysis, Insights and Forecast - by Deployment
- 10.3.1. On-Premise
- 10.4. Market Analysis, Insights and Forecast - by En User
- 10.4.1. Hospitals and Clinics
- 10.4.2. Pharmaceutical and Biotechnology Companies
- 10.4.3. Other End Users
- 10.1. Market Analysis, Insights and Forecast - by Type
- 11. North America Operational Analytics Software in the Healthcare Industry Analysis, Insights and Forecast, 2019-2031
- 11.1. Market Analysis, Insights and Forecast - By Country/Sub-region
- 11.1.1. undefined
- 12. Europe Operational Analytics Software in the Healthcare Industry Analysis, Insights and Forecast, 2019-2031
- 12.1. Market Analysis, Insights and Forecast - By Country/Sub-region
- 12.1.1. undefined
- 13. Asia Pacific Operational Analytics Software in the Healthcare Industry Analysis, Insights and Forecast, 2019-2031
- 13.1. Market Analysis, Insights and Forecast - By Country/Sub-region
- 13.1.1. undefined
- 14. Middle East and Africa Operational Analytics Software in the Healthcare Industry Analysis, Insights and Forecast, 2019-2031
- 14.1. Market Analysis, Insights and Forecast - By Country/Sub-region
- 14.1.1. undefined
- 15. South America Operational Analytics Software in the Healthcare Industry Analysis, Insights and Forecast, 2019-2031
- 15.1. Market Analysis, Insights and Forecast - By Country/Sub-region
- 15.1.1. undefined
- 16. Competitive Analysis
- 16.1. Global Market Share Analysis 2024
- 16.2. Company Profiles
- 16.2.1 MedeAnalytics Inc
- 16.2.1.1. Overview
- 16.2.1.2. Products
- 16.2.1.3. SWOT Analysis
- 16.2.1.4. Recent Developments
- 16.2.1.5. Financials (Based on Availability)
- 16.2.2 Cotiviti Inc
- 16.2.2.1. Overview
- 16.2.2.2. Products
- 16.2.2.3. SWOT Analysis
- 16.2.2.4. Recent Developments
- 16.2.2.5. Financials (Based on Availability)
- 16.2.3 MERATIVE (IBM Watson)
- 16.2.3.1. Overview
- 16.2.3.2. Products
- 16.2.3.3. SWOT Analysis
- 16.2.3.4. Recent Developments
- 16.2.3.5. Financials (Based on Availability)
- 16.2.4 Oracle Corporation (Cerner Corporation)
- 16.2.4.1. Overview
- 16.2.4.2. Products
- 16.2.4.3. SWOT Analysis
- 16.2.4.4. Recent Developments
- 16.2.4.5. Financials (Based on Availability)
- 16.2.5 Wipro limited
- 16.2.5.1. Overview
- 16.2.5.2. Products
- 16.2.5.3. SWOT Analysis
- 16.2.5.4. Recent Developments
- 16.2.5.5. Financials (Based on Availability)
- 16.2.6 Vizient Inc
- 16.2.6.1. Overview
- 16.2.6.2. Products
- 16.2.6.3. SWOT Analysis
- 16.2.6.4. Recent Developments
- 16.2.6.5. Financials (Based on Availability)
- 16.2.7 Inovalon Inc
- 16.2.7.1. Overview
- 16.2.7.2. Products
- 16.2.7.3. SWOT Analysis
- 16.2.7.4. Recent Developments
- 16.2.7.5. Financials (Based on Availability)
- 16.2.8 Veradigm LLC (Allscripts Healthcare Solutions Inc )
- 16.2.8.1. Overview
- 16.2.8.2. Products
- 16.2.8.3. SWOT Analysis
- 16.2.8.4. Recent Developments
- 16.2.8.5. Financials (Based on Availability)
- 16.2.9 Health Catalyst Inc
- 16.2.9.1. Overview
- 16.2.9.2. Products
- 16.2.9.3. SWOT Analysis
- 16.2.9.4. Recent Developments
- 16.2.9.5. Financials (Based on Availability)
- 16.2.10 CVS Health Corporation
- 16.2.10.1. Overview
- 16.2.10.2. Products
- 16.2.10.3. SWOT Analysis
- 16.2.10.4. Recent Developments
- 16.2.10.5. Financials (Based on Availability)
- 16.2.11 Optum Inc
- 16.2.11.1. Overview
- 16.2.11.2. Products
- 16.2.11.3. SWOT Analysis
- 16.2.11.4. Recent Developments
- 16.2.11.5. Financials (Based on Availability)
- 16.2.12 McKesson Corporation
- 16.2.12.1. Overview
- 16.2.12.2. Products
- 16.2.12.3. SWOT Analysis
- 16.2.12.4. Recent Developments
- 16.2.12.5. Financials (Based on Availability)
- 16.2.1 MedeAnalytics Inc
List of Figures
- Figure 1: Global Operational Analytics Software in the Healthcare Industry Revenue Breakdown (Million, %) by Region 2024 & 2032
- Figure 2: Global Operational Analytics Software in the Healthcare Industry Volume Breakdown (K Unit, %) by Region 2024 & 2032
- Figure 3: North America Operational Analytics Software in the Healthcare Industry Revenue (Million), by Country 2024 & 2032
- Figure 4: North America Operational Analytics Software in the Healthcare Industry Volume (K Unit), by Country 2024 & 2032
- Figure 5: North America Operational Analytics Software in the Healthcare Industry Revenue Share (%), by Country 2024 & 2032
- Figure 6: North America Operational Analytics Software in the Healthcare Industry Volume Share (%), by Country 2024 & 2032
- Figure 7: Europe Operational Analytics Software in the Healthcare Industry Revenue (Million), by Country 2024 & 2032
- Figure 8: Europe Operational Analytics Software in the Healthcare Industry Volume (K Unit), by Country 2024 & 2032
- Figure 9: Europe Operational Analytics Software in the Healthcare Industry Revenue Share (%), by Country 2024 & 2032
- Figure 10: Europe Operational Analytics Software in the Healthcare Industry Volume Share (%), by Country 2024 & 2032
- Figure 11: Asia Pacific Operational Analytics Software in the Healthcare Industry Revenue (Million), by Country 2024 & 2032
- Figure 12: Asia Pacific Operational Analytics Software in the Healthcare Industry Volume (K Unit), by Country 2024 & 2032
- Figure 13: Asia Pacific Operational Analytics Software in the Healthcare Industry Revenue Share (%), by Country 2024 & 2032
- Figure 14: Asia Pacific Operational Analytics Software in the Healthcare Industry Volume Share (%), by Country 2024 & 2032
- Figure 15: Middle East and Africa Operational Analytics Software in the Healthcare Industry Revenue (Million), by Country 2024 & 2032
- Figure 16: Middle East and Africa Operational Analytics Software in the Healthcare Industry Volume (K Unit), by Country 2024 & 2032
- Figure 17: Middle East and Africa Operational Analytics Software in the Healthcare Industry Revenue Share (%), by Country 2024 & 2032
- Figure 18: Middle East and Africa Operational Analytics Software in the Healthcare Industry Volume Share (%), by Country 2024 & 2032
- Figure 19: South America Operational Analytics Software in the Healthcare Industry Revenue (Million), by Country 2024 & 2032
- Figure 20: South America Operational Analytics Software in the Healthcare Industry Volume (K Unit), by Country 2024 & 2032
- Figure 21: South America Operational Analytics Software in the Healthcare Industry Revenue Share (%), by Country 2024 & 2032
- Figure 22: South America Operational Analytics Software in the Healthcare Industry Volume Share (%), by Country 2024 & 2032
- Figure 23: North America Operational Analytics Software in the Healthcare Industry Revenue (Million), by Type 2024 & 2032
- Figure 24: North America Operational Analytics Software in the Healthcare Industry Volume (K Unit), by Type 2024 & 2032
- Figure 25: North America Operational Analytics Software in the Healthcare Industry Revenue Share (%), by Type 2024 & 2032
- Figure 26: North America Operational Analytics Software in the Healthcare Industry Volume Share (%), by Type 2024 & 2032
- Figure 27: North America Operational Analytics Software in the Healthcare Industry Revenue (Million), by Component 2024 & 2032
- Figure 28: North America Operational Analytics Software in the Healthcare Industry Volume (K Unit), by Component 2024 & 2032
- Figure 29: North America Operational Analytics Software in the Healthcare Industry Revenue Share (%), by Component 2024 & 2032
- Figure 30: North America Operational Analytics Software in the Healthcare Industry Volume Share (%), by Component 2024 & 2032
- Figure 31: North America Operational Analytics Software in the Healthcare Industry Revenue (Million), by Deployment 2024 & 2032
- Figure 32: North America Operational Analytics Software in the Healthcare Industry Volume (K Unit), by Deployment 2024 & 2032
- Figure 33: North America Operational Analytics Software in the Healthcare Industry Revenue Share (%), by Deployment 2024 & 2032
- Figure 34: North America Operational Analytics Software in the Healthcare Industry Volume Share (%), by Deployment 2024 & 2032
- Figure 35: North America Operational Analytics Software in the Healthcare Industry Revenue (Million), by En User 2024 & 2032
- Figure 36: North America Operational Analytics Software in the Healthcare Industry Volume (K Unit), by En User 2024 & 2032
- Figure 37: North America Operational Analytics Software in the Healthcare Industry Revenue Share (%), by En User 2024 & 2032
- Figure 38: North America Operational Analytics Software in the Healthcare Industry Volume Share (%), by En User 2024 & 2032
- Figure 39: North America Operational Analytics Software in the Healthcare Industry Revenue (Million), by Country 2024 & 2032
- Figure 40: North America Operational Analytics Software in the Healthcare Industry Volume (K Unit), by Country 2024 & 2032
- Figure 41: North America Operational Analytics Software in the Healthcare Industry Revenue Share (%), by Country 2024 & 2032
- Figure 42: North America Operational Analytics Software in the Healthcare Industry Volume Share (%), by Country 2024 & 2032
- Figure 43: Europe Operational Analytics Software in the Healthcare Industry Revenue (Million), by Type 2024 & 2032
- Figure 44: Europe Operational Analytics Software in the Healthcare Industry Volume (K Unit), by Type 2024 & 2032
- Figure 45: Europe Operational Analytics Software in the Healthcare Industry Revenue Share (%), by Type 2024 & 2032
- Figure 46: Europe Operational Analytics Software in the Healthcare Industry Volume Share (%), by Type 2024 & 2032
- Figure 47: Europe Operational Analytics Software in the Healthcare Industry Revenue (Million), by Component 2024 & 2032
- Figure 48: Europe Operational Analytics Software in the Healthcare Industry Volume (K Unit), by Component 2024 & 2032
- Figure 49: Europe Operational Analytics Software in the Healthcare Industry Revenue Share (%), by Component 2024 & 2032
- Figure 50: Europe Operational Analytics Software in the Healthcare Industry Volume Share (%), by Component 2024 & 2032
- Figure 51: Europe Operational Analytics Software in the Healthcare Industry Revenue (Million), by Deployment 2024 & 2032
- Figure 52: Europe Operational Analytics Software in the Healthcare Industry Volume (K Unit), by Deployment 2024 & 2032
- Figure 53: Europe Operational Analytics Software in the Healthcare Industry Revenue Share (%), by Deployment 2024 & 2032
- Figure 54: Europe Operational Analytics Software in the Healthcare Industry Volume Share (%), by Deployment 2024 & 2032
- Figure 55: Europe Operational Analytics Software in the Healthcare Industry Revenue (Million), by En User 2024 & 2032
- Figure 56: Europe Operational Analytics Software in the Healthcare Industry Volume (K Unit), by En User 2024 & 2032
- Figure 57: Europe Operational Analytics Software in the Healthcare Industry Revenue Share (%), by En User 2024 & 2032
- Figure 58: Europe Operational Analytics Software in the Healthcare Industry Volume Share (%), by En User 2024 & 2032
- Figure 59: Europe Operational Analytics Software in the Healthcare Industry Revenue (Million), by Country 2024 & 2032
- Figure 60: Europe Operational Analytics Software in the Healthcare Industry Volume (K Unit), by Country 2024 & 2032
- Figure 61: Europe Operational Analytics Software in the Healthcare Industry Revenue Share (%), by Country 2024 & 2032
- Figure 62: Europe Operational Analytics Software in the Healthcare Industry Volume Share (%), by Country 2024 & 2032
- Figure 63: Asia Pacific Operational Analytics Software in the Healthcare Industry Revenue (Million), by Type 2024 & 2032
- Figure 64: Asia Pacific Operational Analytics Software in the Healthcare Industry Volume (K Unit), by Type 2024 & 2032
- Figure 65: Asia Pacific Operational Analytics Software in the Healthcare Industry Revenue Share (%), by Type 2024 & 2032
- Figure 66: Asia Pacific Operational Analytics Software in the Healthcare Industry Volume Share (%), by Type 2024 & 2032
- Figure 67: Asia Pacific Operational Analytics Software in the Healthcare Industry Revenue (Million), by Component 2024 & 2032
- Figure 68: Asia Pacific Operational Analytics Software in the Healthcare Industry Volume (K Unit), by Component 2024 & 2032
- Figure 69: Asia Pacific Operational Analytics Software in the Healthcare Industry Revenue Share (%), by Component 2024 & 2032
- Figure 70: Asia Pacific Operational Analytics Software in the Healthcare Industry Volume Share (%), by Component 2024 & 2032
- Figure 71: Asia Pacific Operational Analytics Software in the Healthcare Industry Revenue (Million), by Deployment 2024 & 2032
- Figure 72: Asia Pacific Operational Analytics Software in the Healthcare Industry Volume (K Unit), by Deployment 2024 & 2032
- Figure 73: Asia Pacific Operational Analytics Software in the Healthcare Industry Revenue Share (%), by Deployment 2024 & 2032
- Figure 74: Asia Pacific Operational Analytics Software in the Healthcare Industry Volume Share (%), by Deployment 2024 & 2032
- Figure 75: Asia Pacific Operational Analytics Software in the Healthcare Industry Revenue (Million), by En User 2024 & 2032
- Figure 76: Asia Pacific Operational Analytics Software in the Healthcare Industry Volume (K Unit), by En User 2024 & 2032
- Figure 77: Asia Pacific Operational Analytics Software in the Healthcare Industry Revenue Share (%), by En User 2024 & 2032
- Figure 78: Asia Pacific Operational Analytics Software in the Healthcare Industry Volume Share (%), by En User 2024 & 2032
- Figure 79: Asia Pacific Operational Analytics Software in the Healthcare Industry Revenue (Million), by Country 2024 & 2032
- Figure 80: Asia Pacific Operational Analytics Software in the Healthcare Industry Volume (K Unit), by Country 2024 & 2032
- Figure 81: Asia Pacific Operational Analytics Software in the Healthcare Industry Revenue Share (%), by Country 2024 & 2032
- Figure 82: Asia Pacific Operational Analytics Software in the Healthcare Industry Volume Share (%), by Country 2024 & 2032
- Figure 83: Middle East and Africa Operational Analytics Software in the Healthcare Industry Revenue (Million), by Type 2024 & 2032
- Figure 84: Middle East and Africa Operational Analytics Software in the Healthcare Industry Volume (K Unit), by Type 2024 & 2032
- Figure 85: Middle East and Africa Operational Analytics Software in the Healthcare Industry Revenue Share (%), by Type 2024 & 2032
- Figure 86: Middle East and Africa Operational Analytics Software in the Healthcare Industry Volume Share (%), by Type 2024 & 2032
- Figure 87: Middle East and Africa Operational Analytics Software in the Healthcare Industry Revenue (Million), by Component 2024 & 2032
- Figure 88: Middle East and Africa Operational Analytics Software in the Healthcare Industry Volume (K Unit), by Component 2024 & 2032
- Figure 89: Middle East and Africa Operational Analytics Software in the Healthcare Industry Revenue Share (%), by Component 2024 & 2032
- Figure 90: Middle East and Africa Operational Analytics Software in the Healthcare Industry Volume Share (%), by Component 2024 & 2032
- Figure 91: Middle East and Africa Operational Analytics Software in the Healthcare Industry Revenue (Million), by Deployment 2024 & 2032
- Figure 92: Middle East and Africa Operational Analytics Software in the Healthcare Industry Volume (K Unit), by Deployment 2024 & 2032
- Figure 93: Middle East and Africa Operational Analytics Software in the Healthcare Industry Revenue Share (%), by Deployment 2024 & 2032
- Figure 94: Middle East and Africa Operational Analytics Software in the Healthcare Industry Volume Share (%), by Deployment 2024 & 2032
- Figure 95: Middle East and Africa Operational Analytics Software in the Healthcare Industry Revenue (Million), by En User 2024 & 2032
- Figure 96: Middle East and Africa Operational Analytics Software in the Healthcare Industry Volume (K Unit), by En User 2024 & 2032
- Figure 97: Middle East and Africa Operational Analytics Software in the Healthcare Industry Revenue Share (%), by En User 2024 & 2032
- Figure 98: Middle East and Africa Operational Analytics Software in the Healthcare Industry Volume Share (%), by En User 2024 & 2032
- Figure 99: Middle East and Africa Operational Analytics Software in the Healthcare Industry Revenue (Million), by Country 2024 & 2032
- Figure 100: Middle East and Africa Operational Analytics Software in the Healthcare Industry Volume (K Unit), by Country 2024 & 2032
- Figure 101: Middle East and Africa Operational Analytics Software in the Healthcare Industry Revenue Share (%), by Country 2024 & 2032
- Figure 102: Middle East and Africa Operational Analytics Software in the Healthcare Industry Volume Share (%), by Country 2024 & 2032
- Figure 103: South America Operational Analytics Software in the Healthcare Industry Revenue (Million), by Type 2024 & 2032
- Figure 104: South America Operational Analytics Software in the Healthcare Industry Volume (K Unit), by Type 2024 & 2032
- Figure 105: South America Operational Analytics Software in the Healthcare Industry Revenue Share (%), by Type 2024 & 2032
- Figure 106: South America Operational Analytics Software in the Healthcare Industry Volume Share (%), by Type 2024 & 2032
- Figure 107: South America Operational Analytics Software in the Healthcare Industry Revenue (Million), by Component 2024 & 2032
- Figure 108: South America Operational Analytics Software in the Healthcare Industry Volume (K Unit), by Component 2024 & 2032
- Figure 109: South America Operational Analytics Software in the Healthcare Industry Revenue Share (%), by Component 2024 & 2032
- Figure 110: South America Operational Analytics Software in the Healthcare Industry Volume Share (%), by Component 2024 & 2032
- Figure 111: South America Operational Analytics Software in the Healthcare Industry Revenue (Million), by Deployment 2024 & 2032
- Figure 112: South America Operational Analytics Software in the Healthcare Industry Volume (K Unit), by Deployment 2024 & 2032
- Figure 113: South America Operational Analytics Software in the Healthcare Industry Revenue Share (%), by Deployment 2024 & 2032
- Figure 114: South America Operational Analytics Software in the Healthcare Industry Volume Share (%), by Deployment 2024 & 2032
- Figure 115: South America Operational Analytics Software in the Healthcare Industry Revenue (Million), by En User 2024 & 2032
- Figure 116: South America Operational Analytics Software in the Healthcare Industry Volume (K Unit), by En User 2024 & 2032
- Figure 117: South America Operational Analytics Software in the Healthcare Industry Revenue Share (%), by En User 2024 & 2032
- Figure 118: South America Operational Analytics Software in the Healthcare Industry Volume Share (%), by En User 2024 & 2032
- Figure 119: South America Operational Analytics Software in the Healthcare Industry Revenue (Million), by Country 2024 & 2032
- Figure 120: South America Operational Analytics Software in the Healthcare Industry Volume (K Unit), by Country 2024 & 2032
- Figure 121: South America Operational Analytics Software in the Healthcare Industry Revenue Share (%), by Country 2024 & 2032
- Figure 122: South America Operational Analytics Software in the Healthcare Industry Volume Share (%), by Country 2024 & 2032
List of Tables
- Table 1: Global Operational Analytics Software in the Healthcare Industry Revenue Million Forecast, by Region 2019 & 2032
- Table 2: Global Operational Analytics Software in the Healthcare Industry Volume K Unit Forecast, by Region 2019 & 2032
- Table 3: Global Operational Analytics Software in the Healthcare Industry Revenue Million Forecast, by Type 2019 & 2032
- Table 4: Global Operational Analytics Software in the Healthcare Industry Volume K Unit Forecast, by Type 2019 & 2032
- Table 5: Global Operational Analytics Software in the Healthcare Industry Revenue Million Forecast, by Component 2019 & 2032
- Table 6: Global Operational Analytics Software in the Healthcare Industry Volume K Unit Forecast, by Component 2019 & 2032
- Table 7: Global Operational Analytics Software in the Healthcare Industry Revenue Million Forecast, by Deployment 2019 & 2032
- Table 8: Global Operational Analytics Software in the Healthcare Industry Volume K Unit Forecast, by Deployment 2019 & 2032
- Table 9: Global Operational Analytics Software in the Healthcare Industry Revenue Million Forecast, by En User 2019 & 2032
- Table 10: Global Operational Analytics Software in the Healthcare Industry Volume K Unit Forecast, by En User 2019 & 2032
- Table 11: Global Operational Analytics Software in the Healthcare Industry Revenue Million Forecast, by Region 2019 & 2032
- Table 12: Global Operational Analytics Software in the Healthcare Industry Volume K Unit Forecast, by Region 2019 & 2032
- Table 13: Global Operational Analytics Software in the Healthcare Industry Revenue Million Forecast, by Country 2019 & 2032
- Table 14: Global Operational Analytics Software in the Healthcare Industry Volume K Unit Forecast, by Country 2019 & 2032
- Table 15: Global Operational Analytics Software in the Healthcare Industry Revenue Million Forecast, by Country 2019 & 2032
- Table 16: Global Operational Analytics Software in the Healthcare Industry Volume K Unit Forecast, by Country 2019 & 2032
- Table 17: Global Operational Analytics Software in the Healthcare Industry Revenue Million Forecast, by Country 2019 & 2032
- Table 18: Global Operational Analytics Software in the Healthcare Industry Volume K Unit Forecast, by Country 2019 & 2032
- Table 19: Global Operational Analytics Software in the Healthcare Industry Revenue Million Forecast, by Country 2019 & 2032
- Table 20: Global Operational Analytics Software in the Healthcare Industry Volume K Unit Forecast, by Country 2019 & 2032
- Table 21: Global Operational Analytics Software in the Healthcare Industry Revenue Million Forecast, by Country 2019 & 2032
- Table 22: Global Operational Analytics Software in the Healthcare Industry Volume K Unit Forecast, by Country 2019 & 2032
- Table 23: Global Operational Analytics Software in the Healthcare Industry Revenue Million Forecast, by Type 2019 & 2032
- Table 24: Global Operational Analytics Software in the Healthcare Industry Volume K Unit Forecast, by Type 2019 & 2032
- Table 25: Global Operational Analytics Software in the Healthcare Industry Revenue Million Forecast, by Component 2019 & 2032
- Table 26: Global Operational Analytics Software in the Healthcare Industry Volume K Unit Forecast, by Component 2019 & 2032
- Table 27: Global Operational Analytics Software in the Healthcare Industry Revenue Million Forecast, by Deployment 2019 & 2032
- Table 28: Global Operational Analytics Software in the Healthcare Industry Volume K Unit Forecast, by Deployment 2019 & 2032
- Table 29: Global Operational Analytics Software in the Healthcare Industry Revenue Million Forecast, by En User 2019 & 2032
- Table 30: Global Operational Analytics Software in the Healthcare Industry Volume K Unit Forecast, by En User 2019 & 2032
- Table 31: Global Operational Analytics Software in the Healthcare Industry Revenue Million Forecast, by Country 2019 & 2032
- Table 32: Global Operational Analytics Software in the Healthcare Industry Volume K Unit Forecast, by Country 2019 & 2032
- Table 33: United States Operational Analytics Software in the Healthcare Industry Revenue (Million) Forecast, by Application 2019 & 2032
- Table 34: United States Operational Analytics Software in the Healthcare Industry Volume (K Unit) Forecast, by Application 2019 & 2032
- Table 35: Canada Operational Analytics Software in the Healthcare Industry Revenue (Million) Forecast, by Application 2019 & 2032
- Table 36: Canada Operational Analytics Software in the Healthcare Industry Volume (K Unit) Forecast, by Application 2019 & 2032
- Table 37: Mexico Operational Analytics Software in the Healthcare Industry Revenue (Million) Forecast, by Application 2019 & 2032
- Table 38: Mexico Operational Analytics Software in the Healthcare Industry Volume (K Unit) Forecast, by Application 2019 & 2032
- Table 39: Global Operational Analytics Software in the Healthcare Industry Revenue Million Forecast, by Type 2019 & 2032
- Table 40: Global Operational Analytics Software in the Healthcare Industry Volume K Unit Forecast, by Type 2019 & 2032
- Table 41: Global Operational Analytics Software in the Healthcare Industry Revenue Million Forecast, by Component 2019 & 2032
- Table 42: Global Operational Analytics Software in the Healthcare Industry Volume K Unit Forecast, by Component 2019 & 2032
- Table 43: Global Operational Analytics Software in the Healthcare Industry Revenue Million Forecast, by Deployment 2019 & 2032
- Table 44: Global Operational Analytics Software in the Healthcare Industry Volume K Unit Forecast, by Deployment 2019 & 2032
- Table 45: Global Operational Analytics Software in the Healthcare Industry Revenue Million Forecast, by En User 2019 & 2032
- Table 46: Global Operational Analytics Software in the Healthcare Industry Volume K Unit Forecast, by En User 2019 & 2032
- Table 47: Global Operational Analytics Software in the Healthcare Industry Revenue Million Forecast, by Country 2019 & 2032
- Table 48: Global Operational Analytics Software in the Healthcare Industry Volume K Unit Forecast, by Country 2019 & 2032
- Table 49: Germany Operational Analytics Software in the Healthcare Industry Revenue (Million) Forecast, by Application 2019 & 2032
- Table 50: Germany Operational Analytics Software in the Healthcare Industry Volume (K Unit) Forecast, by Application 2019 & 2032
- Table 51: United Kingdom Operational Analytics Software in the Healthcare Industry Revenue (Million) Forecast, by Application 2019 & 2032
- Table 52: United Kingdom Operational Analytics Software in the Healthcare Industry Volume (K Unit) Forecast, by Application 2019 & 2032
- Table 53: France Operational Analytics Software in the Healthcare Industry Revenue (Million) Forecast, by Application 2019 & 2032
- Table 54: France Operational Analytics Software in the Healthcare Industry Volume (K Unit) Forecast, by Application 2019 & 2032
- Table 55: Italy Operational Analytics Software in the Healthcare Industry Revenue (Million) Forecast, by Application 2019 & 2032
- Table 56: Italy Operational Analytics Software in the Healthcare Industry Volume (K Unit) Forecast, by Application 2019 & 2032
- Table 57: Spain Operational Analytics Software in the Healthcare Industry Revenue (Million) Forecast, by Application 2019 & 2032
- Table 58: Spain Operational Analytics Software in the Healthcare Industry Volume (K Unit) Forecast, by Application 2019 & 2032
- Table 59: Rest of Europe Operational Analytics Software in the Healthcare Industry Revenue (Million) Forecast, by Application 2019 & 2032
- Table 60: Rest of Europe Operational Analytics Software in the Healthcare Industry Volume (K Unit) Forecast, by Application 2019 & 2032
- Table 61: Global Operational Analytics Software in the Healthcare Industry Revenue Million Forecast, by Type 2019 & 2032
- Table 62: Global Operational Analytics Software in the Healthcare Industry Volume K Unit Forecast, by Type 2019 & 2032
- Table 63: Global Operational Analytics Software in the Healthcare Industry Revenue Million Forecast, by Component 2019 & 2032
- Table 64: Global Operational Analytics Software in the Healthcare Industry Volume K Unit Forecast, by Component 2019 & 2032
- Table 65: Global Operational Analytics Software in the Healthcare Industry Revenue Million Forecast, by Deployment 2019 & 2032
- Table 66: Global Operational Analytics Software in the Healthcare Industry Volume K Unit Forecast, by Deployment 2019 & 2032
- Table 67: Global Operational Analytics Software in the Healthcare Industry Revenue Million Forecast, by En User 2019 & 2032
- Table 68: Global Operational Analytics Software in the Healthcare Industry Volume K Unit Forecast, by En User 2019 & 2032
- Table 69: Global Operational Analytics Software in the Healthcare Industry Revenue Million Forecast, by Country 2019 & 2032
- Table 70: Global Operational Analytics Software in the Healthcare Industry Volume K Unit Forecast, by Country 2019 & 2032
- Table 71: China Operational Analytics Software in the Healthcare Industry Revenue (Million) Forecast, by Application 2019 & 2032
- Table 72: China Operational Analytics Software in the Healthcare Industry Volume (K Unit) Forecast, by Application 2019 & 2032
- Table 73: Japan Operational Analytics Software in the Healthcare Industry Revenue (Million) Forecast, by Application 2019 & 2032
- Table 74: Japan Operational Analytics Software in the Healthcare Industry Volume (K Unit) Forecast, by Application 2019 & 2032
- Table 75: India Operational Analytics Software in the Healthcare Industry Revenue (Million) Forecast, by Application 2019 & 2032
- Table 76: India Operational Analytics Software in the Healthcare Industry Volume (K Unit) Forecast, by Application 2019 & 2032
- Table 77: Australia Operational Analytics Software in the Healthcare Industry Revenue (Million) Forecast, by Application 2019 & 2032
- Table 78: Australia Operational Analytics Software in the Healthcare Industry Volume (K Unit) Forecast, by Application 2019 & 2032
- Table 79: South Korea Operational Analytics Software in the Healthcare Industry Revenue (Million) Forecast, by Application 2019 & 2032
- Table 80: South Korea Operational Analytics Software in the Healthcare Industry Volume (K Unit) Forecast, by Application 2019 & 2032
- Table 81: Rest of Asia Pacific Operational Analytics Software in the Healthcare Industry Revenue (Million) Forecast, by Application 2019 & 2032
- Table 82: Rest of Asia Pacific Operational Analytics Software in the Healthcare Industry Volume (K Unit) Forecast, by Application 2019 & 2032
- Table 83: Global Operational Analytics Software in the Healthcare Industry Revenue Million Forecast, by Type 2019 & 2032
- Table 84: Global Operational Analytics Software in the Healthcare Industry Volume K Unit Forecast, by Type 2019 & 2032
- Table 85: Global Operational Analytics Software in the Healthcare Industry Revenue Million Forecast, by Component 2019 & 2032
- Table 86: Global Operational Analytics Software in the Healthcare Industry Volume K Unit Forecast, by Component 2019 & 2032
- Table 87: Global Operational Analytics Software in the Healthcare Industry Revenue Million Forecast, by Deployment 2019 & 2032
- Table 88: Global Operational Analytics Software in the Healthcare Industry Volume K Unit Forecast, by Deployment 2019 & 2032
- Table 89: Global Operational Analytics Software in the Healthcare Industry Revenue Million Forecast, by En User 2019 & 2032
- Table 90: Global Operational Analytics Software in the Healthcare Industry Volume K Unit Forecast, by En User 2019 & 2032
- Table 91: Global Operational Analytics Software in the Healthcare Industry Revenue Million Forecast, by Country 2019 & 2032
- Table 92: Global Operational Analytics Software in the Healthcare Industry Volume K Unit Forecast, by Country 2019 & 2032
- Table 93: GCC Operational Analytics Software in the Healthcare Industry Revenue (Million) Forecast, by Application 2019 & 2032
- Table 94: GCC Operational Analytics Software in the Healthcare Industry Volume (K Unit) Forecast, by Application 2019 & 2032
- Table 95: South Africa Operational Analytics Software in the Healthcare Industry Revenue (Million) Forecast, by Application 2019 & 2032
- Table 96: South Africa Operational Analytics Software in the Healthcare Industry Volume (K Unit) Forecast, by Application 2019 & 2032
- Table 97: Rest of Middle East and Africa Operational Analytics Software in the Healthcare Industry Revenue (Million) Forecast, by Application 2019 & 2032
- Table 98: Rest of Middle East and Africa Operational Analytics Software in the Healthcare Industry Volume (K Unit) Forecast, by Application 2019 & 2032
- Table 99: Global Operational Analytics Software in the Healthcare Industry Revenue Million Forecast, by Type 2019 & 2032
- Table 100: Global Operational Analytics Software in the Healthcare Industry Volume K Unit Forecast, by Type 2019 & 2032
- Table 101: Global Operational Analytics Software in the Healthcare Industry Revenue Million Forecast, by Component 2019 & 2032
- Table 102: Global Operational Analytics Software in the Healthcare Industry Volume K Unit Forecast, by Component 2019 & 2032
- Table 103: Global Operational Analytics Software in the Healthcare Industry Revenue Million Forecast, by Deployment 2019 & 2032
- Table 104: Global Operational Analytics Software in the Healthcare Industry Volume K Unit Forecast, by Deployment 2019 & 2032
- Table 105: Global Operational Analytics Software in the Healthcare Industry Revenue Million Forecast, by En User 2019 & 2032
- Table 106: Global Operational Analytics Software in the Healthcare Industry Volume K Unit Forecast, by En User 2019 & 2032
- Table 107: Global Operational Analytics Software in the Healthcare Industry Revenue Million Forecast, by Country 2019 & 2032
- Table 108: Global Operational Analytics Software in the Healthcare Industry Volume K Unit Forecast, by Country 2019 & 2032
- Table 109: Brazil Operational Analytics Software in the Healthcare Industry Revenue (Million) Forecast, by Application 2019 & 2032
- Table 110: Brazil Operational Analytics Software in the Healthcare Industry Volume (K Unit) Forecast, by Application 2019 & 2032
- Table 111: Argentina Operational Analytics Software in the Healthcare Industry Revenue (Million) Forecast, by Application 2019 & 2032
- Table 112: Argentina Operational Analytics Software in the Healthcare Industry Volume (K Unit) Forecast, by Application 2019 & 2032
- Table 113: Rest of South America Operational Analytics Software in the Healthcare Industry Revenue (Million) Forecast, by Application 2019 & 2032
- Table 114: Rest of South America Operational Analytics Software in the Healthcare Industry Volume (K Unit) Forecast, by Application 2019 & 2032
Frequently Asked Questions
1. What is the projected Compound Annual Growth Rate (CAGR) of the Operational Analytics Software in the Healthcare Industry?
The projected CAGR is approximately 13.38%.
2. Which companies are prominent players in the Operational Analytics Software in the Healthcare Industry?
Key companies in the market include MedeAnalytics Inc, Cotiviti Inc, MERATIVE (IBM Watson), Oracle Corporation (Cerner Corporation), Wipro limited, Vizient Inc, Inovalon Inc , Veradigm LLC (Allscripts Healthcare Solutions Inc ), Health Catalyst Inc, CVS Health Corporation, Optum Inc, McKesson Corporation.
3. What are the main segments of the Operational Analytics Software in the Healthcare Industry?
The market segments include Type, Component, Deployment, En User.
4. Can you provide details about the market size?
The market size is estimated to be USD 12.13 Million as of 2022.
5. What are some drivers contributing to market growth?
Increasing Demand for Value-Based Care (VBC); Rising Need to Analyze the Collected Healthcare Data; Rising Awareness regarding Healthcare Standards and Improving Technologies.
6. What are the notable trends driving market growth?
Software Component is Expected to Witness Significant Growth Over a Forecast Period..
7. Are there any restraints impacting market growth?
Concerns regarding Data Privacy and Security; Lack of Trained IT Professionals in Healthcare.
8. Can you provide examples of recent developments in the market?
August 2023: M3, Inc. acquired FrogwellCorporation, which is a Salesforce consulting service provider. M3 is a specialized web portal for medical professionals that delivers healthcare-related information to its 320,000+ physician members in Japan.
9. What pricing options are available for accessing the report?
Pricing options include single-user, multi-user, and enterprise licenses priced at USD 4750, USD 5250, and USD 8750 respectively.
10. Is the market size provided in terms of value or volume?
The market size is provided in terms of value, measured in Million and volume, measured in K Unit.
11. Are there any specific market keywords associated with the report?
Yes, the market keyword associated with the report is "Operational Analytics Software in the Healthcare Industry," which aids in identifying and referencing the specific market segment covered.
12. How do I determine which pricing option suits my needs best?
The pricing options vary based on user requirements and access needs. Individual users may opt for single-user licenses, while businesses requiring broader access may choose multi-user or enterprise licenses for cost-effective access to the report.
13. Are there any additional resources or data provided in the Operational Analytics Software in the Healthcare Industry report?
While the report offers comprehensive insights, it's advisable to review the specific contents or supplementary materials provided to ascertain if additional resources or data are available.
14. How can I stay updated on further developments or reports in the Operational Analytics Software in the Healthcare Industry?
To stay informed about further developments, trends, and reports in the Operational Analytics Software in the Healthcare Industry, consider subscribing to industry newsletters, following relevant companies and organizations, or regularly checking reputable industry news sources and publications.
Methodology
Step 1 - Identification of Relevant Samples Size from Population Database


Step 2 - Approaches for Defining Global Market Size (Value, Volume* & Price*)

Note*: In applicable scenarios
Step 3 - Data Sources
Primary Research
- Web Analytics
- Survey Reports
- Research Institute
- Latest Research Reports
- Opinion Leaders
Secondary Research
- Annual Reports
- White Paper
- Latest Press Release
- Industry Association
- Paid Database
- Investor Presentations

Step 4 - Data Triangulation
Involves using different sources of information in order to increase the validity of a study
These sources are likely to be stakeholders in a program - participants, other researchers, program staff, other community members, and so on.
Then we put all data in single framework & apply various statistical tools to find out the dynamic on the market.
During the analysis stage, feedback from the stakeholder groups would be compared to determine areas of agreement as well as areas of divergence
