

Key Insights
The North American printed signage market, encompassing diverse applications such as billboards, backlit displays, and banners, demonstrates a stable yet dynamic sector. While the Compound Annual Growth Rate (CAGR) is projected at 2.01%, this figure may indicate underlying segmentation shifts rather than outright stagnation. The market size is estimated at $41.86 billion in the base year 2025, driven by sustained demand from key verticals including retail, BFSI, and entertainment. These sectors leverage impactful visual communication for brand reinforcement and customer engagement, propelling the need for both indoor and outdoor signage solutions. Key industry advancements include the increasing integration of digital printing for enhanced customization and operational efficiency, alongside a growing preference for sustainable and eco-friendly signage materials. However, market expansion is tempered by economic uncertainties affecting advertising expenditures and the competitive pressure from digital advertising platforms. The market is bifurcated by product type, signage placement, end-user industry, and geographical distribution, with the United States and Canada holding dominant market shares. Future growth is anticipated to stem from innovations in materials science and printing technologies, enabling more compelling and visually engaging signage. Regional market dynamics are influenced by local economic conditions and regulatory frameworks.
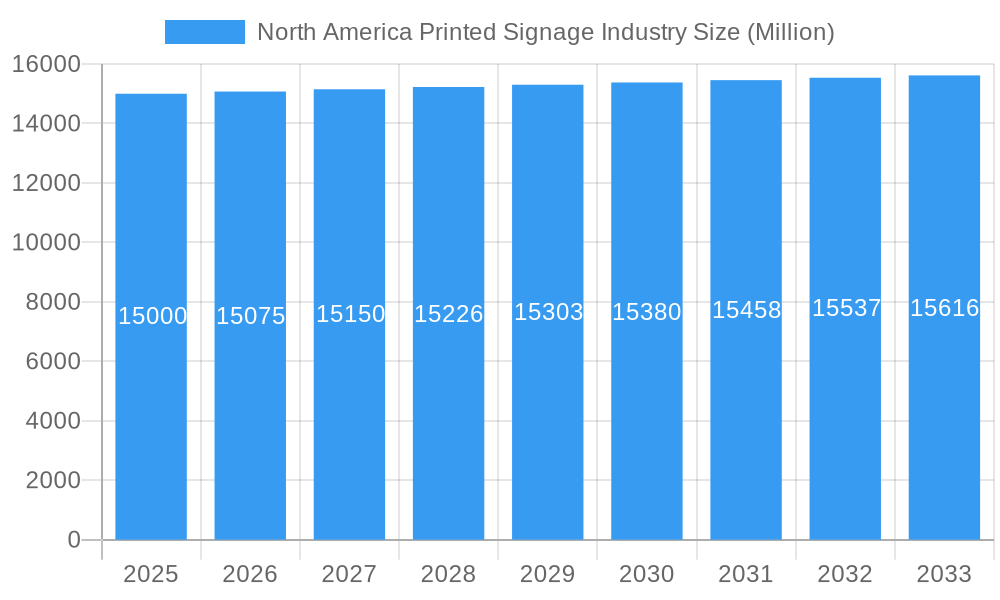
North America Printed Signage Industry Market Size (In Billion)
The competitive environment features a blend of prominent national enterprises and specialized regional providers. Major corporations, such as Avery Dennison, utilize their established brand equity and comprehensive product offerings to secure substantial market positions. Niche players often differentiate through specialized services or targeted geographic focus. This competitive landscape suggests a robust market with a notable degree of consolidation among leading entities. Sustained growth hinges on adaptability to evolving consumer preferences, strategic adoption of technological advancements, and the implementation of sustainable practices to appeal to environmentally conscious clientele. Adherence to outdoor signage regulations and responsible material sourcing will be crucial for continued success within this industry segment.
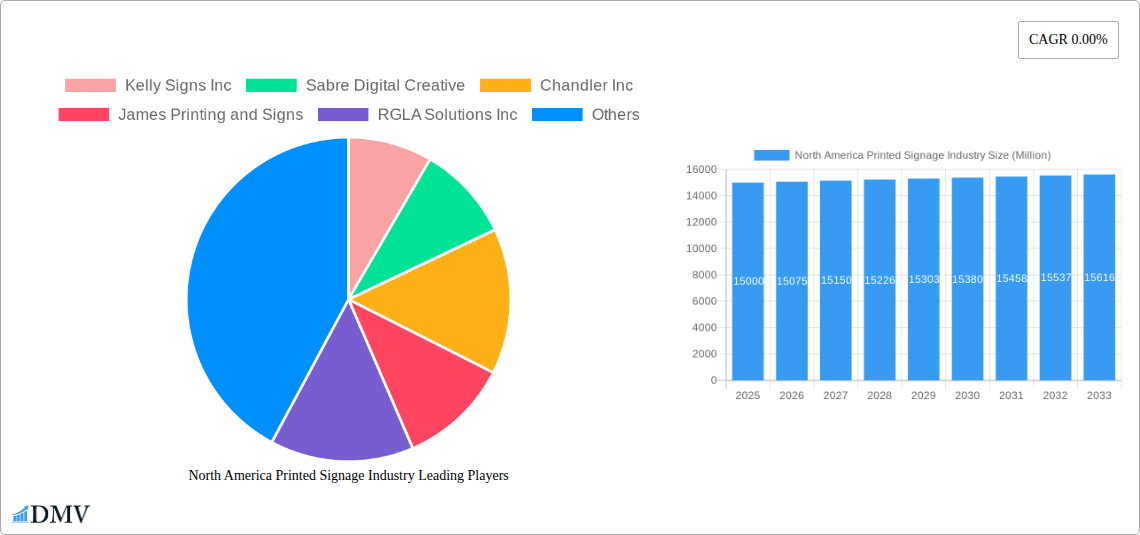
North America Printed Signage Industry Company Market Share
North America Printed Signage Industry Report: 2019-2033
This comprehensive report provides an in-depth analysis of the North America printed signage industry, offering invaluable insights for stakeholders seeking to navigate this dynamic market. Covering the period from 2019 to 2033, with a focus on 2025, this study unveils market trends, competitive landscapes, and future growth potential. The report segments the market by product (billboard, backlit display, pop display, banner, flag, backdrop, corporate graphics, exhibition & trade show materials, other products), type (indoor, outdoor), end-user vertical (BFSI, retail, sports & leisure, entertainment, transportation & logistics, healthcare, others), and country (United States, Canada). The total market value is projected to reach xx Million by 2033.
North America Printed Signage Industry Market Composition & Trends
This section meticulously examines the North American printed signage market's structure and evolution. We delve into market concentration, identifying key players and their respective market share. The report analyzes innovation catalysts, such as advancements in printing technology and digital design tools, and explores the regulatory landscape impacting the industry. The influence of substitute products, including digital signage and other forms of advertising, is assessed. Detailed end-user profiles provide a granular understanding of market demands across diverse sectors. Furthermore, the report investigates mergers and acquisitions (M&A) activities, providing insights into deal values and their impact on market consolidation. Key metrics such as market share distribution across leading companies (including Kelly Signs Inc, Sabre Digital Creative, Chandler Inc, James Printing and Signs, RGLA Solutions Inc, Accel Group Inc, Vistaprint, AJ Printing & Graphics Inc, Avery Dennison Corporation, and Southwest Printing Co) and M&A deal values (estimated at xx Million in total during 2019-2024) are included. The fragmented nature of the market is analyzed, highlighting opportunities for consolidation and growth through strategic partnerships. Finally, the report examines the impact of evolving consumer preferences on the design and production of signage, such as the increased demand for sustainable and eco-friendly materials.
North America Printed Signage Industry Industry Evolution
This section provides a detailed historical and projected analysis of the North America printed signage industry's evolution, focusing on market growth trajectories and key influencing factors. We analyze historical growth rates from 2019 to 2024 and provide a detailed forecast for 2025 to 2033. The report examines technological advancements, including the rise of large-format digital printing, 3D printing capabilities for signage, and the integration of smart technologies. Shifting consumer demands, including a growing preference for customized and interactive signage solutions, are comprehensively addressed. Specific data points, such as compound annual growth rates (CAGR) and adoption rates of new technologies, will be presented to illustrate the industry's dynamic evolution. The impact of macroeconomic factors, such as economic fluctuations and consumer spending patterns, on market growth are also discussed. The influence of e-commerce and the changing retail landscape on the printed signage market are explored, along with the adaptation of signage companies to these changes. The report further analyzes the effects of sustainability concerns and the adoption of eco-friendly printing methods and materials.
Leading Regions, Countries, or Segments in North America Printed Signage Industry
This section identifies the dominant regions, countries, and segments within the North American printed signage market. Detailed analysis will pinpoint the leading segments by product, type, and end-user vertical.
- By Product: The report determines the market share dominance across billboards, backlit displays, pop displays, banners, flags, backdrops, corporate graphics, exhibition and trade show materials, and other products. The analysis considers factors driving the success of each segment.
- By Type: The report identifies the leading market segment between indoor and outdoor printed signage, explaining the factors contributing to this dominance (e.g., regulatory environment, consumer preference, cost-effectiveness).
- By End-user Vertical: This section analyzes the leading end-user verticals for printed signage (BFSI, Retail, Sports and Leisure, Entertainment, Transportation and Logistics, Healthcare, and Others), identifying the key factors driving demand within each sector. The analysis will explore factors such as investment trends, regulatory support, and industry-specific requirements.
- By Country: A detailed comparison of the United States and Canada printed signage markets is provided. Factors contributing to the dominance of one country over the other will be thoroughly investigated.
North America Printed Signage Industry Product Innovations
This section highlights recent product innovations, applications, and performance metrics within the North American printed signage industry. We will discuss the unique selling propositions of new products and analyze the technological advancements driving these innovations. The focus will be on improvements in materials (e.g., durable, weather-resistant, eco-friendly options), printing techniques (e.g., high-resolution printing, enhanced color accuracy), and design elements (e.g., interactive displays, augmented reality integration).
Propelling Factors for North America Printed Signage Industry Growth
Several key factors are driving the growth of the North American printed signage industry. Technological advancements, such as the development of more durable and visually appealing materials and the adoption of digital printing technologies, are significantly contributing to market expansion. Economic factors, such as increasing investment in retail and advertising, are also fueling growth. Furthermore, favorable regulatory policies and initiatives promoting outdoor advertising are positively impacting the market.
Obstacles in the North America Printed Signage Industry Market
The North American printed signage industry faces several challenges. Regulatory hurdles, such as restrictions on outdoor advertising in certain areas, can limit growth. Supply chain disruptions, particularly in the sourcing of raw materials, can lead to production delays and increased costs. Intense competition among established players and new entrants creates price pressures and affects profitability. These factors can collectively impact market expansion and create hurdles for smaller businesses in the sector.
Future Opportunities in North America Printed Signage Industry
The North American printed signage industry presents significant future opportunities. Expanding into new markets, particularly in emerging economies within North America, offers considerable potential. The development and adoption of new technologies, such as augmented reality (AR) and virtual reality (VR) signage, presents lucrative avenues for growth. Moreover, emerging consumer trends, such as increasing demand for personalized and sustainable signage solutions, provide avenues for innovation and market expansion.
Major Players in the North America Printed Signage Industry Ecosystem
- Kelly Signs Inc
- Sabre Digital Creative
- Chandler Inc
- James Printing and Signs
- RGLA Solutions Inc
- Accel Group Inc
- Vistaprint
- AJ Printing & Graphics Inc
- Avery Dennison Corporation
- Southwest Printing Co
Key Developments in North America Printed Signage Industry Industry
- [Month, Year]: [Development - e.g., Launch of a new eco-friendly signage material by Avery Dennison] – impact on market [e.g., increased demand for sustainable signage]
- [Month, Year]: [Development - e.g., Merger between two regional signage companies] – impact on market [e.g., increased market consolidation]
- [Month, Year]: [Development - e.g., Introduction of a new large format digital printer] – impact on market [e.g., improved print quality and reduced production time]
- … (Further developments will be listed in the full report)
Strategic North America Printed Signage Industry Market Forecast
The North America printed signage industry is poised for continued growth, driven by technological advancements, increasing demand for innovative signage solutions, and favorable economic conditions. Future opportunities lie in the adoption of sustainable materials, the integration of digital technologies, and expansion into new market segments. The market is expected to witness significant growth in the coming years, with a positive outlook for key players who adapt to changing market dynamics and embrace innovation.
North America Printed Signage Industry Segmentation
-
1. Product
- 1.1. Billboard
- 1.2. Backlit Display
- 1.3. Pop Display
- 1.4. Banner, Flag, and Backdrop
- 1.5. Corporat
- 1.6. Other Products
-
2. Type
- 2.1. Indoor Printed Signage
- 2.2. Outdoor Printed Signage
-
3. End-user Vertical
- 3.1. BFSI
- 3.2. Retail
- 3.3. Sports and Leisure
- 3.4. Entertainment
- 3.5. Transportation and Logistics
- 3.6. Healthcare
- 3.7. Other End-user Verticals
North America Printed Signage Industry Segmentation By Geography
-
1. North America
- 1.1. United States
- 1.2. Canada
- 1.3. Mexico
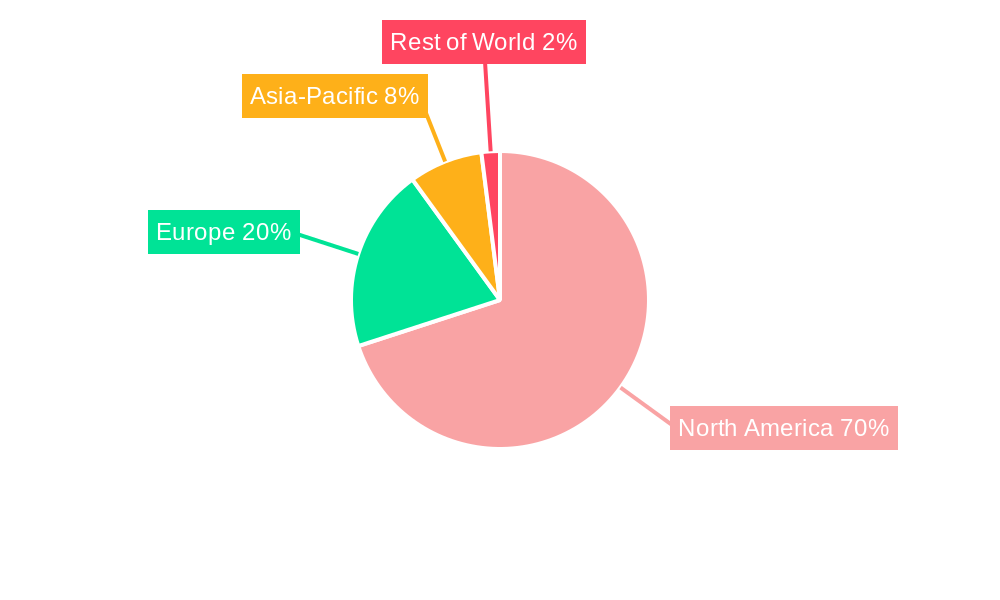
North America Printed Signage Industry Regional Market Share
Geographic Coverage of North America Printed Signage Industry
North America Printed Signage Industry REPORT HIGHLIGHTS
| Aspects | Details |
|---|---|
| Study Period | 2020-2034 |
| Base Year | 2025 |
| Estimated Year | 2026 |
| Forecast Period | 2026-2034 |
| Historical Period | 2020-2025 |
| Growth Rate | CAGR of 2.01% from 2020-2034 |
| Segmentation |
|
Table of Contents
- 1. Introduction
- 1.1. Research Scope
- 1.2. Market Segmentation
- 1.3. Research Objective
- 1.4. Definitions and Assumptions
- 2. Executive Summary
- 2.1. Market Snapshot
- 3. Market Dynamics
- 3.1. Market Drivers
- 3.2. Market Restrains
- 3.3. Market Trends
- 3.4. Market Opportunities
- 4. Market Factor Analysis
- 4.1. Porters Five Forces
- 4.1.1. Bargaining Power of Suppliers
- 4.1.2. Bargaining Power of Buyers
- 4.1.3. Threat of New Entrants
- 4.1.4. Threat of Substitutes
- 4.1.5. Competitive Rivalry
- 4.2. PESTEL analysis
- 4.3. BCG Analysis
- 4.3.1. Stars (High Growth, High Market Share)
- 4.3.2. Cash Cows (Low Growth, High Market Share)
- 4.3.3. Question Mark (High Growth, Low Market Share)
- 4.3.4. Dogs (Low Growth, Low Market Share)
- 4.4. Ansoff Matrix Analysis
- 4.5. Supply Chain Analysis
- 4.6. Regulatory Landscape
- 4.7. Current Market Potential and Opportunity Assessment (TAM–SAM–SOM Framework)
- 4.8. DMV Analyst Note
- 4.1. Porters Five Forces
- 5. Market Analysis, Insights and Forecast 2021-2033
- 5.1. Market Analysis, Insights and Forecast - by Product
- 5.1.1. Billboard
- 5.1.2. Backlit Display
- 5.1.3. Pop Display
- 5.1.4. Banner, Flag, and Backdrop
- 5.1.5. Corporat
- 5.1.6. Other Products
- 5.2. Market Analysis, Insights and Forecast - by Type
- 5.2.1. Indoor Printed Signage
- 5.2.2. Outdoor Printed Signage
- 5.3. Market Analysis, Insights and Forecast - by End-user Vertical
- 5.3.1. BFSI
- 5.3.2. Retail
- 5.3.3. Sports and Leisure
- 5.3.4. Entertainment
- 5.3.5. Transportation and Logistics
- 5.3.6. Healthcare
- 5.3.7. Other End-user Verticals
- 5.4. Market Analysis, Insights and Forecast - by Region
- 5.4.1. North America
- 5.1. Market Analysis, Insights and Forecast - by Product
- 6. North America Printed Signage Industry Analysis, Insights and Forecast, 2021-2033
- 6.1. Market Analysis, Insights and Forecast - by Product
- 6.1.1. Billboard
- 6.1.2. Backlit Display
- 6.1.3. Pop Display
- 6.1.4. Banner, Flag, and Backdrop
- 6.1.5. Corporat
- 6.1.6. Other Products
- 6.2. Market Analysis, Insights and Forecast - by Type
- 6.2.1. Indoor Printed Signage
- 6.2.2. Outdoor Printed Signage
- 6.3. Market Analysis, Insights and Forecast - by End-user Vertical
- 6.3.1. BFSI
- 6.3.2. Retail
- 6.3.3. Sports and Leisure
- 6.3.4. Entertainment
- 6.3.5. Transportation and Logistics
- 6.3.6. Healthcare
- 6.3.7. Other End-user Verticals
- 6.1. Market Analysis, Insights and Forecast - by Product
- 7. Competitive Analysis
- 7.1. Company Profiles
- 7.1.1 Kelly Signs Inc
- 7.1.1.1. Company Overview
- 7.1.1.2. Products
- 7.1.1.3. Company Financials
- 7.1.1.4. SWOT Analysis
- 7.1.2 Sabre Digital Creative
- 7.1.2.1. Company Overview
- 7.1.2.2. Products
- 7.1.2.3. Company Financials
- 7.1.2.4. SWOT Analysis
- 7.1.3 Chandler Inc
- 7.1.3.1. Company Overview
- 7.1.3.2. Products
- 7.1.3.3. Company Financials
- 7.1.3.4. SWOT Analysis
- 7.1.4 James Printing and Signs
- 7.1.4.1. Company Overview
- 7.1.4.2. Products
- 7.1.4.3. Company Financials
- 7.1.4.4. SWOT Analysis
- 7.1.5 RGLA Solutions Inc
- 7.1.5.1. Company Overview
- 7.1.5.2. Products
- 7.1.5.3. Company Financials
- 7.1.5.4. SWOT Analysis
- 7.1.6 Accel Group Inc
- 7.1.6.1. Company Overview
- 7.1.6.2. Products
- 7.1.6.3. Company Financials
- 7.1.6.4. SWOT Analysis
- 7.1.7 Vistaprint*List Not Exhaustive
- 7.1.7.1. Company Overview
- 7.1.7.2. Products
- 7.1.7.3. Company Financials
- 7.1.7.4. SWOT Analysis
- 7.1.8 AJ Printing & Graphics Inc
- 7.1.8.1. Company Overview
- 7.1.8.2. Products
- 7.1.8.3. Company Financials
- 7.1.8.4. SWOT Analysis
- 7.1.9 Avery Dennison Corporation
- 7.1.9.1. Company Overview
- 7.1.9.2. Products
- 7.1.9.3. Company Financials
- 7.1.9.4. SWOT Analysis
- 7.1.10 Southwest Printing Co
- 7.1.10.1. Company Overview
- 7.1.10.2. Products
- 7.1.10.3. Company Financials
- 7.1.10.4. SWOT Analysis
- 7.1.1 Kelly Signs Inc
- 7.2. Market Entropy
- 7.2.1 Company's Key Areas Served
- 7.2.2 Recent Developments
- 7.3. Company Market Share Analysis 2025
- 7.3.1 Top 5 Companies Market Share Analysis
- 7.3.2 Top 3 Companies Market Share Analysis
- 7.4. List of Potential Customers
- 8. Research Methodology
List of Figures
- Figure 1: North America Printed Signage Industry Revenue Breakdown (billion, %) by Product 2025 & 2033
- Figure 2: North America Printed Signage Industry Share (%) by Company 2025
List of Tables
- Table 1: North America Printed Signage Industry Revenue billion Forecast, by Product 2020 & 2033
- Table 2: North America Printed Signage Industry Revenue billion Forecast, by Type 2020 & 2033
- Table 3: North America Printed Signage Industry Revenue billion Forecast, by End-user Vertical 2020 & 2033
- Table 4: North America Printed Signage Industry Revenue billion Forecast, by Region 2020 & 2033
- Table 5: North America Printed Signage Industry Revenue billion Forecast, by Product 2020 & 2033
- Table 6: North America Printed Signage Industry Revenue billion Forecast, by Type 2020 & 2033
- Table 7: North America Printed Signage Industry Revenue billion Forecast, by End-user Vertical 2020 & 2033
- Table 8: North America Printed Signage Industry Revenue billion Forecast, by Country 2020 & 2033
- Table 9: United States North America Printed Signage Industry Revenue (billion) Forecast, by Application 2020 & 2033
- Table 10: Canada North America Printed Signage Industry Revenue (billion) Forecast, by Application 2020 & 2033
- Table 11: Mexico North America Printed Signage Industry Revenue (billion) Forecast, by Application 2020 & 2033
Frequently Asked Questions
1. What is the projected Compound Annual Growth Rate (CAGR) of the North America Printed Signage Industry?
The projected CAGR is approximately 2.01%.
2. Which companies are prominent players in the North America Printed Signage Industry?
Key companies in the market include Kelly Signs Inc, Sabre Digital Creative, Chandler Inc, James Printing and Signs, RGLA Solutions Inc, Accel Group Inc, Vistaprint*List Not Exhaustive, AJ Printing & Graphics Inc, Avery Dennison Corporation, Southwest Printing Co.
3. What are the main segments of the North America Printed Signage Industry?
The market segments include Product, Type, End-user Vertical.
4. Can you provide details about the market size?
The market size is estimated to be USD 41.86 billion as of 2022.
5. What are some drivers contributing to market growth?
; Cost Effectiveness of Printed Signage.
6. What are the notable trends driving market growth?
Corporate Graphics. Exhibition. and Trade Show Material to Witness Downfall.
7. Are there any restraints impacting market growth?
; Advent of Digital Signage; Drawbacks of Screen Printing.
8. Can you provide examples of recent developments in the market?
N/A
9. What pricing options are available for accessing the report?
Pricing options include single-user, multi-user, and enterprise licenses priced at USD 4750, USD 4950, and USD 6800 respectively.
10. Is the market size provided in terms of value or volume?
The market size is provided in terms of value, measured in billion.
11. Are there any specific market keywords associated with the report?
Yes, the market keyword associated with the report is "North America Printed Signage Industry," which aids in identifying and referencing the specific market segment covered.
12. How do I determine which pricing option suits my needs best?
The pricing options vary based on user requirements and access needs. Individual users may opt for single-user licenses, while businesses requiring broader access may choose multi-user or enterprise licenses for cost-effective access to the report.
13. Are there any additional resources or data provided in the North America Printed Signage Industry report?
While the report offers comprehensive insights, it's advisable to review the specific contents or supplementary materials provided to ascertain if additional resources or data are available.
14. How can I stay updated on further developments or reports in the North America Printed Signage Industry?
To stay informed about further developments, trends, and reports in the North America Printed Signage Industry, consider subscribing to industry newsletters, following relevant companies and organizations, or regularly checking reputable industry news sources and publications.
Methodology
Step 1 - Identification of Relevant Samples Size from Population Database


Step 2 - Approaches for Defining Global Market Size (Value, Volume* & Price*)

Note*: In applicable scenarios
Step 3 - Data Sources
Primary Research
- Web Analytics
- Survey Reports
- Research Institute
- Latest Research Reports
- Opinion Leaders
Secondary Research
- Annual Reports
- White Paper
- Latest Press Release
- Industry Association
- Paid Database
- Investor Presentations

Step 4 - Data Triangulation
Involves using different sources of information in order to increase the validity of a study
These sources are likely to be stakeholders in a program - participants, other researchers, program staff, other community members, and so on.
Then we put all data in single framework & apply various statistical tools to find out the dynamic on the market.
During the analysis stage, feedback from the stakeholder groups would be compared to determine areas of agreement as well as areas of divergence