

Key Insights
The multimodal imaging market, encompassing PET/CT, SPECT/CT, and PET/MR systems, is experiencing robust growth, driven by the increasing prevalence of chronic diseases like cancer and cardiovascular ailments necessitating advanced diagnostic tools. The market's expansion is fueled by technological advancements leading to improved image quality, faster scan times, and enhanced diagnostic accuracy. Furthermore, the rising adoption of minimally invasive procedures and personalized medicine strategies underscores the need for precise and comprehensive imaging data provided by multimodal systems. Growth is particularly strong in oncology applications, where multimodal imaging plays a crucial role in cancer detection, staging, treatment monitoring, and response assessment. Hospitals and diagnostic centers are the primary end-users, reflecting the importance of these systems in comprehensive patient care. While the initial investment in multimodal imaging systems is significant, the long-term benefits in terms of improved patient outcomes and reduced healthcare costs are driving market adoption, outweighing the initial investment hurdle.
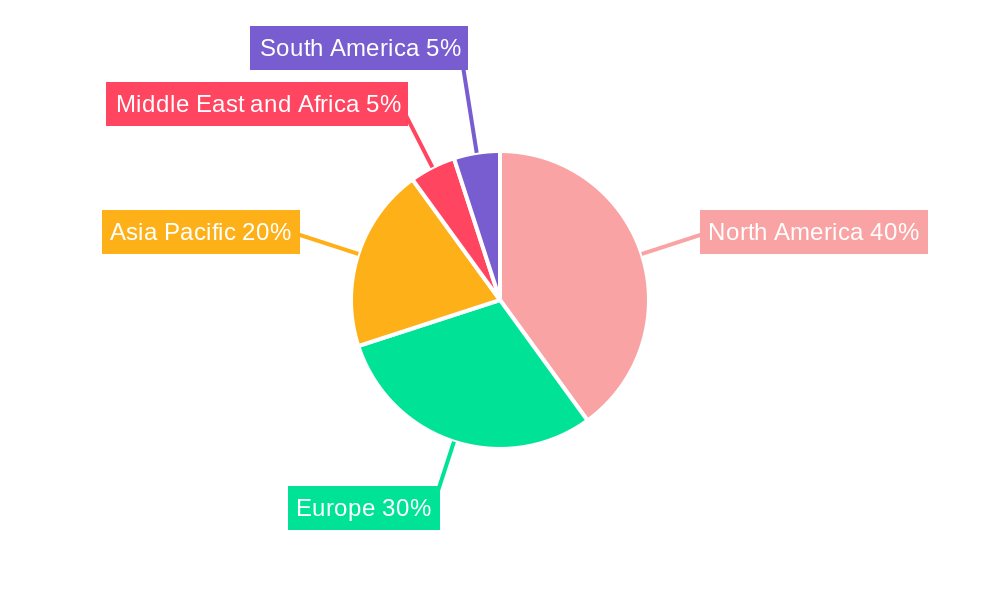
Regional variations in market growth are expected, with North America and Europe maintaining strong positions due to well-established healthcare infrastructure and high per capita healthcare spending. However, the Asia-Pacific region is projected to witness significant growth, driven by increasing healthcare expenditure, rising prevalence of chronic diseases, and expanding healthcare infrastructure. The competitive landscape is characterized by a mix of established players like Siemens Healthineers, GE Healthcare, and Philips, alongside emerging companies focusing on innovation and specialized solutions. The market is likely to witness increased consolidation and strategic partnerships in the coming years as companies strive to enhance their market share and product portfolio. While regulatory hurdles and the high cost of maintenance could potentially pose restraints, the overall growth trajectory remains positive, fueled by technological advancements, increased demand for precise diagnostics, and favorable regulatory landscapes in many key regions.
Multimodal Imaging Market Report: A Comprehensive Analysis (2019-2033)
This insightful report provides a detailed analysis of the global Multimodal Imaging Market, offering a comprehensive overview of its current state, future trajectory, and key players. With a study period spanning 2019-2033, a base year of 2025, and a forecast period from 2025-2033, this report is an indispensable resource for stakeholders seeking to understand and capitalize on opportunities within this dynamic market. The market is projected to reach xx Million by 2033, demonstrating significant growth potential.
Multimodal Imaging Market Market Composition & Trends
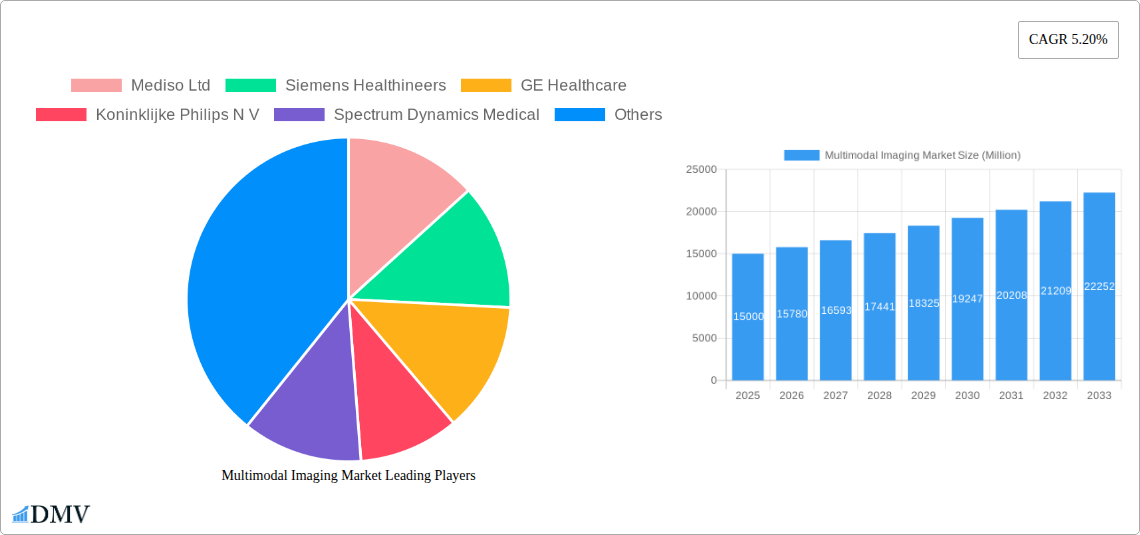
The Multimodal Imaging market exhibits a moderately concentrated structure, with key players like Mediso Ltd, Siemens Healthineers, GE Healthcare, Koninklijke Philips N V, Spectrum Dynamics Medical, Neusoft Medical Systems Co Ltd, MILabs B V, and Bruker Corporation holding significant market share. However, the presence of several smaller, innovative companies fosters a competitive landscape. Market share distribution in 2025 is estimated as follows: Siemens Healthineers (25%), GE Healthcare (20%), Philips (18%), and others (37%). Innovation is a key driver, with continuous advancements in imaging technologies and software analytics pushing the market forward. Regulatory landscapes vary across geographies, impacting market entry and product approvals. Substitute products, such as single-modality imaging systems, present a competitive challenge, though the advantages of multimodal imaging in terms of diagnostic accuracy and efficiency often outweigh these alternatives. End-user profiles are predominantly hospitals and diagnostic centers, though the market is seeing growth in other specialized facilities. M&A activity has been moderate, with deals primarily focused on expanding technological capabilities and geographic reach. The total value of M&A deals within the last 5 years is estimated to be around xx Million.
- Market Concentration: Moderately concentrated, with a few dominant players.
- Innovation Catalysts: Advancements in detection technologies, AI-powered image analysis.
- Regulatory Landscape: Varies by region, influencing market access.
- Substitute Products: Single-modality imaging systems pose a competitive threat.
- End-User Profiles: Hospitals and diagnostic centers constitute the majority.
- M&A Activity: Moderate, focused on technological expansion and market reach.
Multimodal Imaging Market Industry Evolution
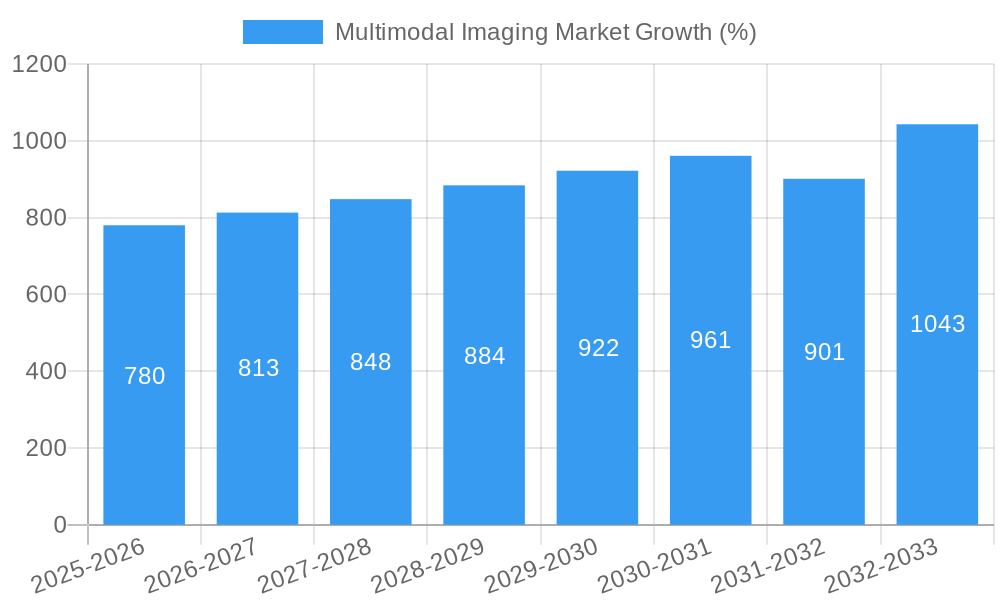
The Multimodal Imaging market has witnessed robust growth over the historical period (2019-2024), fueled by technological advancements, increasing prevalence of chronic diseases requiring advanced diagnostics, and rising healthcare expenditure globally. The market experienced a Compound Annual Growth Rate (CAGR) of xx% during this period. Technological advancements such as improved detector technology, advanced image reconstruction algorithms, and the integration of artificial intelligence (AI) for improved diagnostic accuracy have significantly propelled market growth. Shifting consumer demands towards faster, more accurate, and less invasive diagnostic procedures are also driving market expansion. The forecast period (2025-2033) projects continued growth, driven by factors such as increasing adoption of AI in medical imaging, the rising geriatric population (leading to higher demand for diagnostic imaging), and the expansion of healthcare infrastructure in developing economies. We expect a CAGR of xx% during this period. The adoption rate of multimodal imaging systems in hospitals is projected to increase from xx% in 2025 to xx% in 2033.
Leading Regions, Countries, or Segments in Multimodal Imaging Market
North America currently dominates the Multimodal Imaging market, driven by high healthcare expenditure, advanced infrastructure, and early adoption of new technologies. Europe follows closely, with a strong presence of established players and a significant focus on healthcare innovation. Asia-Pacific is a rapidly growing region, fueled by increasing healthcare investments and expanding diagnostic facilities.
By Technology:
- PET/CT Systems: Remains the dominant technology segment due to its wide applications across various diseases. Key drivers include increasing demand for cancer diagnostics and growing adoption in oncology departments.
- SPECT/CT Systems: Holds a significant share, particularly in cardiology applications. Its cost-effectiveness contributes to its appeal.
- PET/MR Systems: Shows strong growth potential, driven by its superior soft-tissue contrast and functional imaging capabilities. However, high cost and complex operation limit widespread adoption.
- Others: Includes technologies like MRI/SPECT and hybrid imaging systems. This segment is expected to experience moderate growth, driven by niche applications and technological advancements.
By Application:
- Oncology: The largest application segment, driven by the increasing incidence of cancer and the need for accurate staging and treatment monitoring.
- Cardiology: Significant market share due to the use of SPECT/CT for diagnosing and monitoring cardiovascular diseases.
- Ophthalmology: Shows moderate growth driven by technological advancements in imaging and increased application in diagnosing eye diseases.
- Others: Includes neurology, orthopedics, and other clinical applications showing potential for future expansion.
By End-User:
- Hospitals: The primary end-user segment due to their extensive diagnostic capabilities and high patient volumes.
- Diagnostic Centers: Represents a significant market segment, especially in developed countries with a high concentration of specialized imaging centers.
- Others: Includes research institutions, ambulatory surgical centers, and others.
Multimodal Imaging Market Product Innovations
Recent innovations include the development of more compact and cost-effective systems, improved image quality through advanced reconstruction algorithms, and integration of AI for automated image analysis and disease detection. Several companies are focusing on developing systems with higher sensitivity and specificity, leading to faster and more accurate diagnoses. Unique selling propositions often involve reduced radiation exposure, improved image resolution, and faster scan times. The integration of AI is a major focus, enhancing diagnostic accuracy and workflow efficiency.
Propelling Factors for Multimodal Imaging Market Growth
Technological advancements, such as improved detectors and AI-powered image analysis, are significant drivers. Increasing prevalence of chronic diseases like cancer and cardiovascular diseases fuels demand for accurate diagnostic tools. Favorable regulatory environments and government initiatives promoting healthcare infrastructure development also support market growth.
Obstacles in the Multimodal Imaging Market Market
High initial investment costs for advanced systems can hinder adoption, particularly in resource-constrained settings. The complexity of multimodal imaging systems requires highly trained personnel, potentially limiting widespread adoption. Supply chain disruptions and the volatility of raw material prices pose ongoing challenges. Intense competition among established players and the emergence of innovative entrants further complicate the market dynamics.
Future Opportunities in Multimodal Imaging Market
Expanding into emerging markets with growing healthcare infrastructure presents significant growth opportunities. Further advancements in AI and machine learning for image analysis can improve diagnostic accuracy and efficiency. The development of personalized medicine approaches leveraging multimodal imaging data is an area of intense research with significant potential.
Major Players in the Multimodal Imaging Market Ecosystem
- Mediso Ltd
- Siemens Healthineers
- GE Healthcare
- Koninklijke Philips N V
- Spectrum Dynamics Medical
- Neusoft Medical Systems Co Ltd
- MILabs B V
- Bruker Corporation *List Not Exhaustive
Key Developments in Multimodal Imaging Market Industry
- 2023 (Q4): Siemens Healthineers launched a new PET/MR system with enhanced image quality.
- 2022 (Q3): GE Healthcare acquired a smaller company specializing in AI-powered image analysis.
- 2021 (Q2): Philips introduced a new SPECT/CT system with reduced radiation exposure.
- Further details available in the full report.
Strategic Multimodal Imaging Market Market Forecast
The multimodal imaging market is poised for continued growth, driven by technological innovation, increasing healthcare spending, and the rising prevalence of chronic diseases. Future opportunities lie in the development of advanced AI algorithms, integration with other diagnostic modalities, and expansion into emerging markets. The market's strong fundamentals and technological advancements indicate robust growth potential throughout the forecast period.
Multimodal Imaging Market Segmentation
-
1. Technology
- 1.1. PET/CT Systems
- 1.2. SPECT/CT Systems
- 1.3. PET/MR Systems
- 1.4. Others
-
2. Application
- 2.1. Oncology
- 2.2. Ophthalmology
- 2.3. Cardiology
- 2.4. Others
-
3. End-User
- 3.1. Hospitals
- 3.2. Diagnostic Centers
- 3.3. Others
Multimodal Imaging Market Segmentation By Geography
-
1. North America
- 1.1. United States
- 1.2. Canada
- 1.3. Mexico
-
2. Europe
- 2.1. Germany
- 2.2. United Kingdom
- 2.3. France
- 2.4. Italy
- 2.5. Spain
- 2.6. Rest of Europe
-
3. Asia Pacific
- 3.1. China
- 3.2. Japan
- 3.3. India
- 3.4. Australia
- 3.5. South Korea
- 3.6. Rest of Asia Pacific
-
4. Middle East and Africa
- 4.1. GCC
- 4.2. South Africa
- 4.3. Rest of Middle East and Africa
-
5. South America
- 5.1. Brazil
- 5.2. Argentina
- 5.3. Rest of South America
Multimodal Imaging Market REPORT HIGHLIGHTS
| Aspects | Details |
|---|---|
| Study Period | 2019-2033 |
| Base Year | 2024 |
| Estimated Year | 2025 |
| Forecast Period | 2025-2033 |
| Historical Period | 2019-2024 |
| Growth Rate | CAGR of 5.20% from 2019-2033 |
| Segmentation |
|
Table of Contents
- 1. Introduction
- 1.1. Research Scope
- 1.2. Market Segmentation
- 1.3. Research Methodology
- 1.4. Definitions and Assumptions
- 2. Executive Summary
- 2.1. Introduction
- 3. Market Dynamics
- 3.1. Introduction
- 3.2. Market Drivers
- 3.2.1. ; Growing Prevalence of Chronic Illness; Technological Advancements in Diagnostic Imaging Modalities
- 3.3. Market Restrains
- 3.3.1. ; High Cost of Multimodal Imaging Systems; Shortage of Adequate Healthcare Infrastructure
- 3.4. Market Trends
- 3.4.1. PET/CT Systems Segment is Expected to be the Fastest Growing Segment During the Forecast Period
- 4. Market Factor Analysis
- 4.1. Porters Five Forces
- 4.2. Supply/Value Chain
- 4.3. PESTEL analysis
- 4.4. Market Entropy
- 4.5. Patent/Trademark Analysis
- 5. Global Multimodal Imaging Market Analysis, Insights and Forecast, 2019-2031
- 5.1. Market Analysis, Insights and Forecast - by Technology
- 5.1.1. PET/CT Systems
- 5.1.2. SPECT/CT Systems
- 5.1.3. PET/MR Systems
- 5.1.4. Others
- 5.2. Market Analysis, Insights and Forecast - by Application
- 5.2.1. Oncology
- 5.2.2. Ophthalmology
- 5.2.3. Cardiology
- 5.2.4. Others
- 5.3. Market Analysis, Insights and Forecast - by End-User
- 5.3.1. Hospitals
- 5.3.2. Diagnostic Centers
- 5.3.3. Others
- 5.4. Market Analysis, Insights and Forecast - by Region
- 5.4.1. North America
- 5.4.2. Europe
- 5.4.3. Asia Pacific
- 5.4.4. Middle East and Africa
- 5.4.5. South America
- 5.1. Market Analysis, Insights and Forecast - by Technology
- 6. North America Multimodal Imaging Market Analysis, Insights and Forecast, 2019-2031
- 6.1. Market Analysis, Insights and Forecast - by Technology
- 6.1.1. PET/CT Systems
- 6.1.2. SPECT/CT Systems
- 6.1.3. PET/MR Systems
- 6.1.4. Others
- 6.2. Market Analysis, Insights and Forecast - by Application
- 6.2.1. Oncology
- 6.2.2. Ophthalmology
- 6.2.3. Cardiology
- 6.2.4. Others
- 6.3. Market Analysis, Insights and Forecast - by End-User
- 6.3.1. Hospitals
- 6.3.2. Diagnostic Centers
- 6.3.3. Others
- 6.1. Market Analysis, Insights and Forecast - by Technology
- 7. Europe Multimodal Imaging Market Analysis, Insights and Forecast, 2019-2031
- 7.1. Market Analysis, Insights and Forecast - by Technology
- 7.1.1. PET/CT Systems
- 7.1.2. SPECT/CT Systems
- 7.1.3. PET/MR Systems
- 7.1.4. Others
- 7.2. Market Analysis, Insights and Forecast - by Application
- 7.2.1. Oncology
- 7.2.2. Ophthalmology
- 7.2.3. Cardiology
- 7.2.4. Others
- 7.3. Market Analysis, Insights and Forecast - by End-User
- 7.3.1. Hospitals
- 7.3.2. Diagnostic Centers
- 7.3.3. Others
- 7.1. Market Analysis, Insights and Forecast - by Technology
- 8. Asia Pacific Multimodal Imaging Market Analysis, Insights and Forecast, 2019-2031
- 8.1. Market Analysis, Insights and Forecast - by Technology
- 8.1.1. PET/CT Systems
- 8.1.2. SPECT/CT Systems
- 8.1.3. PET/MR Systems
- 8.1.4. Others
- 8.2. Market Analysis, Insights and Forecast - by Application
- 8.2.1. Oncology
- 8.2.2. Ophthalmology
- 8.2.3. Cardiology
- 8.2.4. Others
- 8.3. Market Analysis, Insights and Forecast - by End-User
- 8.3.1. Hospitals
- 8.3.2. Diagnostic Centers
- 8.3.3. Others
- 8.1. Market Analysis, Insights and Forecast - by Technology
- 9. Middle East and Africa Multimodal Imaging Market Analysis, Insights and Forecast, 2019-2031
- 9.1. Market Analysis, Insights and Forecast - by Technology
- 9.1.1. PET/CT Systems
- 9.1.2. SPECT/CT Systems
- 9.1.3. PET/MR Systems
- 9.1.4. Others
- 9.2. Market Analysis, Insights and Forecast - by Application
- 9.2.1. Oncology
- 9.2.2. Ophthalmology
- 9.2.3. Cardiology
- 9.2.4. Others
- 9.3. Market Analysis, Insights and Forecast - by End-User
- 9.3.1. Hospitals
- 9.3.2. Diagnostic Centers
- 9.3.3. Others
- 9.1. Market Analysis, Insights and Forecast - by Technology
- 10. South America Multimodal Imaging Market Analysis, Insights and Forecast, 2019-2031
- 10.1. Market Analysis, Insights and Forecast - by Technology
- 10.1.1. PET/CT Systems
- 10.1.2. SPECT/CT Systems
- 10.1.3. PET/MR Systems
- 10.1.4. Others
- 10.2. Market Analysis, Insights and Forecast - by Application
- 10.2.1. Oncology
- 10.2.2. Ophthalmology
- 10.2.3. Cardiology
- 10.2.4. Others
- 10.3. Market Analysis, Insights and Forecast - by End-User
- 10.3.1. Hospitals
- 10.3.2. Diagnostic Centers
- 10.3.3. Others
- 10.1. Market Analysis, Insights and Forecast - by Technology
- 11. North America Multimodal Imaging Market Analysis, Insights and Forecast, 2019-2031
- 11.1. Market Analysis, Insights and Forecast - By Country/Sub-region
- 11.1.1 United States
- 11.1.2 Canada
- 11.1.3 Mexico
- 12. Europe Multimodal Imaging Market Analysis, Insights and Forecast, 2019-2031
- 12.1. Market Analysis, Insights and Forecast - By Country/Sub-region
- 12.1.1 Germany
- 12.1.2 United Kingdom
- 12.1.3 France
- 12.1.4 Italy
- 12.1.5 Spain
- 12.1.6 Rest of Europe
- 13. Asia Pacific Multimodal Imaging Market Analysis, Insights and Forecast, 2019-2031
- 13.1. Market Analysis, Insights and Forecast - By Country/Sub-region
- 13.1.1 China
- 13.1.2 Japan
- 13.1.3 India
- 13.1.4 Australia
- 13.1.5 South Korea
- 13.1.6 Rest of Asia Pacific
- 14. Middle East and Africa Multimodal Imaging Market Analysis, Insights and Forecast, 2019-2031
- 14.1. Market Analysis, Insights and Forecast - By Country/Sub-region
- 14.1.1 GCC
- 14.1.2 South Africa
- 14.1.3 Rest of Middle East and Africa
- 15. South America Multimodal Imaging Market Analysis, Insights and Forecast, 2019-2031
- 15.1. Market Analysis, Insights and Forecast - By Country/Sub-region
- 15.1.1 Brazil
- 15.1.2 Argentina
- 15.1.3 Rest of South America
- 16. Competitive Analysis
- 16.1. Global Market Share Analysis 2024
- 16.2. Company Profiles
- 16.2.1 Mediso Ltd
- 16.2.1.1. Overview
- 16.2.1.2. Products
- 16.2.1.3. SWOT Analysis
- 16.2.1.4. Recent Developments
- 16.2.1.5. Financials (Based on Availability)
- 16.2.2 Siemens Healthineers
- 16.2.2.1. Overview
- 16.2.2.2. Products
- 16.2.2.3. SWOT Analysis
- 16.2.2.4. Recent Developments
- 16.2.2.5. Financials (Based on Availability)
- 16.2.3 GE Healthcare
- 16.2.3.1. Overview
- 16.2.3.2. Products
- 16.2.3.3. SWOT Analysis
- 16.2.3.4. Recent Developments
- 16.2.3.5. Financials (Based on Availability)
- 16.2.4 Koninklijke Philips N V
- 16.2.4.1. Overview
- 16.2.4.2. Products
- 16.2.4.3. SWOT Analysis
- 16.2.4.4. Recent Developments
- 16.2.4.5. Financials (Based on Availability)
- 16.2.5 Spectrum Dynamics Medical
- 16.2.5.1. Overview
- 16.2.5.2. Products
- 16.2.5.3. SWOT Analysis
- 16.2.5.4. Recent Developments
- 16.2.5.5. Financials (Based on Availability)
- 16.2.6 Neusoft Medical Systems Co Ltd
- 16.2.6.1. Overview
- 16.2.6.2. Products
- 16.2.6.3. SWOT Analysis
- 16.2.6.4. Recent Developments
- 16.2.6.5. Financials (Based on Availability)
- 16.2.7 MILabs B V
- 16.2.7.1. Overview
- 16.2.7.2. Products
- 16.2.7.3. SWOT Analysis
- 16.2.7.4. Recent Developments
- 16.2.7.5. Financials (Based on Availability)
- 16.2.8 Bruker Corporation*List Not Exhaustive
- 16.2.8.1. Overview
- 16.2.8.2. Products
- 16.2.8.3. SWOT Analysis
- 16.2.8.4. Recent Developments
- 16.2.8.5. Financials (Based on Availability)
- 16.2.1 Mediso Ltd
List of Figures
- Figure 1: Global Multimodal Imaging Market Revenue Breakdown (Million, %) by Region 2024 & 2032
- Figure 2: North America Multimodal Imaging Market Revenue (Million), by Country 2024 & 2032
- Figure 3: North America Multimodal Imaging Market Revenue Share (%), by Country 2024 & 2032
- Figure 4: Europe Multimodal Imaging Market Revenue (Million), by Country 2024 & 2032
- Figure 5: Europe Multimodal Imaging Market Revenue Share (%), by Country 2024 & 2032
- Figure 6: Asia Pacific Multimodal Imaging Market Revenue (Million), by Country 2024 & 2032
- Figure 7: Asia Pacific Multimodal Imaging Market Revenue Share (%), by Country 2024 & 2032
- Figure 8: Middle East and Africa Multimodal Imaging Market Revenue (Million), by Country 2024 & 2032
- Figure 9: Middle East and Africa Multimodal Imaging Market Revenue Share (%), by Country 2024 & 2032
- Figure 10: South America Multimodal Imaging Market Revenue (Million), by Country 2024 & 2032
- Figure 11: South America Multimodal Imaging Market Revenue Share (%), by Country 2024 & 2032
- Figure 12: North America Multimodal Imaging Market Revenue (Million), by Technology 2024 & 2032
- Figure 13: North America Multimodal Imaging Market Revenue Share (%), by Technology 2024 & 2032
- Figure 14: North America Multimodal Imaging Market Revenue (Million), by Application 2024 & 2032
- Figure 15: North America Multimodal Imaging Market Revenue Share (%), by Application 2024 & 2032
- Figure 16: North America Multimodal Imaging Market Revenue (Million), by End-User 2024 & 2032
- Figure 17: North America Multimodal Imaging Market Revenue Share (%), by End-User 2024 & 2032
- Figure 18: North America Multimodal Imaging Market Revenue (Million), by Country 2024 & 2032
- Figure 19: North America Multimodal Imaging Market Revenue Share (%), by Country 2024 & 2032
- Figure 20: Europe Multimodal Imaging Market Revenue (Million), by Technology 2024 & 2032
- Figure 21: Europe Multimodal Imaging Market Revenue Share (%), by Technology 2024 & 2032
- Figure 22: Europe Multimodal Imaging Market Revenue (Million), by Application 2024 & 2032
- Figure 23: Europe Multimodal Imaging Market Revenue Share (%), by Application 2024 & 2032
- Figure 24: Europe Multimodal Imaging Market Revenue (Million), by End-User 2024 & 2032
- Figure 25: Europe Multimodal Imaging Market Revenue Share (%), by End-User 2024 & 2032
- Figure 26: Europe Multimodal Imaging Market Revenue (Million), by Country 2024 & 2032
- Figure 27: Europe Multimodal Imaging Market Revenue Share (%), by Country 2024 & 2032
- Figure 28: Asia Pacific Multimodal Imaging Market Revenue (Million), by Technology 2024 & 2032
- Figure 29: Asia Pacific Multimodal Imaging Market Revenue Share (%), by Technology 2024 & 2032
- Figure 30: Asia Pacific Multimodal Imaging Market Revenue (Million), by Application 2024 & 2032
- Figure 31: Asia Pacific Multimodal Imaging Market Revenue Share (%), by Application 2024 & 2032
- Figure 32: Asia Pacific Multimodal Imaging Market Revenue (Million), by End-User 2024 & 2032
- Figure 33: Asia Pacific Multimodal Imaging Market Revenue Share (%), by End-User 2024 & 2032
- Figure 34: Asia Pacific Multimodal Imaging Market Revenue (Million), by Country 2024 & 2032
- Figure 35: Asia Pacific Multimodal Imaging Market Revenue Share (%), by Country 2024 & 2032
- Figure 36: Middle East and Africa Multimodal Imaging Market Revenue (Million), by Technology 2024 & 2032
- Figure 37: Middle East and Africa Multimodal Imaging Market Revenue Share (%), by Technology 2024 & 2032
- Figure 38: Middle East and Africa Multimodal Imaging Market Revenue (Million), by Application 2024 & 2032
- Figure 39: Middle East and Africa Multimodal Imaging Market Revenue Share (%), by Application 2024 & 2032
- Figure 40: Middle East and Africa Multimodal Imaging Market Revenue (Million), by End-User 2024 & 2032
- Figure 41: Middle East and Africa Multimodal Imaging Market Revenue Share (%), by End-User 2024 & 2032
- Figure 42: Middle East and Africa Multimodal Imaging Market Revenue (Million), by Country 2024 & 2032
- Figure 43: Middle East and Africa Multimodal Imaging Market Revenue Share (%), by Country 2024 & 2032
- Figure 44: South America Multimodal Imaging Market Revenue (Million), by Technology 2024 & 2032
- Figure 45: South America Multimodal Imaging Market Revenue Share (%), by Technology 2024 & 2032
- Figure 46: South America Multimodal Imaging Market Revenue (Million), by Application 2024 & 2032
- Figure 47: South America Multimodal Imaging Market Revenue Share (%), by Application 2024 & 2032
- Figure 48: South America Multimodal Imaging Market Revenue (Million), by End-User 2024 & 2032
- Figure 49: South America Multimodal Imaging Market Revenue Share (%), by End-User 2024 & 2032
- Figure 50: South America Multimodal Imaging Market Revenue (Million), by Country 2024 & 2032
- Figure 51: South America Multimodal Imaging Market Revenue Share (%), by Country 2024 & 2032
List of Tables
- Table 1: Global Multimodal Imaging Market Revenue Million Forecast, by Region 2019 & 2032
- Table 2: Global Multimodal Imaging Market Revenue Million Forecast, by Technology 2019 & 2032
- Table 3: Global Multimodal Imaging Market Revenue Million Forecast, by Application 2019 & 2032
- Table 4: Global Multimodal Imaging Market Revenue Million Forecast, by End-User 2019 & 2032
- Table 5: Global Multimodal Imaging Market Revenue Million Forecast, by Region 2019 & 2032
- Table 6: Global Multimodal Imaging Market Revenue Million Forecast, by Country 2019 & 2032
- Table 7: United States Multimodal Imaging Market Revenue (Million) Forecast, by Application 2019 & 2032
- Table 8: Canada Multimodal Imaging Market Revenue (Million) Forecast, by Application 2019 & 2032
- Table 9: Mexico Multimodal Imaging Market Revenue (Million) Forecast, by Application 2019 & 2032
- Table 10: Global Multimodal Imaging Market Revenue Million Forecast, by Country 2019 & 2032
- Table 11: Germany Multimodal Imaging Market Revenue (Million) Forecast, by Application 2019 & 2032
- Table 12: United Kingdom Multimodal Imaging Market Revenue (Million) Forecast, by Application 2019 & 2032
- Table 13: France Multimodal Imaging Market Revenue (Million) Forecast, by Application 2019 & 2032
- Table 14: Italy Multimodal Imaging Market Revenue (Million) Forecast, by Application 2019 & 2032
- Table 15: Spain Multimodal Imaging Market Revenue (Million) Forecast, by Application 2019 & 2032
- Table 16: Rest of Europe Multimodal Imaging Market Revenue (Million) Forecast, by Application 2019 & 2032
- Table 17: Global Multimodal Imaging Market Revenue Million Forecast, by Country 2019 & 2032
- Table 18: China Multimodal Imaging Market Revenue (Million) Forecast, by Application 2019 & 2032
- Table 19: Japan Multimodal Imaging Market Revenue (Million) Forecast, by Application 2019 & 2032
- Table 20: India Multimodal Imaging Market Revenue (Million) Forecast, by Application 2019 & 2032
- Table 21: Australia Multimodal Imaging Market Revenue (Million) Forecast, by Application 2019 & 2032
- Table 22: South Korea Multimodal Imaging Market Revenue (Million) Forecast, by Application 2019 & 2032
- Table 23: Rest of Asia Pacific Multimodal Imaging Market Revenue (Million) Forecast, by Application 2019 & 2032
- Table 24: Global Multimodal Imaging Market Revenue Million Forecast, by Country 2019 & 2032
- Table 25: GCC Multimodal Imaging Market Revenue (Million) Forecast, by Application 2019 & 2032
- Table 26: South Africa Multimodal Imaging Market Revenue (Million) Forecast, by Application 2019 & 2032
- Table 27: Rest of Middle East and Africa Multimodal Imaging Market Revenue (Million) Forecast, by Application 2019 & 2032
- Table 28: Global Multimodal Imaging Market Revenue Million Forecast, by Country 2019 & 2032
- Table 29: Brazil Multimodal Imaging Market Revenue (Million) Forecast, by Application 2019 & 2032
- Table 30: Argentina Multimodal Imaging Market Revenue (Million) Forecast, by Application 2019 & 2032
- Table 31: Rest of South America Multimodal Imaging Market Revenue (Million) Forecast, by Application 2019 & 2032
- Table 32: Global Multimodal Imaging Market Revenue Million Forecast, by Technology 2019 & 2032
- Table 33: Global Multimodal Imaging Market Revenue Million Forecast, by Application 2019 & 2032
- Table 34: Global Multimodal Imaging Market Revenue Million Forecast, by End-User 2019 & 2032
- Table 35: Global Multimodal Imaging Market Revenue Million Forecast, by Country 2019 & 2032
- Table 36: United States Multimodal Imaging Market Revenue (Million) Forecast, by Application 2019 & 2032
- Table 37: Canada Multimodal Imaging Market Revenue (Million) Forecast, by Application 2019 & 2032
- Table 38: Mexico Multimodal Imaging Market Revenue (Million) Forecast, by Application 2019 & 2032
- Table 39: Global Multimodal Imaging Market Revenue Million Forecast, by Technology 2019 & 2032
- Table 40: Global Multimodal Imaging Market Revenue Million Forecast, by Application 2019 & 2032
- Table 41: Global Multimodal Imaging Market Revenue Million Forecast, by End-User 2019 & 2032
- Table 42: Global Multimodal Imaging Market Revenue Million Forecast, by Country 2019 & 2032
- Table 43: Germany Multimodal Imaging Market Revenue (Million) Forecast, by Application 2019 & 2032
- Table 44: United Kingdom Multimodal Imaging Market Revenue (Million) Forecast, by Application 2019 & 2032
- Table 45: France Multimodal Imaging Market Revenue (Million) Forecast, by Application 2019 & 2032
- Table 46: Italy Multimodal Imaging Market Revenue (Million) Forecast, by Application 2019 & 2032
- Table 47: Spain Multimodal Imaging Market Revenue (Million) Forecast, by Application 2019 & 2032
- Table 48: Rest of Europe Multimodal Imaging Market Revenue (Million) Forecast, by Application 2019 & 2032
- Table 49: Global Multimodal Imaging Market Revenue Million Forecast, by Technology 2019 & 2032
- Table 50: Global Multimodal Imaging Market Revenue Million Forecast, by Application 2019 & 2032
- Table 51: Global Multimodal Imaging Market Revenue Million Forecast, by End-User 2019 & 2032
- Table 52: Global Multimodal Imaging Market Revenue Million Forecast, by Country 2019 & 2032
- Table 53: China Multimodal Imaging Market Revenue (Million) Forecast, by Application 2019 & 2032
- Table 54: Japan Multimodal Imaging Market Revenue (Million) Forecast, by Application 2019 & 2032
- Table 55: India Multimodal Imaging Market Revenue (Million) Forecast, by Application 2019 & 2032
- Table 56: Australia Multimodal Imaging Market Revenue (Million) Forecast, by Application 2019 & 2032
- Table 57: South Korea Multimodal Imaging Market Revenue (Million) Forecast, by Application 2019 & 2032
- Table 58: Rest of Asia Pacific Multimodal Imaging Market Revenue (Million) Forecast, by Application 2019 & 2032
- Table 59: Global Multimodal Imaging Market Revenue Million Forecast, by Technology 2019 & 2032
- Table 60: Global Multimodal Imaging Market Revenue Million Forecast, by Application 2019 & 2032
- Table 61: Global Multimodal Imaging Market Revenue Million Forecast, by End-User 2019 & 2032
- Table 62: Global Multimodal Imaging Market Revenue Million Forecast, by Country 2019 & 2032
- Table 63: GCC Multimodal Imaging Market Revenue (Million) Forecast, by Application 2019 & 2032
- Table 64: South Africa Multimodal Imaging Market Revenue (Million) Forecast, by Application 2019 & 2032
- Table 65: Rest of Middle East and Africa Multimodal Imaging Market Revenue (Million) Forecast, by Application 2019 & 2032
- Table 66: Global Multimodal Imaging Market Revenue Million Forecast, by Technology 2019 & 2032
- Table 67: Global Multimodal Imaging Market Revenue Million Forecast, by Application 2019 & 2032
- Table 68: Global Multimodal Imaging Market Revenue Million Forecast, by End-User 2019 & 2032
- Table 69: Global Multimodal Imaging Market Revenue Million Forecast, by Country 2019 & 2032
- Table 70: Brazil Multimodal Imaging Market Revenue (Million) Forecast, by Application 2019 & 2032
- Table 71: Argentina Multimodal Imaging Market Revenue (Million) Forecast, by Application 2019 & 2032
- Table 72: Rest of South America Multimodal Imaging Market Revenue (Million) Forecast, by Application 2019 & 2032
Frequently Asked Questions
1. What is the projected Compound Annual Growth Rate (CAGR) of the Multimodal Imaging Market?
The projected CAGR is approximately 5.20%.
2. Which companies are prominent players in the Multimodal Imaging Market?
Key companies in the market include Mediso Ltd, Siemens Healthineers, GE Healthcare, Koninklijke Philips N V, Spectrum Dynamics Medical, Neusoft Medical Systems Co Ltd, MILabs B V, Bruker Corporation*List Not Exhaustive.
3. What are the main segments of the Multimodal Imaging Market?
The market segments include Technology, Application, End-User.
4. Can you provide details about the market size?
The market size is estimated to be USD XX Million as of 2022.
5. What are some drivers contributing to market growth?
; Growing Prevalence of Chronic Illness; Technological Advancements in Diagnostic Imaging Modalities.
6. What are the notable trends driving market growth?
PET/CT Systems Segment is Expected to be the Fastest Growing Segment During the Forecast Period.
7. Are there any restraints impacting market growth?
; High Cost of Multimodal Imaging Systems; Shortage of Adequate Healthcare Infrastructure.
8. Can you provide examples of recent developments in the market?
N/A
9. What pricing options are available for accessing the report?
Pricing options include single-user, multi-user, and enterprise licenses priced at USD 4750, USD 5250, and USD 8750 respectively.
10. Is the market size provided in terms of value or volume?
The market size is provided in terms of value, measured in Million.
11. Are there any specific market keywords associated with the report?
Yes, the market keyword associated with the report is "Multimodal Imaging Market," which aids in identifying and referencing the specific market segment covered.
12. How do I determine which pricing option suits my needs best?
The pricing options vary based on user requirements and access needs. Individual users may opt for single-user licenses, while businesses requiring broader access may choose multi-user or enterprise licenses for cost-effective access to the report.
13. Are there any additional resources or data provided in the Multimodal Imaging Market report?
While the report offers comprehensive insights, it's advisable to review the specific contents or supplementary materials provided to ascertain if additional resources or data are available.
14. How can I stay updated on further developments or reports in the Multimodal Imaging Market?
To stay informed about further developments, trends, and reports in the Multimodal Imaging Market, consider subscribing to industry newsletters, following relevant companies and organizations, or regularly checking reputable industry news sources and publications.
Methodology
Step 1 - Identification of Relevant Samples Size from Population Database


Step 2 - Approaches for Defining Global Market Size (Value, Volume* & Price*)

Note*: In applicable scenarios
Step 3 - Data Sources
Primary Research
- Web Analytics
- Survey Reports
- Research Institute
- Latest Research Reports
- Opinion Leaders
Secondary Research
- Annual Reports
- White Paper
- Latest Press Release
- Industry Association
- Paid Database
- Investor Presentations

Step 4 - Data Triangulation
Involves using different sources of information in order to increase the validity of a study
These sources are likely to be stakeholders in a program - participants, other researchers, program staff, other community members, and so on.
Then we put all data in single framework & apply various statistical tools to find out the dynamic on the market.
During the analysis stage, feedback from the stakeholder groups would be compared to determine areas of agreement as well as areas of divergence
