

Key Insights
The MEA (Middle East and Africa) waterborne adhesives market, while smaller than established regions like North America or Europe, exhibits significant growth potential, driven by a burgeoning construction sector and increasing demand across various end-use industries. The market's Compound Annual Growth Rate (CAGR) exceeding 6% suggests a robust trajectory, fueled by factors such as rising urbanization, infrastructure development projects, and a growing preference for eco-friendly adhesive solutions. Waterborne adhesives are favored for their low volatile organic compound (VOC) emissions, contributing to healthier work environments and aligning with regional environmental regulations. Key growth segments include building and construction, where demand for adhesives in applications such as tiling, flooring, and wood working is high, and packaging, driven by the expanding food and beverage industries. The adoption of advanced adhesive technologies and formulations that offer enhanced performance characteristics – such as superior bonding strength, faster curing times, and increased water resistance – also contributes to market expansion. However, challenges remain, including price volatility of raw materials and the need to overcome established preferences for solvent-based adhesives in some sectors. Nevertheless, the long-term outlook for MEA waterborne adhesives is positive, particularly as the region continues its economic development and embraces sustainable practices.
Within the MEA region, specific countries like the UAE and Saudi Arabia are likely to experience faster growth due to large-scale infrastructure projects and increased construction activity. South Africa also presents a sizable market opportunity, driven by its industrial and manufacturing sectors. However, political and economic stability within certain countries will influence market growth significantly. The competitive landscape is characterized by a mix of both global and regional players, with international companies leveraging their established brand recognition and technological expertise to gain market share. Local players, however, often possess a strong understanding of regional needs and preferences, making the market dynamic and competitive. Growth strategies will likely involve partnerships, mergers and acquisitions, and a focus on product innovation to meet specific industry requirements and address environmental concerns. The market’s overall growth is thus anticipated to be driven by a confluence of factors encompassing regional development, technological advances, and the growing adoption of eco-friendly adhesives.
MEA Waterborne Adhesives Industry: A Comprehensive Market Report (2019-2033)
This insightful report provides a detailed analysis of the Middle East and Africa (MEA) waterborne adhesives market, offering a comprehensive overview of its current state, future trends, and key players. Covering the period from 2019 to 2033, with a base year of 2025 and a forecast period of 2025-2033, this report is an essential resource for stakeholders seeking to understand and capitalize on opportunities within this dynamic sector. The market is valued at xx Million in 2025 and is projected to reach xx Million by 2033, exhibiting a CAGR of xx% during the forecast period.
MEA Waterborne Adhesives Industry Market Composition & Trends
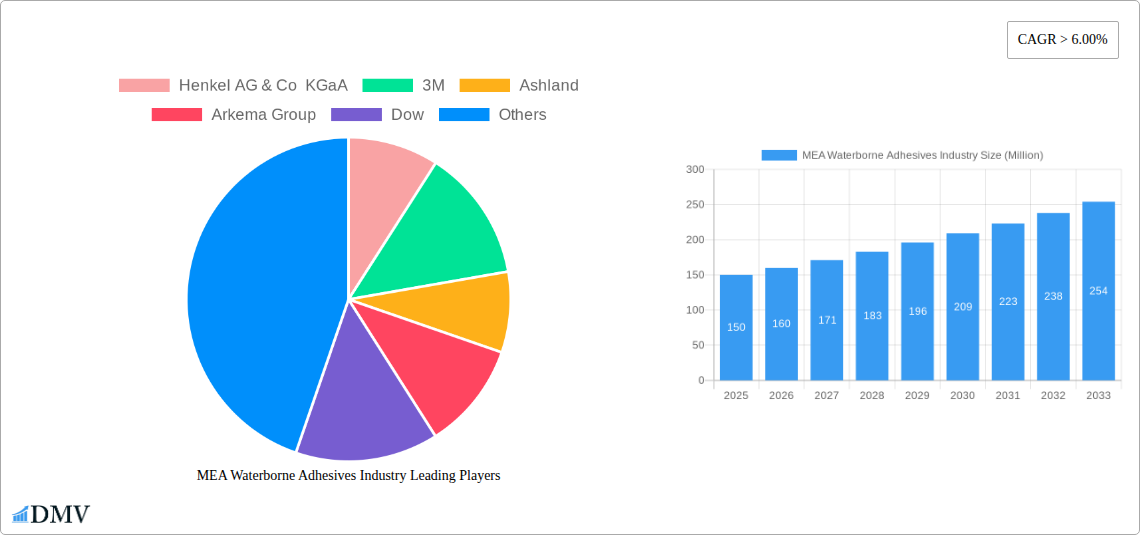
This section meticulously examines the MEA waterborne adhesives market's competitive landscape, highlighting key trends shaping its evolution. We analyze market concentration, revealing the market share distribution amongst leading players like Henkel AG & Co KGaA, 3M, Ashland, Arkema Group, Dow, Avery Dennison Corporation, Sika AG, and Wacker Chemie AG (list not exhaustive). The report also delves into innovation drivers, such as the increasing demand for eco-friendly adhesives and advancements in resin technology. Regulatory landscapes impacting the industry are thoroughly assessed, along with the emergence of substitute products and their market impact. Furthermore, the report examines end-user profiles across various sectors and analyzes M&A activities, including deal values and their influence on market dynamics.
- Market Share Distribution: A detailed breakdown of market share held by major players in 2025, with projections for 2033.
- M&A Activity: Analysis of significant mergers and acquisitions within the MEA waterborne adhesives market during the historical period (2019-2024), including deal values (xx Million).
- Innovation Catalysts: Discussion of technological advancements driving innovation, such as the development of bio-based adhesives and improved performance characteristics.
- Regulatory Landscape: Assessment of relevant regulations and their impact on market growth and product development.
MEA Waterborne Adhesives Industry Industry Evolution
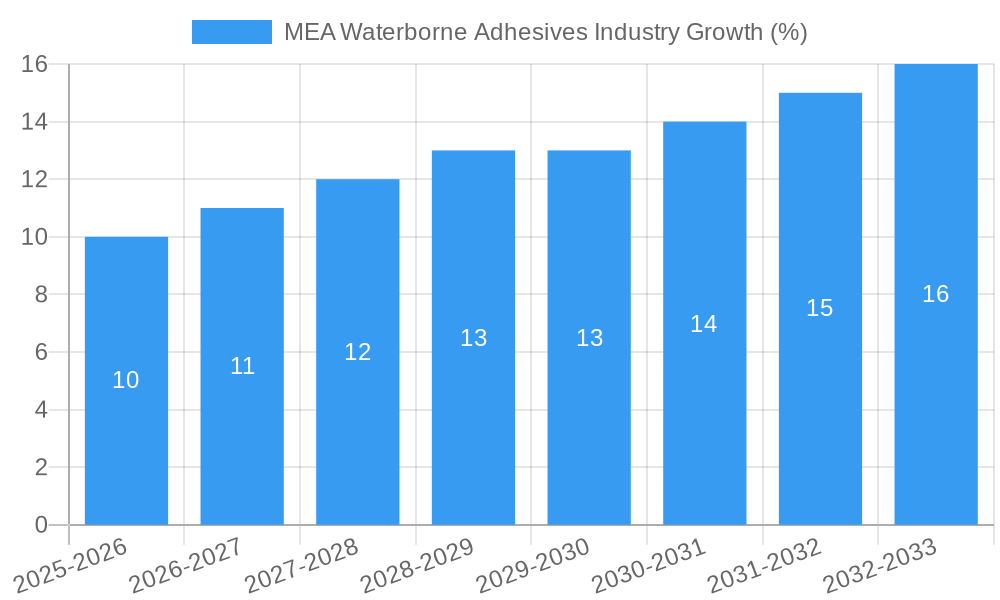
This section provides a detailed analysis of the MEA waterborne adhesives market's evolutionary trajectory. We explore the historical growth (2019-2024) and project future expansion (2025-2033), identifying key growth drivers and challenges. The analysis incorporates technological advancements, such as the development of high-performance waterborne adhesives with improved adhesion, flexibility, and durability. We also consider shifting consumer demands, focusing on the increasing preference for sustainable and eco-friendly products. Specific data points, including growth rates and adoption metrics for various resin types and end-user industries, are provided. Factors such as the rising construction activity, growth of the packaging industry, and increasing demand for eco-friendly solutions are meticulously analyzed.
Leading Regions, Countries, or Segments in MEA Waterborne Adhesives Industry
This section pinpoints the leading regions, countries, and segments within the MEA waterborne adhesives market. Through detailed analysis, we identify dominant players across different resin types (Acrylics, Polyvinyl Acetate (PVA) Emulsion, Ethylene Vinyl Acetate (EVA) Emulsion, Polyurethane Dispersions and CR (Chloroprene Rubber) Latex, Other Resin Types) and end-user industries (Building & Construction, Paper, Board, and Packaging, Woodworking & Joinery, Transportation, Healthcare, Electrical & Electronics, Other End-user Industries). The analysis underscores the factors driving their dominance, including investment trends, regulatory support, and economic growth.
- Key Drivers (Building & Construction Segment):
- Significant infrastructure development projects across the MEA region.
- Government initiatives promoting sustainable construction practices.
- Key Drivers (Paper, Board, and Packaging Segment):
- Rapid growth of the e-commerce sector driving demand for packaging materials.
- Increasing consumer preference for sustainable packaging solutions.
- Dominant Resin Type: Detailed analysis of the market share and growth projections for each resin type, highlighting the factors contributing to their dominance.
MEA Waterborne Adhesives Industry Product Innovations
This section highlights recent product innovations and technological advancements in the MEA waterborne adhesives market. We examine the introduction of new adhesive formulations with enhanced properties, such as improved adhesion, faster curing times, and increased durability. The discussion includes a focus on unique selling propositions and the applications of these innovative products across various end-user industries. This analysis showcases how these developments contribute to improved performance and efficiency in various applications.
Propelling Factors for MEA Waterborne Adhesives Industry Growth
Several key factors are driving the growth of the MEA waterborne adhesives market. These include the rising demand for eco-friendly adhesives due to increasing environmental concerns, coupled with the growing construction and packaging sectors in the region. Technological advancements, leading to improved adhesive performance and cost-effectiveness, also contribute significantly. Government regulations promoting sustainable building practices further bolster market expansion.
Obstacles in the MEA Waterborne Adhesives Industry Market
The MEA waterborne adhesives market faces certain challenges, including fluctuations in raw material prices and potential supply chain disruptions. Stringent environmental regulations and intense competition from established players also pose obstacles to market growth. Furthermore, economic volatility in certain MEA countries can affect overall demand for waterborne adhesives.
Future Opportunities in MEA Waterborne Adhesives Industry
The MEA waterborne adhesives market presents promising future opportunities, particularly in the growing renewable energy sector and the expansion of sustainable packaging solutions. The increasing demand for specialized adhesives in niche applications, such as medical devices and electronics, also creates significant growth potential. Exploring new markets and leveraging technological advancements to develop high-performance, eco-friendly adhesives presents promising avenues for market expansion.
Major Players in the MEA Waterborne Adhesives Industry Ecosystem
- Henkel AG & Co KGaA
- 3M
- Ashland
- Arkema Group
- Dow
- Avery Dennison Corporation
- Sika AG
- Wacker Chemie AG
- List Not Exhaustive
Key Developments in MEA Waterborne Adhesives Industry Industry
- January 2023: Launch of a new bio-based waterborne adhesive by Company X.
- June 2022: Merger between Company Y and Company Z, creating a larger player in the MEA market.
- October 2021: Introduction of a new high-performance waterborne adhesive by Company A, targeting the construction sector. (Further key developments with year/month and impact will be detailed in the full report)
Strategic MEA Waterborne Adhesives Industry Market Forecast
The MEA waterborne adhesives market is poised for robust growth, driven by increasing demand across various end-user industries and the adoption of sustainable technologies. The market's future trajectory will be shaped by technological advancements, supportive government policies, and the continuing expansion of key industry sectors in the region. This growth is expected to be particularly strong in segments focused on sustainable and high-performance adhesive solutions.
MEA Waterborne Adhesives Industry Segmentation
-
1. Resin Type
- 1.1. Acrylics
- 1.2. Polyvinyl Acetate (PVA) Emulsion
- 1.3. Ethylene Vinyl Acetate (EVA) Emulsion
- 1.4. Polyuret
- 1.5. Other Resin Types
-
2. End-user Industry
- 2.1. Building & Construction
- 2.2. Paper, Board, and Packaging
- 2.3. Woodworking & Joinery
- 2.4. Transportation
- 2.5. Healthcare
- 2.6. Electrical & Electronics
- 2.7. Other End-user Industries
-
3. Geography
- 3.1. Saudi Arabia
- 3.2. South Africa
- 3.3. Rest of Middle-East and Africa
MEA Waterborne Adhesives Industry Segmentation By Geography
- 1. Saudi Arabia
- 2. South Africa
- 3. Rest of Middle East and Africa
MEA Waterborne Adhesives Industry REPORT HIGHLIGHTS
| Aspects | Details |
|---|---|
| Study Period | 2019-2033 |
| Base Year | 2024 |
| Estimated Year | 2025 |
| Forecast Period | 2025-2033 |
| Historical Period | 2019-2024 |
| Growth Rate | CAGR of > 6.00% from 2019-2033 |
| Segmentation |
|
Table of Contents
- 1. Introduction
- 1.1. Research Scope
- 1.2. Market Segmentation
- 1.3. Research Methodology
- 1.4. Definitions and Assumptions
- 2. Executive Summary
- 2.1. Introduction
- 3. Market Dynamics
- 3.1. Introduction
- 3.2. Market Drivers
- 3.2.1. ; Availability of Raw Materials and Low Production Cost; Increasing Demand from Construction Industry
- 3.3. Market Restrains
- 3.3.1. ; Limited Usage in High End Applications; Other Restraints
- 3.4. Market Trends
- 3.4.1. Building & Construction to Dominate the Market
- 4. Market Factor Analysis
- 4.1. Porters Five Forces
- 4.2. Supply/Value Chain
- 4.3. PESTEL analysis
- 4.4. Market Entropy
- 4.5. Patent/Trademark Analysis
- 5. Global MEA Waterborne Adhesives Industry Analysis, Insights and Forecast, 2019-2031
- 5.1. Market Analysis, Insights and Forecast - by Resin Type
- 5.1.1. Acrylics
- 5.1.2. Polyvinyl Acetate (PVA) Emulsion
- 5.1.3. Ethylene Vinyl Acetate (EVA) Emulsion
- 5.1.4. Polyuret
- 5.1.5. Other Resin Types
- 5.2. Market Analysis, Insights and Forecast - by End-user Industry
- 5.2.1. Building & Construction
- 5.2.2. Paper, Board, and Packaging
- 5.2.3. Woodworking & Joinery
- 5.2.4. Transportation
- 5.2.5. Healthcare
- 5.2.6. Electrical & Electronics
- 5.2.7. Other End-user Industries
- 5.3. Market Analysis, Insights and Forecast - by Geography
- 5.3.1. Saudi Arabia
- 5.3.2. South Africa
- 5.3.3. Rest of Middle-East and Africa
- 5.4. Market Analysis, Insights and Forecast - by Region
- 5.4.1. Saudi Arabia
- 5.4.2. South Africa
- 5.4.3. Rest of Middle East and Africa
- 5.1. Market Analysis, Insights and Forecast - by Resin Type
- 6. Saudi Arabia MEA Waterborne Adhesives Industry Analysis, Insights and Forecast, 2019-2031
- 6.1. Market Analysis, Insights and Forecast - by Resin Type
- 6.1.1. Acrylics
- 6.1.2. Polyvinyl Acetate (PVA) Emulsion
- 6.1.3. Ethylene Vinyl Acetate (EVA) Emulsion
- 6.1.4. Polyuret
- 6.1.5. Other Resin Types
- 6.2. Market Analysis, Insights and Forecast - by End-user Industry
- 6.2.1. Building & Construction
- 6.2.2. Paper, Board, and Packaging
- 6.2.3. Woodworking & Joinery
- 6.2.4. Transportation
- 6.2.5. Healthcare
- 6.2.6. Electrical & Electronics
- 6.2.7. Other End-user Industries
- 6.3. Market Analysis, Insights and Forecast - by Geography
- 6.3.1. Saudi Arabia
- 6.3.2. South Africa
- 6.3.3. Rest of Middle-East and Africa
- 6.1. Market Analysis, Insights and Forecast - by Resin Type
- 7. South Africa MEA Waterborne Adhesives Industry Analysis, Insights and Forecast, 2019-2031
- 7.1. Market Analysis, Insights and Forecast - by Resin Type
- 7.1.1. Acrylics
- 7.1.2. Polyvinyl Acetate (PVA) Emulsion
- 7.1.3. Ethylene Vinyl Acetate (EVA) Emulsion
- 7.1.4. Polyuret
- 7.1.5. Other Resin Types
- 7.2. Market Analysis, Insights and Forecast - by End-user Industry
- 7.2.1. Building & Construction
- 7.2.2. Paper, Board, and Packaging
- 7.2.3. Woodworking & Joinery
- 7.2.4. Transportation
- 7.2.5. Healthcare
- 7.2.6. Electrical & Electronics
- 7.2.7. Other End-user Industries
- 7.3. Market Analysis, Insights and Forecast - by Geography
- 7.3.1. Saudi Arabia
- 7.3.2. South Africa
- 7.3.3. Rest of Middle-East and Africa
- 7.1. Market Analysis, Insights and Forecast - by Resin Type
- 8. Rest of Middle East and Africa MEA Waterborne Adhesives Industry Analysis, Insights and Forecast, 2019-2031
- 8.1. Market Analysis, Insights and Forecast - by Resin Type
- 8.1.1. Acrylics
- 8.1.2. Polyvinyl Acetate (PVA) Emulsion
- 8.1.3. Ethylene Vinyl Acetate (EVA) Emulsion
- 8.1.4. Polyuret
- 8.1.5. Other Resin Types
- 8.2. Market Analysis, Insights and Forecast - by End-user Industry
- 8.2.1. Building & Construction
- 8.2.2. Paper, Board, and Packaging
- 8.2.3. Woodworking & Joinery
- 8.2.4. Transportation
- 8.2.5. Healthcare
- 8.2.6. Electrical & Electronics
- 8.2.7. Other End-user Industries
- 8.3. Market Analysis, Insights and Forecast - by Geography
- 8.3.1. Saudi Arabia
- 8.3.2. South Africa
- 8.3.3. Rest of Middle-East and Africa
- 8.1. Market Analysis, Insights and Forecast - by Resin Type
- 9. North America MEA Waterborne Adhesives Industry Analysis, Insights and Forecast, 2019-2031
- 9.1. Market Analysis, Insights and Forecast - By Country/Sub-region
- 9.1.1 United States
- 9.1.2 Canada
- 9.1.3 Mexico
- 10. Europe MEA Waterborne Adhesives Industry Analysis, Insights and Forecast, 2019-2031
- 10.1. Market Analysis, Insights and Forecast - By Country/Sub-region
- 10.1.1 Germany
- 10.1.2 United Kingdom
- 10.1.3 France
- 10.1.4 Spain
- 10.1.5 Italy
- 10.1.6 Spain
- 10.1.7 Belgium
- 10.1.8 Netherland
- 10.1.9 Nordics
- 10.1.10 Rest of Europe
- 11. Asia Pacific MEA Waterborne Adhesives Industry Analysis, Insights and Forecast, 2019-2031
- 11.1. Market Analysis, Insights and Forecast - By Country/Sub-region
- 11.1.1 China
- 11.1.2 Japan
- 11.1.3 India
- 11.1.4 South Korea
- 11.1.5 Southeast Asia
- 11.1.6 Australia
- 11.1.7 Indonesia
- 11.1.8 Phillipes
- 11.1.9 Singapore
- 11.1.10 Thailandc
- 11.1.11 Rest of Asia Pacific
- 12. South America MEA Waterborne Adhesives Industry Analysis, Insights and Forecast, 2019-2031
- 12.1. Market Analysis, Insights and Forecast - By Country/Sub-region
- 12.1.1 Brazil
- 12.1.2 Argentina
- 12.1.3 Peru
- 12.1.4 Chile
- 12.1.5 Colombia
- 12.1.6 Ecuador
- 12.1.7 Venezuela
- 12.1.8 Rest of South America
- 13. North America MEA Waterborne Adhesives Industry Analysis, Insights and Forecast, 2019-2031
- 13.1. Market Analysis, Insights and Forecast - By Country/Sub-region
- 13.1.1 United States
- 13.1.2 Canada
- 13.1.3 Mexico
- 14. MEA MEA Waterborne Adhesives Industry Analysis, Insights and Forecast, 2019-2031
- 14.1. Market Analysis, Insights and Forecast - By Country/Sub-region
- 14.1.1 United Arab Emirates
- 14.1.2 Saudi Arabia
- 14.1.3 South Africa
- 14.1.4 Rest of Middle East and Africa
- 15. Competitive Analysis
- 15.1. Global Market Share Analysis 2024
- 15.2. Company Profiles
- 15.2.1 Henkel AG & Co KGaA
- 15.2.1.1. Overview
- 15.2.1.2. Products
- 15.2.1.3. SWOT Analysis
- 15.2.1.4. Recent Developments
- 15.2.1.5. Financials (Based on Availability)
- 15.2.2 3M
- 15.2.2.1. Overview
- 15.2.2.2. Products
- 15.2.2.3. SWOT Analysis
- 15.2.2.4. Recent Developments
- 15.2.2.5. Financials (Based on Availability)
- 15.2.3 Ashland
- 15.2.3.1. Overview
- 15.2.3.2. Products
- 15.2.3.3. SWOT Analysis
- 15.2.3.4. Recent Developments
- 15.2.3.5. Financials (Based on Availability)
- 15.2.4 Arkema Group
- 15.2.4.1. Overview
- 15.2.4.2. Products
- 15.2.4.3. SWOT Analysis
- 15.2.4.4. Recent Developments
- 15.2.4.5. Financials (Based on Availability)
- 15.2.5 Dow
- 15.2.5.1. Overview
- 15.2.5.2. Products
- 15.2.5.3. SWOT Analysis
- 15.2.5.4. Recent Developments
- 15.2.5.5. Financials (Based on Availability)
- 15.2.6 Avery Dennison Corporation
- 15.2.6.1. Overview
- 15.2.6.2. Products
- 15.2.6.3. SWOT Analysis
- 15.2.6.4. Recent Developments
- 15.2.6.5. Financials (Based on Availability)
- 15.2.7 Sika AG
- 15.2.7.1. Overview
- 15.2.7.2. Products
- 15.2.7.3. SWOT Analysis
- 15.2.7.4. Recent Developments
- 15.2.7.5. Financials (Based on Availability)
- 15.2.8 Wacker Chemie AG*List Not Exhaustive
- 15.2.8.1. Overview
- 15.2.8.2. Products
- 15.2.8.3. SWOT Analysis
- 15.2.8.4. Recent Developments
- 15.2.8.5. Financials (Based on Availability)
- 15.2.1 Henkel AG & Co KGaA
List of Figures
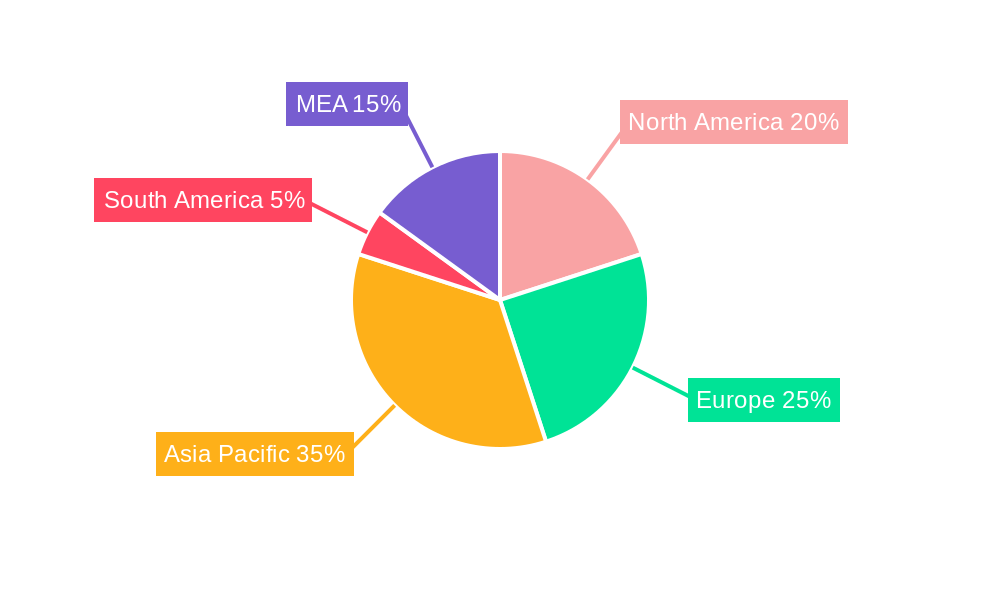
- Figure 1: Global MEA Waterborne Adhesives Industry Revenue Breakdown (Million, %) by Region 2024 & 2032
- Figure 2: North America MEA Waterborne Adhesives Industry Revenue (Million), by Country 2024 & 2032
- Figure 3: North America MEA Waterborne Adhesives Industry Revenue Share (%), by Country 2024 & 2032
- Figure 4: Europe MEA Waterborne Adhesives Industry Revenue (Million), by Country 2024 & 2032
- Figure 5: Europe MEA Waterborne Adhesives Industry Revenue Share (%), by Country 2024 & 2032
- Figure 6: Asia Pacific MEA Waterborne Adhesives Industry Revenue (Million), by Country 2024 & 2032
- Figure 7: Asia Pacific MEA Waterborne Adhesives Industry Revenue Share (%), by Country 2024 & 2032
- Figure 8: South America MEA Waterborne Adhesives Industry Revenue (Million), by Country 2024 & 2032
- Figure 9: South America MEA Waterborne Adhesives Industry Revenue Share (%), by Country 2024 & 2032
- Figure 10: North America MEA Waterborne Adhesives Industry Revenue (Million), by Country 2024 & 2032
- Figure 11: North America MEA Waterborne Adhesives Industry Revenue Share (%), by Country 2024 & 2032
- Figure 12: MEA MEA Waterborne Adhesives Industry Revenue (Million), by Country 2024 & 2032
- Figure 13: MEA MEA Waterborne Adhesives Industry Revenue Share (%), by Country 2024 & 2032
- Figure 14: Saudi Arabia MEA Waterborne Adhesives Industry Revenue (Million), by Resin Type 2024 & 2032
- Figure 15: Saudi Arabia MEA Waterborne Adhesives Industry Revenue Share (%), by Resin Type 2024 & 2032
- Figure 16: Saudi Arabia MEA Waterborne Adhesives Industry Revenue (Million), by End-user Industry 2024 & 2032
- Figure 17: Saudi Arabia MEA Waterborne Adhesives Industry Revenue Share (%), by End-user Industry 2024 & 2032
- Figure 18: Saudi Arabia MEA Waterborne Adhesives Industry Revenue (Million), by Geography 2024 & 2032
- Figure 19: Saudi Arabia MEA Waterborne Adhesives Industry Revenue Share (%), by Geography 2024 & 2032
- Figure 20: Saudi Arabia MEA Waterborne Adhesives Industry Revenue (Million), by Country 2024 & 2032
- Figure 21: Saudi Arabia MEA Waterborne Adhesives Industry Revenue Share (%), by Country 2024 & 2032
- Figure 22: South Africa MEA Waterborne Adhesives Industry Revenue (Million), by Resin Type 2024 & 2032
- Figure 23: South Africa MEA Waterborne Adhesives Industry Revenue Share (%), by Resin Type 2024 & 2032
- Figure 24: South Africa MEA Waterborne Adhesives Industry Revenue (Million), by End-user Industry 2024 & 2032
- Figure 25: South Africa MEA Waterborne Adhesives Industry Revenue Share (%), by End-user Industry 2024 & 2032
- Figure 26: South Africa MEA Waterborne Adhesives Industry Revenue (Million), by Geography 2024 & 2032
- Figure 27: South Africa MEA Waterborne Adhesives Industry Revenue Share (%), by Geography 2024 & 2032
- Figure 28: South Africa MEA Waterborne Adhesives Industry Revenue (Million), by Country 2024 & 2032
- Figure 29: South Africa MEA Waterborne Adhesives Industry Revenue Share (%), by Country 2024 & 2032
- Figure 30: Rest of Middle East and Africa MEA Waterborne Adhesives Industry Revenue (Million), by Resin Type 2024 & 2032
- Figure 31: Rest of Middle East and Africa MEA Waterborne Adhesives Industry Revenue Share (%), by Resin Type 2024 & 2032
- Figure 32: Rest of Middle East and Africa MEA Waterborne Adhesives Industry Revenue (Million), by End-user Industry 2024 & 2032
- Figure 33: Rest of Middle East and Africa MEA Waterborne Adhesives Industry Revenue Share (%), by End-user Industry 2024 & 2032
- Figure 34: Rest of Middle East and Africa MEA Waterborne Adhesives Industry Revenue (Million), by Geography 2024 & 2032
- Figure 35: Rest of Middle East and Africa MEA Waterborne Adhesives Industry Revenue Share (%), by Geography 2024 & 2032
- Figure 36: Rest of Middle East and Africa MEA Waterborne Adhesives Industry Revenue (Million), by Country 2024 & 2032
- Figure 37: Rest of Middle East and Africa MEA Waterborne Adhesives Industry Revenue Share (%), by Country 2024 & 2032
List of Tables
- Table 1: Global MEA Waterborne Adhesives Industry Revenue Million Forecast, by Region 2019 & 2032
- Table 2: Global MEA Waterborne Adhesives Industry Revenue Million Forecast, by Resin Type 2019 & 2032
- Table 3: Global MEA Waterborne Adhesives Industry Revenue Million Forecast, by End-user Industry 2019 & 2032
- Table 4: Global MEA Waterborne Adhesives Industry Revenue Million Forecast, by Geography 2019 & 2032
- Table 5: Global MEA Waterborne Adhesives Industry Revenue Million Forecast, by Region 2019 & 2032
- Table 6: Global MEA Waterborne Adhesives Industry Revenue Million Forecast, by Country 2019 & 2032
- Table 7: United States MEA Waterborne Adhesives Industry Revenue (Million) Forecast, by Application 2019 & 2032
- Table 8: Canada MEA Waterborne Adhesives Industry Revenue (Million) Forecast, by Application 2019 & 2032
- Table 9: Mexico MEA Waterborne Adhesives Industry Revenue (Million) Forecast, by Application 2019 & 2032
- Table 10: Global MEA Waterborne Adhesives Industry Revenue Million Forecast, by Country 2019 & 2032
- Table 11: Germany MEA Waterborne Adhesives Industry Revenue (Million) Forecast, by Application 2019 & 2032
- Table 12: United Kingdom MEA Waterborne Adhesives Industry Revenue (Million) Forecast, by Application 2019 & 2032
- Table 13: France MEA Waterborne Adhesives Industry Revenue (Million) Forecast, by Application 2019 & 2032
- Table 14: Spain MEA Waterborne Adhesives Industry Revenue (Million) Forecast, by Application 2019 & 2032
- Table 15: Italy MEA Waterborne Adhesives Industry Revenue (Million) Forecast, by Application 2019 & 2032
- Table 16: Spain MEA Waterborne Adhesives Industry Revenue (Million) Forecast, by Application 2019 & 2032
- Table 17: Belgium MEA Waterborne Adhesives Industry Revenue (Million) Forecast, by Application 2019 & 2032
- Table 18: Netherland MEA Waterborne Adhesives Industry Revenue (Million) Forecast, by Application 2019 & 2032
- Table 19: Nordics MEA Waterborne Adhesives Industry Revenue (Million) Forecast, by Application 2019 & 2032
- Table 20: Rest of Europe MEA Waterborne Adhesives Industry Revenue (Million) Forecast, by Application 2019 & 2032
- Table 21: Global MEA Waterborne Adhesives Industry Revenue Million Forecast, by Country 2019 & 2032
- Table 22: China MEA Waterborne Adhesives Industry Revenue (Million) Forecast, by Application 2019 & 2032
- Table 23: Japan MEA Waterborne Adhesives Industry Revenue (Million) Forecast, by Application 2019 & 2032
- Table 24: India MEA Waterborne Adhesives Industry Revenue (Million) Forecast, by Application 2019 & 2032
- Table 25: South Korea MEA Waterborne Adhesives Industry Revenue (Million) Forecast, by Application 2019 & 2032
- Table 26: Southeast Asia MEA Waterborne Adhesives Industry Revenue (Million) Forecast, by Application 2019 & 2032
- Table 27: Australia MEA Waterborne Adhesives Industry Revenue (Million) Forecast, by Application 2019 & 2032
- Table 28: Indonesia MEA Waterborne Adhesives Industry Revenue (Million) Forecast, by Application 2019 & 2032
- Table 29: Phillipes MEA Waterborne Adhesives Industry Revenue (Million) Forecast, by Application 2019 & 2032
- Table 30: Singapore MEA Waterborne Adhesives Industry Revenue (Million) Forecast, by Application 2019 & 2032
- Table 31: Thailandc MEA Waterborne Adhesives Industry Revenue (Million) Forecast, by Application 2019 & 2032
- Table 32: Rest of Asia Pacific MEA Waterborne Adhesives Industry Revenue (Million) Forecast, by Application 2019 & 2032
- Table 33: Global MEA Waterborne Adhesives Industry Revenue Million Forecast, by Country 2019 & 2032
- Table 34: Brazil MEA Waterborne Adhesives Industry Revenue (Million) Forecast, by Application 2019 & 2032
- Table 35: Argentina MEA Waterborne Adhesives Industry Revenue (Million) Forecast, by Application 2019 & 2032
- Table 36: Peru MEA Waterborne Adhesives Industry Revenue (Million) Forecast, by Application 2019 & 2032
- Table 37: Chile MEA Waterborne Adhesives Industry Revenue (Million) Forecast, by Application 2019 & 2032
- Table 38: Colombia MEA Waterborne Adhesives Industry Revenue (Million) Forecast, by Application 2019 & 2032
- Table 39: Ecuador MEA Waterborne Adhesives Industry Revenue (Million) Forecast, by Application 2019 & 2032
- Table 40: Venezuela MEA Waterborne Adhesives Industry Revenue (Million) Forecast, by Application 2019 & 2032
- Table 41: Rest of South America MEA Waterborne Adhesives Industry Revenue (Million) Forecast, by Application 2019 & 2032
- Table 42: Global MEA Waterborne Adhesives Industry Revenue Million Forecast, by Country 2019 & 2032
- Table 43: United States MEA Waterborne Adhesives Industry Revenue (Million) Forecast, by Application 2019 & 2032
- Table 44: Canada MEA Waterborne Adhesives Industry Revenue (Million) Forecast, by Application 2019 & 2032
- Table 45: Mexico MEA Waterborne Adhesives Industry Revenue (Million) Forecast, by Application 2019 & 2032
- Table 46: Global MEA Waterborne Adhesives Industry Revenue Million Forecast, by Country 2019 & 2032
- Table 47: United Arab Emirates MEA Waterborne Adhesives Industry Revenue (Million) Forecast, by Application 2019 & 2032
- Table 48: Saudi Arabia MEA Waterborne Adhesives Industry Revenue (Million) Forecast, by Application 2019 & 2032
- Table 49: South Africa MEA Waterborne Adhesives Industry Revenue (Million) Forecast, by Application 2019 & 2032
- Table 50: Rest of Middle East and Africa MEA Waterborne Adhesives Industry Revenue (Million) Forecast, by Application 2019 & 2032
- Table 51: Global MEA Waterborne Adhesives Industry Revenue Million Forecast, by Resin Type 2019 & 2032
- Table 52: Global MEA Waterborne Adhesives Industry Revenue Million Forecast, by End-user Industry 2019 & 2032
- Table 53: Global MEA Waterborne Adhesives Industry Revenue Million Forecast, by Geography 2019 & 2032
- Table 54: Global MEA Waterborne Adhesives Industry Revenue Million Forecast, by Country 2019 & 2032
- Table 55: Global MEA Waterborne Adhesives Industry Revenue Million Forecast, by Resin Type 2019 & 2032
- Table 56: Global MEA Waterborne Adhesives Industry Revenue Million Forecast, by End-user Industry 2019 & 2032
- Table 57: Global MEA Waterborne Adhesives Industry Revenue Million Forecast, by Geography 2019 & 2032
- Table 58: Global MEA Waterborne Adhesives Industry Revenue Million Forecast, by Country 2019 & 2032
- Table 59: Global MEA Waterborne Adhesives Industry Revenue Million Forecast, by Resin Type 2019 & 2032
- Table 60: Global MEA Waterborne Adhesives Industry Revenue Million Forecast, by End-user Industry 2019 & 2032
- Table 61: Global MEA Waterborne Adhesives Industry Revenue Million Forecast, by Geography 2019 & 2032
- Table 62: Global MEA Waterborne Adhesives Industry Revenue Million Forecast, by Country 2019 & 2032
Frequently Asked Questions
1. What is the projected Compound Annual Growth Rate (CAGR) of the MEA Waterborne Adhesives Industry?
The projected CAGR is approximately > 6.00%.
2. Which companies are prominent players in the MEA Waterborne Adhesives Industry?
Key companies in the market include Henkel AG & Co KGaA, 3M, Ashland, Arkema Group, Dow, Avery Dennison Corporation, Sika AG, Wacker Chemie AG*List Not Exhaustive.
3. What are the main segments of the MEA Waterborne Adhesives Industry?
The market segments include Resin Type, End-user Industry, Geography.
4. Can you provide details about the market size?
The market size is estimated to be USD XX Million as of 2022.
5. What are some drivers contributing to market growth?
; Availability of Raw Materials and Low Production Cost; Increasing Demand from Construction Industry.
6. What are the notable trends driving market growth?
Building & Construction to Dominate the Market.
7. Are there any restraints impacting market growth?
; Limited Usage in High End Applications; Other Restraints.
8. Can you provide examples of recent developments in the market?
N/A
9. What pricing options are available for accessing the report?
Pricing options include single-user, multi-user, and enterprise licenses priced at USD 4750, USD 5250, and USD 8750 respectively.
10. Is the market size provided in terms of value or volume?
The market size is provided in terms of value, measured in Million.
11. Are there any specific market keywords associated with the report?
Yes, the market keyword associated with the report is "MEA Waterborne Adhesives Industry," which aids in identifying and referencing the specific market segment covered.
12. How do I determine which pricing option suits my needs best?
The pricing options vary based on user requirements and access needs. Individual users may opt for single-user licenses, while businesses requiring broader access may choose multi-user or enterprise licenses for cost-effective access to the report.
13. Are there any additional resources or data provided in the MEA Waterborne Adhesives Industry report?
While the report offers comprehensive insights, it's advisable to review the specific contents or supplementary materials provided to ascertain if additional resources or data are available.
14. How can I stay updated on further developments or reports in the MEA Waterborne Adhesives Industry?
To stay informed about further developments, trends, and reports in the MEA Waterborne Adhesives Industry, consider subscribing to industry newsletters, following relevant companies and organizations, or regularly checking reputable industry news sources and publications.
Methodology
Step 1 - Identification of Relevant Samples Size from Population Database


Step 2 - Approaches for Defining Global Market Size (Value, Volume* & Price*)

Note*: In applicable scenarios
Step 3 - Data Sources
Primary Research
- Web Analytics
- Survey Reports
- Research Institute
- Latest Research Reports
- Opinion Leaders
Secondary Research
- Annual Reports
- White Paper
- Latest Press Release
- Industry Association
- Paid Database
- Investor Presentations

Step 4 - Data Triangulation
Involves using different sources of information in order to increase the validity of a study
These sources are likely to be stakeholders in a program - participants, other researchers, program staff, other community members, and so on.
Then we put all data in single framework & apply various statistical tools to find out the dynamic on the market.
During the analysis stage, feedback from the stakeholder groups would be compared to determine areas of agreement as well as areas of divergence
