

Key Insights
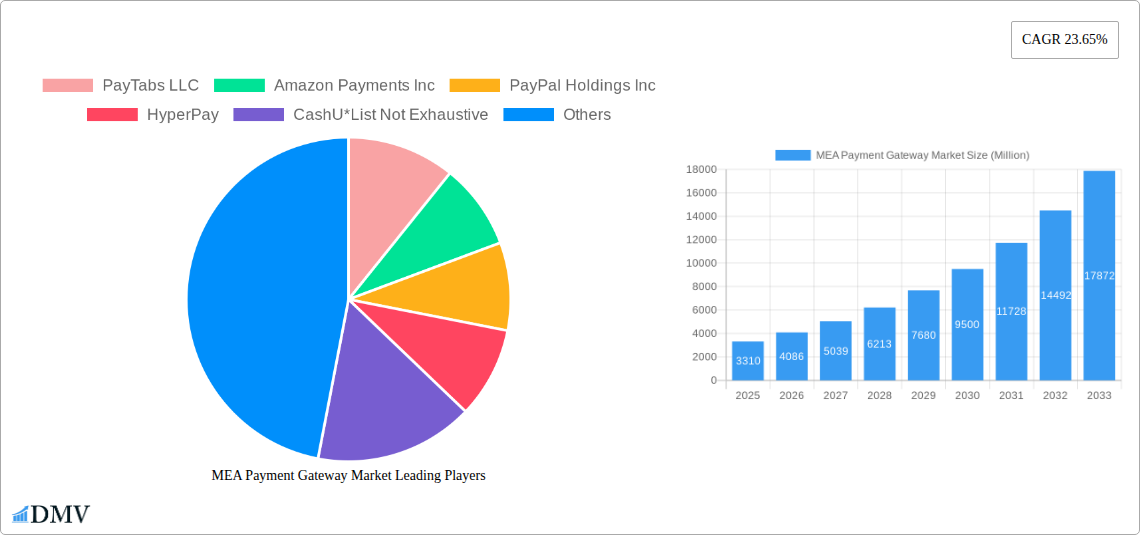
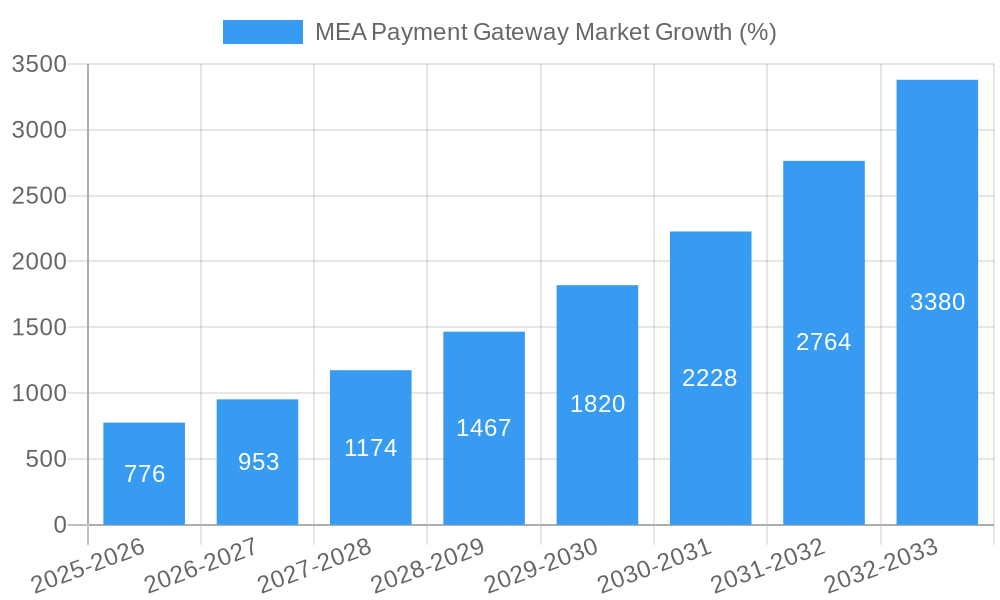
The Middle East and Africa (MEA) Payment Gateway Market is experiencing robust growth, projected to reach \$3.31 billion in 2025 and exhibiting a Compound Annual Growth Rate (CAGR) of 23.65% from 2025 to 2033. This expansion is fueled by several key drivers. The increasing adoption of e-commerce and digital transactions across the MEA region, spurred by rising smartphone penetration and internet connectivity, is a significant factor. Furthermore, the region's burgeoning fintech sector, characterized by innovative payment solutions and increased investment in digital infrastructure, is accelerating market growth. Government initiatives promoting financial inclusion and digitalization are also playing a crucial role. Consumers are increasingly demanding convenient and secure online payment options, further propelling the market's expansion. Competition among established players like PayPal Holdings Inc, Amazon Payments Inc, and PayTabs LLC, alongside the emergence of regional fintech companies such as HyperPay and CashU, is fostering innovation and driving down transaction costs, making online payments more accessible to a wider consumer base.
However, challenges remain. Regulatory hurdles and varying levels of digital literacy across the MEA region pose some constraints to market penetration. Concerns about data security and fraud prevention also require ongoing attention from both payment gateway providers and consumers. Nevertheless, the overall market outlook remains positive. The continued growth of e-commerce, coupled with ongoing investments in digital infrastructure and financial inclusion programs, suggests that the MEA Payment Gateway Market will maintain its strong trajectory throughout the forecast period (2025-2033). The increasing preference for contactless payments and mobile wallets will further solidify the market's upward trend, presenting considerable opportunities for both established and emerging players.
MEA Payment Gateway Market: A Comprehensive Report (2019-2033)
This insightful report provides a deep dive into the dynamics of the Middle East and Africa (MEA) Payment Gateway Market, offering a comprehensive analysis of its current state and future trajectory. With a study period spanning 2019-2033, a base year of 2025, and a forecast period of 2025-2033, this report is an essential resource for stakeholders seeking to understand and capitalize on the opportunities within this rapidly evolving market. The market is projected to reach xx Million by 2033, demonstrating significant growth potential.
MEA Payment Gateway Market Composition & Trends
This section analyzes the MEA payment gateway market's competitive landscape, technological advancements, and regulatory influences, offering crucial insights into its current state and future trajectory. We delve into market concentration, identifying key players and their market share distribution. Innovation catalysts, regulatory landscapes impacting market growth, and the prevalence of substitute products are thoroughly explored. The report also profiles end-users and examines M&A activities, including deal values and their implications for market consolidation. The analysis reveals a dynamic market characterized by increasing competition, technological innovation, and evolving regulatory frameworks.
- Market Concentration: The market is moderately concentrated, with a few major players holding significant market share, while numerous smaller players compete for the remaining portion. PayPal Holdings Inc and PayTabs LLC are estimated to hold xx% and xx% market share, respectively, in 2025.
- Innovation Catalysts: The rapid adoption of mobile technology and e-commerce in the MEA region is driving innovation in payment gateway solutions.
- Regulatory Landscape: Government initiatives to promote financial inclusion and digital payments are shaping the regulatory environment and influencing market growth.
- M&A Activities: The report analyzes recent mergers and acquisitions, highlighting their impact on market consolidation and competitive dynamics. Total M&A deal values in the MEA payment gateway market during 2019-2024 are estimated at xx Million.
MEA Payment Gateway Market Industry Evolution
This section meticulously examines the historical and projected growth trajectories of the MEA payment gateway market. We detail the technological advancements driving market expansion, including the rise of mobile payment solutions and the increasing adoption of cloud-based infrastructure. The report also explores the evolution of consumer demands, highlighting the preferences for secure, convenient, and user-friendly payment options. Specific data points, such as compound annual growth rates (CAGR) and adoption metrics for various payment methods, are provided to illustrate market trends. The market experienced a CAGR of xx% during the historical period (2019-2024) and is projected to grow at a CAGR of xx% during the forecast period (2025-2033).
Leading Regions, Countries, or Segments in MEA Payment Gateway Market
This section pinpoints the dominant regions, countries, and segments within the MEA payment gateway market. A detailed analysis identifies the factors driving their market leadership, including:
Key Drivers:
- High Investment Trends: Significant investments in fintech startups and digital infrastructure are fueling market growth in leading regions.
- Supportive Regulatory Frameworks: Governments in certain regions are actively promoting digital payment adoption through favorable regulations.
- Rapid Smartphone Penetration: High smartphone adoption rates are contributing to the increased use of mobile payment solutions.
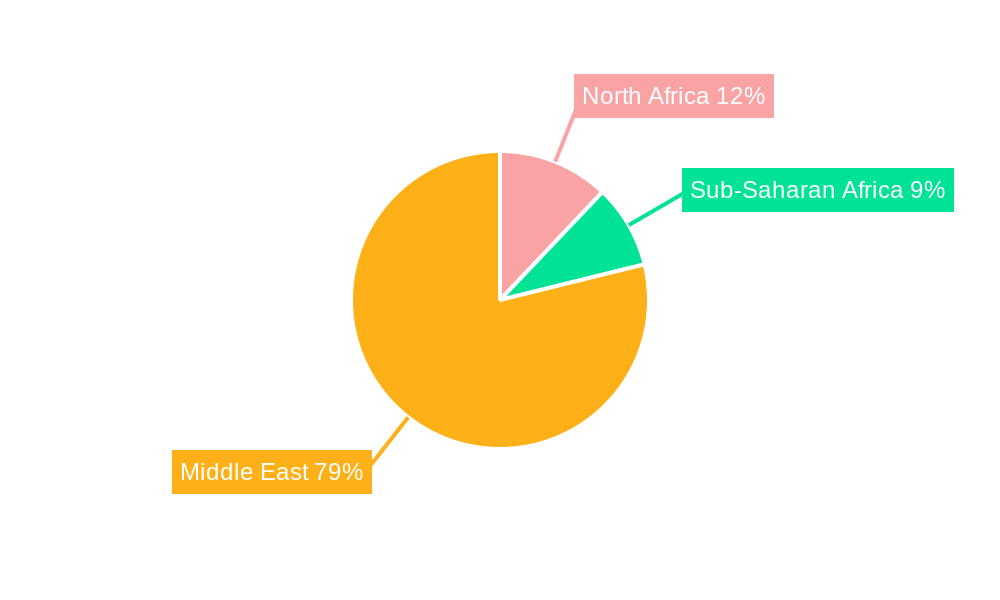
Dominance Factors: The UAE and Saudi Arabia are leading the market due to their advanced digital infrastructure, supportive regulatory environments, and high rates of e-commerce adoption. The detailed analysis provides further context on factors such as consumer behavior, regulatory developments, and technological advancements.
MEA Payment Gateway Market Product Innovations
The MEA payment gateway market is witnessing continuous product innovations, with providers focusing on enhancing security, improving user experience, and expanding payment options. Key advancements include the integration of biometric authentication, the adoption of artificial intelligence (AI) for fraud detection, and the expansion of support for local payment methods. These innovations aim to cater to the evolving needs of both merchants and consumers, offering unique selling propositions that differentiate providers in a competitive market.
Propelling Factors for MEA Payment Gateway Market Growth
Several factors are driving the growth of the MEA payment gateway market. Technological advancements, such as the proliferation of smartphones and the rise of e-commerce, are creating a favorable environment for the adoption of digital payment solutions. Economic factors, such as increasing disposable incomes and a growing middle class, are also contributing to market expansion. Furthermore, supportive government regulations promoting financial inclusion and digital payments are accelerating market growth. The growing adoption of online shopping across the MEA region is a key contributor to this positive trend.
Obstacles in the MEA Payment Gateway Market
Despite significant growth potential, the MEA payment gateway market faces several challenges. Regulatory hurdles, such as differing regulations across different countries in the region, can create complexities for businesses. Supply chain disruptions and increased competition from both local and international players are also affecting market dynamics. The high cost of implementing and maintaining secure payment systems can also be a barrier to entry for smaller players. These factors influence market growth, though projected growth remains positive.
Future Opportunities in MEA Payment Gateway Market
The MEA payment gateway market presents numerous opportunities for growth. The expansion of e-commerce and the increasing adoption of mobile payment solutions in underserved markets are creating new avenues for market penetration. The emergence of innovative technologies, such as blockchain and AI, presents opportunities to improve security and enhance customer experience. Focusing on providing customized solutions tailored to specific regional needs and preferences will also unlock significant opportunities.
Major Players in the MEA Payment Gateway Market Ecosystem
- PayTabs LLC
- Amazon Payments Inc
- PayPal Holdings Inc
- HyperPay
- CashU
Key Developments in MEA Payment Gateway Market Industry
- June 2024: CellPoint Digital partners with Riyadh Air, integrating its payment orchestration platform to streamline transactions. This highlights the increasing adoption of advanced payment technologies by major players in the MEA region.
- September 2024: Barq utilizes Mastercard's Gateway technology to enhance payment acceptance solutions, demonstrating the growing demand for cross-border payment services.
Strategic MEA Payment Gateway Market Forecast
The MEA payment gateway market is poised for continued growth, driven by increasing e-commerce adoption, rising smartphone penetration, and supportive government policies. The market is expected to witness significant expansion in the coming years, presenting lucrative opportunities for both established players and new entrants. Technological innovations and expanding financial inclusion will further fuel this growth, leading to a more inclusive and dynamic payment ecosystem.
MEA Payment Gateway Market Segmentation
-
1. Type
- 1.1. Hosted
- 1.2. Non-Hosted
-
2. Enterprise
- 2.1. Small and Medium Enterprise (SME)
- 2.2. Large Enterprise
-
3. End User
- 3.1. Travel
- 3.2. Retail
- 3.3. BFSI
- 3.4. Media and Entertainment
- 3.5. Other End Users
-
4. Geography
- 4.1. Saudi Arabia
- 4.2. Israel
- 4.3. Qatar
- 4.4. United Arab Emirates
- 4.5. Rest of MEA
MEA Payment Gateway Market Segmentation By Geography
- 1. Saudi Arabia
- 2. Israel
- 3. Qatar
- 4. United Arab Emirates
- 5. Rest of MEA
MEA Payment Gateway Market REPORT HIGHLIGHTS
| Aspects | Details |
|---|---|
| Study Period | 2019-2033 |
| Base Year | 2024 |
| Estimated Year | 2025 |
| Forecast Period | 2025-2033 |
| Historical Period | 2019-2024 |
| Growth Rate | CAGR of 23.65% from 2019-2033 |
| Segmentation |
|
Table of Contents
- 1. Introduction
- 1.1. Research Scope
- 1.2. Market Segmentation
- 1.3. Research Methodology
- 1.4. Definitions and Assumptions
- 2. Executive Summary
- 2.1. Introduction
- 3. Market Dynamics
- 3.1. Introduction
- 3.2. Market Drivers
- 3.2.1. Increased E-commerce Sales and High Internet Penetration Rate; Increased Demand for Mobile-based Payments; Growing Adoption of Payment Gateways in Retail
- 3.3. Market Restrains
- 3.3.1. Increased E-commerce Sales and High Internet Penetration Rate; Increased Demand for Mobile-based Payments; Growing Adoption of Payment Gateways in Retail
- 3.4. Market Trends
- 3.4.1. Increased E-commerce Sales and High Internet Penetration Rate
- 4. Market Factor Analysis
- 4.1. Porters Five Forces
- 4.2. Supply/Value Chain
- 4.3. PESTEL analysis
- 4.4. Market Entropy
- 4.5. Patent/Trademark Analysis
- 5. Global MEA Payment Gateway Market Analysis, Insights and Forecast, 2019-2031
- 5.1. Market Analysis, Insights and Forecast - by Type
- 5.1.1. Hosted
- 5.1.2. Non-Hosted
- 5.2. Market Analysis, Insights and Forecast - by Enterprise
- 5.2.1. Small and Medium Enterprise (SME)
- 5.2.2. Large Enterprise
- 5.3. Market Analysis, Insights and Forecast - by End User
- 5.3.1. Travel
- 5.3.2. Retail
- 5.3.3. BFSI
- 5.3.4. Media and Entertainment
- 5.3.5. Other End Users
- 5.4. Market Analysis, Insights and Forecast - by Geography
- 5.4.1. Saudi Arabia
- 5.4.2. Israel
- 5.4.3. Qatar
- 5.4.4. United Arab Emirates
- 5.4.5. Rest of MEA
- 5.5. Market Analysis, Insights and Forecast - by Region
- 5.5.1. Saudi Arabia
- 5.5.2. Israel
- 5.5.3. Qatar
- 5.5.4. United Arab Emirates
- 5.5.5. Rest of MEA
- 5.1. Market Analysis, Insights and Forecast - by Type
- 6. Saudi Arabia MEA Payment Gateway Market Analysis, Insights and Forecast, 2019-2031
- 6.1. Market Analysis, Insights and Forecast - by Type
- 6.1.1. Hosted
- 6.1.2. Non-Hosted
- 6.2. Market Analysis, Insights and Forecast - by Enterprise
- 6.2.1. Small and Medium Enterprise (SME)
- 6.2.2. Large Enterprise
- 6.3. Market Analysis, Insights and Forecast - by End User
- 6.3.1. Travel
- 6.3.2. Retail
- 6.3.3. BFSI
- 6.3.4. Media and Entertainment
- 6.3.5. Other End Users
- 6.4. Market Analysis, Insights and Forecast - by Geography
- 6.4.1. Saudi Arabia
- 6.4.2. Israel
- 6.4.3. Qatar
- 6.4.4. United Arab Emirates
- 6.4.5. Rest of MEA
- 6.1. Market Analysis, Insights and Forecast - by Type
- 7. Israel MEA Payment Gateway Market Analysis, Insights and Forecast, 2019-2031
- 7.1. Market Analysis, Insights and Forecast - by Type
- 7.1.1. Hosted
- 7.1.2. Non-Hosted
- 7.2. Market Analysis, Insights and Forecast - by Enterprise
- 7.2.1. Small and Medium Enterprise (SME)
- 7.2.2. Large Enterprise
- 7.3. Market Analysis, Insights and Forecast - by End User
- 7.3.1. Travel
- 7.3.2. Retail
- 7.3.3. BFSI
- 7.3.4. Media and Entertainment
- 7.3.5. Other End Users
- 7.4. Market Analysis, Insights and Forecast - by Geography
- 7.4.1. Saudi Arabia
- 7.4.2. Israel
- 7.4.3. Qatar
- 7.4.4. United Arab Emirates
- 7.4.5. Rest of MEA
- 7.1. Market Analysis, Insights and Forecast - by Type
- 8. Qatar MEA Payment Gateway Market Analysis, Insights and Forecast, 2019-2031
- 8.1. Market Analysis, Insights and Forecast - by Type
- 8.1.1. Hosted
- 8.1.2. Non-Hosted
- 8.2. Market Analysis, Insights and Forecast - by Enterprise
- 8.2.1. Small and Medium Enterprise (SME)
- 8.2.2. Large Enterprise
- 8.3. Market Analysis, Insights and Forecast - by End User
- 8.3.1. Travel
- 8.3.2. Retail
- 8.3.3. BFSI
- 8.3.4. Media and Entertainment
- 8.3.5. Other End Users
- 8.4. Market Analysis, Insights and Forecast - by Geography
- 8.4.1. Saudi Arabia
- 8.4.2. Israel
- 8.4.3. Qatar
- 8.4.4. United Arab Emirates
- 8.4.5. Rest of MEA
- 8.1. Market Analysis, Insights and Forecast - by Type
- 9. United Arab Emirates MEA Payment Gateway Market Analysis, Insights and Forecast, 2019-2031
- 9.1. Market Analysis, Insights and Forecast - by Type
- 9.1.1. Hosted
- 9.1.2. Non-Hosted
- 9.2. Market Analysis, Insights and Forecast - by Enterprise
- 9.2.1. Small and Medium Enterprise (SME)
- 9.2.2. Large Enterprise
- 9.3. Market Analysis, Insights and Forecast - by End User
- 9.3.1. Travel
- 9.3.2. Retail
- 9.3.3. BFSI
- 9.3.4. Media and Entertainment
- 9.3.5. Other End Users
- 9.4. Market Analysis, Insights and Forecast - by Geography
- 9.4.1. Saudi Arabia
- 9.4.2. Israel
- 9.4.3. Qatar
- 9.4.4. United Arab Emirates
- 9.4.5. Rest of MEA
- 9.1. Market Analysis, Insights and Forecast - by Type
- 10. Rest of MEA MEA Payment Gateway Market Analysis, Insights and Forecast, 2019-2031
- 10.1. Market Analysis, Insights and Forecast - by Type
- 10.1.1. Hosted
- 10.1.2. Non-Hosted
- 10.2. Market Analysis, Insights and Forecast - by Enterprise
- 10.2.1. Small and Medium Enterprise (SME)
- 10.2.2. Large Enterprise
- 10.3. Market Analysis, Insights and Forecast - by End User
- 10.3.1. Travel
- 10.3.2. Retail
- 10.3.3. BFSI
- 10.3.4. Media and Entertainment
- 10.3.5. Other End Users
- 10.4. Market Analysis, Insights and Forecast - by Geography
- 10.4.1. Saudi Arabia
- 10.4.2. Israel
- 10.4.3. Qatar
- 10.4.4. United Arab Emirates
- 10.4.5. Rest of MEA
- 10.1. Market Analysis, Insights and Forecast - by Type
- 11. Competitive Analysis
- 11.1. Global Market Share Analysis 2024
- 11.2. Company Profiles
- 11.2.1 PayTabs LLC
- 11.2.1.1. Overview
- 11.2.1.2. Products
- 11.2.1.3. SWOT Analysis
- 11.2.1.4. Recent Developments
- 11.2.1.5. Financials (Based on Availability)
- 11.2.2 Amazon Payments Inc
- 11.2.2.1. Overview
- 11.2.2.2. Products
- 11.2.2.3. SWOT Analysis
- 11.2.2.4. Recent Developments
- 11.2.2.5. Financials (Based on Availability)
- 11.2.3 PayPal Holdings Inc
- 11.2.3.1. Overview
- 11.2.3.2. Products
- 11.2.3.3. SWOT Analysis
- 11.2.3.4. Recent Developments
- 11.2.3.5. Financials (Based on Availability)
- 11.2.4 HyperPay
- 11.2.4.1. Overview
- 11.2.4.2. Products
- 11.2.4.3. SWOT Analysis
- 11.2.4.4. Recent Developments
- 11.2.4.5. Financials (Based on Availability)
- 11.2.5 CashU*List Not Exhaustive
- 11.2.5.1. Overview
- 11.2.5.2. Products
- 11.2.5.3. SWOT Analysis
- 11.2.5.4. Recent Developments
- 11.2.5.5. Financials (Based on Availability)
- 11.2.1 PayTabs LLC
List of Figures
- Figure 1: Global MEA Payment Gateway Market Revenue Breakdown (Million, %) by Region 2024 & 2032
- Figure 2: Global MEA Payment Gateway Market Volume Breakdown (Billion, %) by Region 2024 & 2032
- Figure 3: Saudi Arabia MEA Payment Gateway Market Revenue (Million), by Type 2024 & 2032
- Figure 4: Saudi Arabia MEA Payment Gateway Market Volume (Billion), by Type 2024 & 2032
- Figure 5: Saudi Arabia MEA Payment Gateway Market Revenue Share (%), by Type 2024 & 2032
- Figure 6: Saudi Arabia MEA Payment Gateway Market Volume Share (%), by Type 2024 & 2032
- Figure 7: Saudi Arabia MEA Payment Gateway Market Revenue (Million), by Enterprise 2024 & 2032
- Figure 8: Saudi Arabia MEA Payment Gateway Market Volume (Billion), by Enterprise 2024 & 2032
- Figure 9: Saudi Arabia MEA Payment Gateway Market Revenue Share (%), by Enterprise 2024 & 2032
- Figure 10: Saudi Arabia MEA Payment Gateway Market Volume Share (%), by Enterprise 2024 & 2032
- Figure 11: Saudi Arabia MEA Payment Gateway Market Revenue (Million), by End User 2024 & 2032
- Figure 12: Saudi Arabia MEA Payment Gateway Market Volume (Billion), by End User 2024 & 2032
- Figure 13: Saudi Arabia MEA Payment Gateway Market Revenue Share (%), by End User 2024 & 2032
- Figure 14: Saudi Arabia MEA Payment Gateway Market Volume Share (%), by End User 2024 & 2032
- Figure 15: Saudi Arabia MEA Payment Gateway Market Revenue (Million), by Geography 2024 & 2032
- Figure 16: Saudi Arabia MEA Payment Gateway Market Volume (Billion), by Geography 2024 & 2032
- Figure 17: Saudi Arabia MEA Payment Gateway Market Revenue Share (%), by Geography 2024 & 2032
- Figure 18: Saudi Arabia MEA Payment Gateway Market Volume Share (%), by Geography 2024 & 2032
- Figure 19: Saudi Arabia MEA Payment Gateway Market Revenue (Million), by Country 2024 & 2032
- Figure 20: Saudi Arabia MEA Payment Gateway Market Volume (Billion), by Country 2024 & 2032
- Figure 21: Saudi Arabia MEA Payment Gateway Market Revenue Share (%), by Country 2024 & 2032
- Figure 22: Saudi Arabia MEA Payment Gateway Market Volume Share (%), by Country 2024 & 2032
- Figure 23: Israel MEA Payment Gateway Market Revenue (Million), by Type 2024 & 2032
- Figure 24: Israel MEA Payment Gateway Market Volume (Billion), by Type 2024 & 2032
- Figure 25: Israel MEA Payment Gateway Market Revenue Share (%), by Type 2024 & 2032
- Figure 26: Israel MEA Payment Gateway Market Volume Share (%), by Type 2024 & 2032
- Figure 27: Israel MEA Payment Gateway Market Revenue (Million), by Enterprise 2024 & 2032
- Figure 28: Israel MEA Payment Gateway Market Volume (Billion), by Enterprise 2024 & 2032
- Figure 29: Israel MEA Payment Gateway Market Revenue Share (%), by Enterprise 2024 & 2032
- Figure 30: Israel MEA Payment Gateway Market Volume Share (%), by Enterprise 2024 & 2032
- Figure 31: Israel MEA Payment Gateway Market Revenue (Million), by End User 2024 & 2032
- Figure 32: Israel MEA Payment Gateway Market Volume (Billion), by End User 2024 & 2032
- Figure 33: Israel MEA Payment Gateway Market Revenue Share (%), by End User 2024 & 2032
- Figure 34: Israel MEA Payment Gateway Market Volume Share (%), by End User 2024 & 2032
- Figure 35: Israel MEA Payment Gateway Market Revenue (Million), by Geography 2024 & 2032
- Figure 36: Israel MEA Payment Gateway Market Volume (Billion), by Geography 2024 & 2032
- Figure 37: Israel MEA Payment Gateway Market Revenue Share (%), by Geography 2024 & 2032
- Figure 38: Israel MEA Payment Gateway Market Volume Share (%), by Geography 2024 & 2032
- Figure 39: Israel MEA Payment Gateway Market Revenue (Million), by Country 2024 & 2032
- Figure 40: Israel MEA Payment Gateway Market Volume (Billion), by Country 2024 & 2032
- Figure 41: Israel MEA Payment Gateway Market Revenue Share (%), by Country 2024 & 2032
- Figure 42: Israel MEA Payment Gateway Market Volume Share (%), by Country 2024 & 2032
- Figure 43: Qatar MEA Payment Gateway Market Revenue (Million), by Type 2024 & 2032
- Figure 44: Qatar MEA Payment Gateway Market Volume (Billion), by Type 2024 & 2032
- Figure 45: Qatar MEA Payment Gateway Market Revenue Share (%), by Type 2024 & 2032
- Figure 46: Qatar MEA Payment Gateway Market Volume Share (%), by Type 2024 & 2032
- Figure 47: Qatar MEA Payment Gateway Market Revenue (Million), by Enterprise 2024 & 2032
- Figure 48: Qatar MEA Payment Gateway Market Volume (Billion), by Enterprise 2024 & 2032
- Figure 49: Qatar MEA Payment Gateway Market Revenue Share (%), by Enterprise 2024 & 2032
- Figure 50: Qatar MEA Payment Gateway Market Volume Share (%), by Enterprise 2024 & 2032
- Figure 51: Qatar MEA Payment Gateway Market Revenue (Million), by End User 2024 & 2032
- Figure 52: Qatar MEA Payment Gateway Market Volume (Billion), by End User 2024 & 2032
- Figure 53: Qatar MEA Payment Gateway Market Revenue Share (%), by End User 2024 & 2032
- Figure 54: Qatar MEA Payment Gateway Market Volume Share (%), by End User 2024 & 2032
- Figure 55: Qatar MEA Payment Gateway Market Revenue (Million), by Geography 2024 & 2032
- Figure 56: Qatar MEA Payment Gateway Market Volume (Billion), by Geography 2024 & 2032
- Figure 57: Qatar MEA Payment Gateway Market Revenue Share (%), by Geography 2024 & 2032
- Figure 58: Qatar MEA Payment Gateway Market Volume Share (%), by Geography 2024 & 2032
- Figure 59: Qatar MEA Payment Gateway Market Revenue (Million), by Country 2024 & 2032
- Figure 60: Qatar MEA Payment Gateway Market Volume (Billion), by Country 2024 & 2032
- Figure 61: Qatar MEA Payment Gateway Market Revenue Share (%), by Country 2024 & 2032
- Figure 62: Qatar MEA Payment Gateway Market Volume Share (%), by Country 2024 & 2032
- Figure 63: United Arab Emirates MEA Payment Gateway Market Revenue (Million), by Type 2024 & 2032
- Figure 64: United Arab Emirates MEA Payment Gateway Market Volume (Billion), by Type 2024 & 2032
- Figure 65: United Arab Emirates MEA Payment Gateway Market Revenue Share (%), by Type 2024 & 2032
- Figure 66: United Arab Emirates MEA Payment Gateway Market Volume Share (%), by Type 2024 & 2032
- Figure 67: United Arab Emirates MEA Payment Gateway Market Revenue (Million), by Enterprise 2024 & 2032
- Figure 68: United Arab Emirates MEA Payment Gateway Market Volume (Billion), by Enterprise 2024 & 2032
- Figure 69: United Arab Emirates MEA Payment Gateway Market Revenue Share (%), by Enterprise 2024 & 2032
- Figure 70: United Arab Emirates MEA Payment Gateway Market Volume Share (%), by Enterprise 2024 & 2032
- Figure 71: United Arab Emirates MEA Payment Gateway Market Revenue (Million), by End User 2024 & 2032
- Figure 72: United Arab Emirates MEA Payment Gateway Market Volume (Billion), by End User 2024 & 2032
- Figure 73: United Arab Emirates MEA Payment Gateway Market Revenue Share (%), by End User 2024 & 2032
- Figure 74: United Arab Emirates MEA Payment Gateway Market Volume Share (%), by End User 2024 & 2032
- Figure 75: United Arab Emirates MEA Payment Gateway Market Revenue (Million), by Geography 2024 & 2032
- Figure 76: United Arab Emirates MEA Payment Gateway Market Volume (Billion), by Geography 2024 & 2032
- Figure 77: United Arab Emirates MEA Payment Gateway Market Revenue Share (%), by Geography 2024 & 2032
- Figure 78: United Arab Emirates MEA Payment Gateway Market Volume Share (%), by Geography 2024 & 2032
- Figure 79: United Arab Emirates MEA Payment Gateway Market Revenue (Million), by Country 2024 & 2032
- Figure 80: United Arab Emirates MEA Payment Gateway Market Volume (Billion), by Country 2024 & 2032
- Figure 81: United Arab Emirates MEA Payment Gateway Market Revenue Share (%), by Country 2024 & 2032
- Figure 82: United Arab Emirates MEA Payment Gateway Market Volume Share (%), by Country 2024 & 2032
- Figure 83: Rest of MEA MEA Payment Gateway Market Revenue (Million), by Type 2024 & 2032
- Figure 84: Rest of MEA MEA Payment Gateway Market Volume (Billion), by Type 2024 & 2032
- Figure 85: Rest of MEA MEA Payment Gateway Market Revenue Share (%), by Type 2024 & 2032
- Figure 86: Rest of MEA MEA Payment Gateway Market Volume Share (%), by Type 2024 & 2032
- Figure 87: Rest of MEA MEA Payment Gateway Market Revenue (Million), by Enterprise 2024 & 2032
- Figure 88: Rest of MEA MEA Payment Gateway Market Volume (Billion), by Enterprise 2024 & 2032
- Figure 89: Rest of MEA MEA Payment Gateway Market Revenue Share (%), by Enterprise 2024 & 2032
- Figure 90: Rest of MEA MEA Payment Gateway Market Volume Share (%), by Enterprise 2024 & 2032
- Figure 91: Rest of MEA MEA Payment Gateway Market Revenue (Million), by End User 2024 & 2032
- Figure 92: Rest of MEA MEA Payment Gateway Market Volume (Billion), by End User 2024 & 2032
- Figure 93: Rest of MEA MEA Payment Gateway Market Revenue Share (%), by End User 2024 & 2032
- Figure 94: Rest of MEA MEA Payment Gateway Market Volume Share (%), by End User 2024 & 2032
- Figure 95: Rest of MEA MEA Payment Gateway Market Revenue (Million), by Geography 2024 & 2032
- Figure 96: Rest of MEA MEA Payment Gateway Market Volume (Billion), by Geography 2024 & 2032
- Figure 97: Rest of MEA MEA Payment Gateway Market Revenue Share (%), by Geography 2024 & 2032
- Figure 98: Rest of MEA MEA Payment Gateway Market Volume Share (%), by Geography 2024 & 2032
- Figure 99: Rest of MEA MEA Payment Gateway Market Revenue (Million), by Country 2024 & 2032
- Figure 100: Rest of MEA MEA Payment Gateway Market Volume (Billion), by Country 2024 & 2032
- Figure 101: Rest of MEA MEA Payment Gateway Market Revenue Share (%), by Country 2024 & 2032
- Figure 102: Rest of MEA MEA Payment Gateway Market Volume Share (%), by Country 2024 & 2032
List of Tables
- Table 1: Global MEA Payment Gateway Market Revenue Million Forecast, by Region 2019 & 2032
- Table 2: Global MEA Payment Gateway Market Volume Billion Forecast, by Region 2019 & 2032
- Table 3: Global MEA Payment Gateway Market Revenue Million Forecast, by Type 2019 & 2032
- Table 4: Global MEA Payment Gateway Market Volume Billion Forecast, by Type 2019 & 2032
- Table 5: Global MEA Payment Gateway Market Revenue Million Forecast, by Enterprise 2019 & 2032
- Table 6: Global MEA Payment Gateway Market Volume Billion Forecast, by Enterprise 2019 & 2032
- Table 7: Global MEA Payment Gateway Market Revenue Million Forecast, by End User 2019 & 2032
- Table 8: Global MEA Payment Gateway Market Volume Billion Forecast, by End User 2019 & 2032
- Table 9: Global MEA Payment Gateway Market Revenue Million Forecast, by Geography 2019 & 2032
- Table 10: Global MEA Payment Gateway Market Volume Billion Forecast, by Geography 2019 & 2032
- Table 11: Global MEA Payment Gateway Market Revenue Million Forecast, by Region 2019 & 2032
- Table 12: Global MEA Payment Gateway Market Volume Billion Forecast, by Region 2019 & 2032
- Table 13: Global MEA Payment Gateway Market Revenue Million Forecast, by Type 2019 & 2032
- Table 14: Global MEA Payment Gateway Market Volume Billion Forecast, by Type 2019 & 2032
- Table 15: Global MEA Payment Gateway Market Revenue Million Forecast, by Enterprise 2019 & 2032
- Table 16: Global MEA Payment Gateway Market Volume Billion Forecast, by Enterprise 2019 & 2032
- Table 17: Global MEA Payment Gateway Market Revenue Million Forecast, by End User 2019 & 2032
- Table 18: Global MEA Payment Gateway Market Volume Billion Forecast, by End User 2019 & 2032
- Table 19: Global MEA Payment Gateway Market Revenue Million Forecast, by Geography 2019 & 2032
- Table 20: Global MEA Payment Gateway Market Volume Billion Forecast, by Geography 2019 & 2032
- Table 21: Global MEA Payment Gateway Market Revenue Million Forecast, by Country 2019 & 2032
- Table 22: Global MEA Payment Gateway Market Volume Billion Forecast, by Country 2019 & 2032
- Table 23: Global MEA Payment Gateway Market Revenue Million Forecast, by Type 2019 & 2032
- Table 24: Global MEA Payment Gateway Market Volume Billion Forecast, by Type 2019 & 2032
- Table 25: Global MEA Payment Gateway Market Revenue Million Forecast, by Enterprise 2019 & 2032
- Table 26: Global MEA Payment Gateway Market Volume Billion Forecast, by Enterprise 2019 & 2032
- Table 27: Global MEA Payment Gateway Market Revenue Million Forecast, by End User 2019 & 2032
- Table 28: Global MEA Payment Gateway Market Volume Billion Forecast, by End User 2019 & 2032
- Table 29: Global MEA Payment Gateway Market Revenue Million Forecast, by Geography 2019 & 2032
- Table 30: Global MEA Payment Gateway Market Volume Billion Forecast, by Geography 2019 & 2032
- Table 31: Global MEA Payment Gateway Market Revenue Million Forecast, by Country 2019 & 2032
- Table 32: Global MEA Payment Gateway Market Volume Billion Forecast, by Country 2019 & 2032
- Table 33: Global MEA Payment Gateway Market Revenue Million Forecast, by Type 2019 & 2032
- Table 34: Global MEA Payment Gateway Market Volume Billion Forecast, by Type 2019 & 2032
- Table 35: Global MEA Payment Gateway Market Revenue Million Forecast, by Enterprise 2019 & 2032
- Table 36: Global MEA Payment Gateway Market Volume Billion Forecast, by Enterprise 2019 & 2032
- Table 37: Global MEA Payment Gateway Market Revenue Million Forecast, by End User 2019 & 2032
- Table 38: Global MEA Payment Gateway Market Volume Billion Forecast, by End User 2019 & 2032
- Table 39: Global MEA Payment Gateway Market Revenue Million Forecast, by Geography 2019 & 2032
- Table 40: Global MEA Payment Gateway Market Volume Billion Forecast, by Geography 2019 & 2032
- Table 41: Global MEA Payment Gateway Market Revenue Million Forecast, by Country 2019 & 2032
- Table 42: Global MEA Payment Gateway Market Volume Billion Forecast, by Country 2019 & 2032
- Table 43: Global MEA Payment Gateway Market Revenue Million Forecast, by Type 2019 & 2032
- Table 44: Global MEA Payment Gateway Market Volume Billion Forecast, by Type 2019 & 2032
- Table 45: Global MEA Payment Gateway Market Revenue Million Forecast, by Enterprise 2019 & 2032
- Table 46: Global MEA Payment Gateway Market Volume Billion Forecast, by Enterprise 2019 & 2032
- Table 47: Global MEA Payment Gateway Market Revenue Million Forecast, by End User 2019 & 2032
- Table 48: Global MEA Payment Gateway Market Volume Billion Forecast, by End User 2019 & 2032
- Table 49: Global MEA Payment Gateway Market Revenue Million Forecast, by Geography 2019 & 2032
- Table 50: Global MEA Payment Gateway Market Volume Billion Forecast, by Geography 2019 & 2032
- Table 51: Global MEA Payment Gateway Market Revenue Million Forecast, by Country 2019 & 2032
- Table 52: Global MEA Payment Gateway Market Volume Billion Forecast, by Country 2019 & 2032
- Table 53: Global MEA Payment Gateway Market Revenue Million Forecast, by Type 2019 & 2032
- Table 54: Global MEA Payment Gateway Market Volume Billion Forecast, by Type 2019 & 2032
- Table 55: Global MEA Payment Gateway Market Revenue Million Forecast, by Enterprise 2019 & 2032
- Table 56: Global MEA Payment Gateway Market Volume Billion Forecast, by Enterprise 2019 & 2032
- Table 57: Global MEA Payment Gateway Market Revenue Million Forecast, by End User 2019 & 2032
- Table 58: Global MEA Payment Gateway Market Volume Billion Forecast, by End User 2019 & 2032
- Table 59: Global MEA Payment Gateway Market Revenue Million Forecast, by Geography 2019 & 2032
- Table 60: Global MEA Payment Gateway Market Volume Billion Forecast, by Geography 2019 & 2032
- Table 61: Global MEA Payment Gateway Market Revenue Million Forecast, by Country 2019 & 2032
- Table 62: Global MEA Payment Gateway Market Volume Billion Forecast, by Country 2019 & 2032
Frequently Asked Questions
1. What is the projected Compound Annual Growth Rate (CAGR) of the MEA Payment Gateway Market?
The projected CAGR is approximately 23.65%.
2. Which companies are prominent players in the MEA Payment Gateway Market?
Key companies in the market include PayTabs LLC, Amazon Payments Inc, PayPal Holdings Inc, HyperPay, CashU*List Not Exhaustive.
3. What are the main segments of the MEA Payment Gateway Market?
The market segments include Type, Enterprise, End User, Geography.
4. Can you provide details about the market size?
The market size is estimated to be USD 3.31 Million as of 2022.
5. What are some drivers contributing to market growth?
Increased E-commerce Sales and High Internet Penetration Rate; Increased Demand for Mobile-based Payments; Growing Adoption of Payment Gateways in Retail.
6. What are the notable trends driving market growth?
Increased E-commerce Sales and High Internet Penetration Rate.
7. Are there any restraints impacting market growth?
Increased E-commerce Sales and High Internet Penetration Rate; Increased Demand for Mobile-based Payments; Growing Adoption of Payment Gateways in Retail.
8. Can you provide examples of recent developments in the market?
September 2024: Barq, a Saudi financial services startup, is set to enhance its payment acceptance solutions for merchants and consumers by utilizing Mastercard's Gateway technology. Through this collaboration, Barq aims to provide expanded services to Saudi businesses, citizens, and residents, catering to their growing demand for cross-border services and remittance solutions.June 2024: CellPoint Digital, a global leader in payment orchestration and a provider of payment solutions to the airline industry, has forged a new partnership with Riyadh Air, the newest national airline in Saudi Arabia. This collaboration will empower Riyadh Air with cutting-edge payment technology, aligning with its digital-first business strategy and setting it apart as it gears up for commercial operations in 2025. Through this partnership, Riyadh Air gains access to CellPoint Digital’s Payment Orchestration platform, streamlining both local and cross-border transaction processing.
9. What pricing options are available for accessing the report?
Pricing options include single-user, multi-user, and enterprise licenses priced at USD 4750, USD 5250, and USD 8750 respectively.
10. Is the market size provided in terms of value or volume?
The market size is provided in terms of value, measured in Million and volume, measured in Billion.
11. Are there any specific market keywords associated with the report?
Yes, the market keyword associated with the report is "MEA Payment Gateway Market," which aids in identifying and referencing the specific market segment covered.
12. How do I determine which pricing option suits my needs best?
The pricing options vary based on user requirements and access needs. Individual users may opt for single-user licenses, while businesses requiring broader access may choose multi-user or enterprise licenses for cost-effective access to the report.
13. Are there any additional resources or data provided in the MEA Payment Gateway Market report?
While the report offers comprehensive insights, it's advisable to review the specific contents or supplementary materials provided to ascertain if additional resources or data are available.
14. How can I stay updated on further developments or reports in the MEA Payment Gateway Market?
To stay informed about further developments, trends, and reports in the MEA Payment Gateway Market, consider subscribing to industry newsletters, following relevant companies and organizations, or regularly checking reputable industry news sources and publications.
Methodology
Step 1 - Identification of Relevant Samples Size from Population Database


Step 2 - Approaches for Defining Global Market Size (Value, Volume* & Price*)

Note*: In applicable scenarios
Step 3 - Data Sources
Primary Research
- Web Analytics
- Survey Reports
- Research Institute
- Latest Research Reports
- Opinion Leaders
Secondary Research
- Annual Reports
- White Paper
- Latest Press Release
- Industry Association
- Paid Database
- Investor Presentations

Step 4 - Data Triangulation
Involves using different sources of information in order to increase the validity of a study
These sources are likely to be stakeholders in a program - participants, other researchers, program staff, other community members, and so on.
Then we put all data in single framework & apply various statistical tools to find out the dynamic on the market.
During the analysis stage, feedback from the stakeholder groups would be compared to determine areas of agreement as well as areas of divergence
