

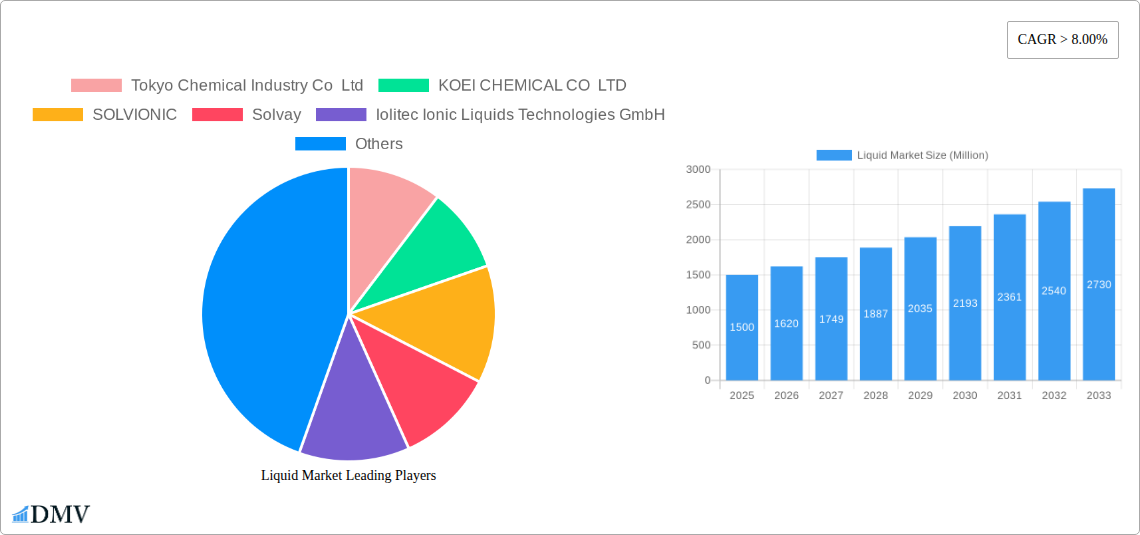
Key Insights
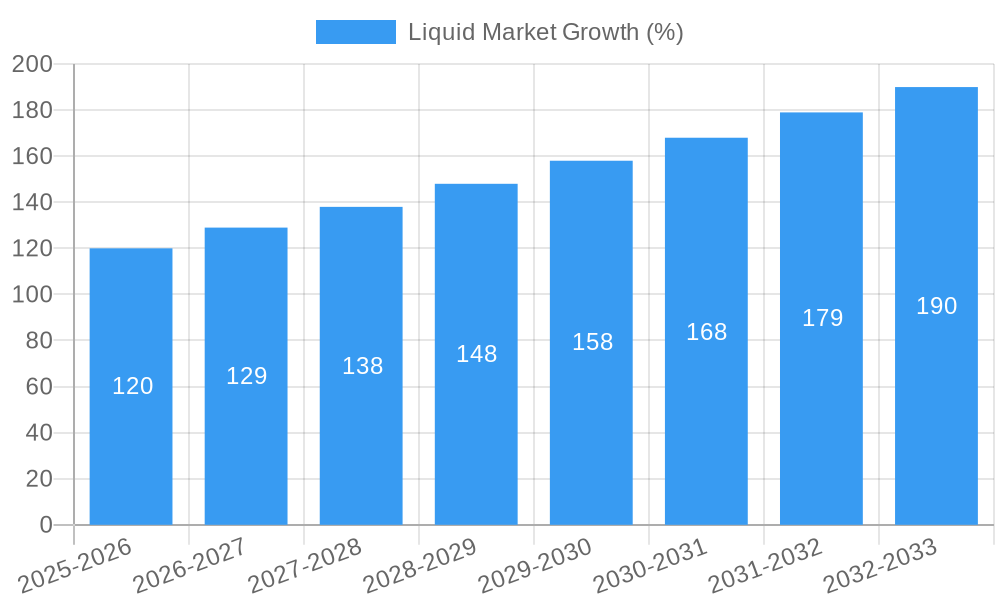
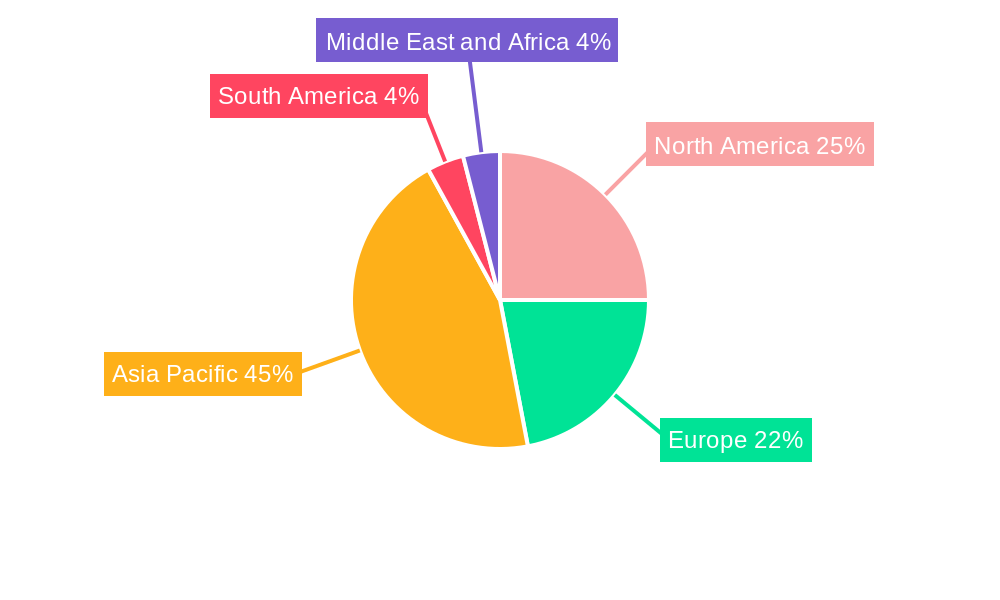
The global ionic liquids market is experiencing robust growth, projected to maintain a CAGR exceeding 8% from 2025 to 2033. This expansion is driven by increasing demand across diverse sectors, particularly in solvents & catalysts, process & operating fluids, and energy storage applications. The rising adoption of sustainable and green chemistry principles is a major catalyst, as ionic liquids offer superior performance compared to traditional solvents while minimizing environmental impact. Growth is further fueled by advancements in ionic liquid synthesis, leading to cost reductions and improved properties tailored to specific applications. Significant regional variations exist, with Asia Pacific, especially China and India, expected to dominate due to burgeoning industrial activity and growing investment in chemical manufacturing. North America and Europe will also contribute significantly, driven by strong research and development activities and the adoption of advanced technologies. However, challenges remain, including high production costs for some specialized ionic liquids and the need for comprehensive lifecycle assessments to fully understand their environmental impact. Nevertheless, the long-term outlook for the ionic liquids market remains highly positive, with ongoing innovations promising further market penetration and diversification.
The competitive landscape features a mix of established chemical giants like BASF SE and Solvay, alongside specialized ionic liquid manufacturers like Iolitec Ionic Liquids Technologies GmbH and TCI America. Strategic partnerships and collaborations between these players are expected to accelerate technological advancements and market penetration. The market segmentation by application highlights the diverse range of uses, from replacing conventional solvents in chemical processes to enabling novel applications in energy storage and bio-refineries. Ongoing research into new ionic liquids with enhanced properties will likely unlock further applications in fields such as pharmaceuticals, materials science, and advanced manufacturing, further contributing to robust market growth in the coming years. Specific regional growth will depend on government policies promoting sustainable chemistry, technological advancements within each region, and the overall economic climate. A detailed analysis of individual country markets is crucial to formulating effective market entry strategies.
Liquid Market: A Comprehensive Report (2019-2033)
This insightful report provides a detailed analysis of the global Liquid Market, projecting a market valuation exceeding $XX Million by 2033. The study covers the period from 2019 to 2033, with 2025 serving as the base and estimated year. We delve into market composition, industry evolution, leading segments, product innovations, growth drivers, challenges, and future opportunities, providing stakeholders with a comprehensive understanding of this dynamic market.
Liquid Market Market Composition & Trends
This section analyzes the competitive landscape of the Liquid Market, examining market concentration, innovation drivers, regulatory influences, substitute products, end-user profiles, and mergers & acquisitions (M&A) activities. The market is moderately concentrated, with key players like Tokyo Chemical Industry Co Ltd, KOEI CHEMICAL CO LTD, SOLVIONIC, Solvay, Iolitec Ionic Liquids Technologies GmbH, Ottokemi, BASF SE, Kumidas SA, TCI America, and Reinste holding significant market share.
- Market Share Distribution (2024): Tokyo Chemical Industry Co Ltd (15%), Solvay (12%), BASF SE (10%), Others (63%). These figures are estimates based on available data.
- Innovation Catalysts: Growing demand for sustainable solvents and catalysts, advancements in ionic liquid synthesis, and increasing R&D investments are driving innovation.
- Regulatory Landscape: Stringent environmental regulations regarding volatile organic compounds (VOCs) are shaping market trends.
- Substitute Products: Traditional solvents face competition from ionic liquids and other green alternatives.
- End-User Profiles: Key end-users include the chemical, pharmaceutical, energy, and manufacturing industries.
- M&A Activities: The past five years have witnessed approximately XX M&A deals valued at over $XX Million, primarily driven by consolidation and expansion strategies.
Liquid Market Industry Evolution
The Liquid Market has experienced significant growth from 2019 to 2024, with a Compound Annual Growth Rate (CAGR) of XX%. This growth is primarily attributed to increasing demand across diverse applications, coupled with technological advancements leading to improved performance and cost-effectiveness of ionic liquids. Technological advancements such as the development of task-specific ionic liquids and improved synthesis methods have contributed to this expansion. Further, shifting consumer preferences towards sustainable and eco-friendly alternatives have positively influenced market growth. The forecast period (2025-2033) anticipates a CAGR of XX%, driven by increasing adoption across sectors like energy storage and bio-refineries. This growth is expected to reach $XX Million by 2033. The adoption rate of ionic liquids as solvents and catalysts is projected to increase by XX% annually.
Leading Regions, Countries, or Segments in Liquid Market
The Solvents & Catalysts segment dominates the Liquid Market, accounting for approximately XX% of the total market value in 2024. This is followed by Process & Operating Fluids and Plastics segments.
- Key Drivers for Solvents & Catalysts Segment Dominance:
- High demand for environmentally friendly solvents in various industries.
- Growing adoption of ionic liquids as catalysts in chemical synthesis.
- Significant investments in research and development of novel ionic liquid-based catalysts.
- Favorable regulatory support for green chemistry initiatives.
The North American region currently holds the largest market share, driven by strong demand from the chemical and pharmaceutical industries, and substantial investments in research and development. Europe and Asia-Pacific are also significant markets exhibiting strong growth potential.
Liquid Market Product Innovations
Recent innovations in ionic liquid technology include the development of task-specific ionic liquids with tailored properties for specific applications, improving efficiency and reducing waste. Advances in synthesis methods have also lowered production costs, making ionic liquids more competitive. These innovations focus on enhancing performance metrics such as selectivity, stability, and recyclability, leading to significant improvements in various processes. Unique selling propositions include superior solvation properties, reduced toxicity, and recyclability.
Propelling Factors for Liquid Market Growth
Several factors contribute to the Liquid Market's growth. Firstly, the increasing demand for sustainable and environmentally benign alternatives to traditional solvents and catalysts is driving adoption. Secondly, technological advancements such as improved synthesis techniques and the development of task-specific ionic liquids are enhancing their performance and reducing production costs. Lastly, supportive government regulations and policies promoting green chemistry initiatives are creating a favorable environment for market expansion.
Obstacles in the Liquid Market Market
Despite the positive growth outlook, the Liquid Market faces challenges. High production costs compared to traditional solvents, potential toxicity of certain ionic liquids, and supply chain disruptions due to the specialized nature of their production can hinder market growth. Furthermore, competition from other sustainable solvents and the need for robust regulatory frameworks remain as obstacles. The estimated impact of these obstacles is a reduction in the projected growth rate by approximately XX%.
Future Opportunities in Liquid Market
Emerging opportunities lie in the expanding applications of ionic liquids in energy storage (e.g., batteries and fuel cells), bio-refineries (e.g., biomass processing), and advanced materials synthesis. Further, development of novel ionic liquids with enhanced properties and exploring new market segments present lucrative opportunities for market expansion. The focus on circular economy principles and sustainable manufacturing will further propel market growth in the coming years.
Major Players in the Liquid Market Ecosystem
- Tokyo Chemical Industry Co Ltd
- KOEI CHEMICAL CO LTD
- SOLVIONIC
- Solvay
- Iolitec Ionic Liquids Technologies GmbH
- Ottokemi
- BASF SE
- Kumidas SA
- TCI America
- Reinste
Key Developments in Liquid Market Industry
- 2022 Q4: Solvay launched a new range of sustainable ionic liquids for battery applications.
- 2023 Q1: BASF SE announced a significant investment in expanding its ionic liquid production capacity.
- 2023 Q3: A major merger between two smaller ionic liquid producers resulted in a more consolidated market. (Specific details unavailable, hence xx)
Strategic Liquid Market Market Forecast
The Liquid Market is poised for robust growth throughout the forecast period (2025-2033). The increasing demand for sustainable solutions, coupled with ongoing technological advancements and favorable regulatory support, will continue to fuel market expansion. New applications in emerging sectors, along with strategic partnerships and M&A activities, will significantly contribute to the market's overall growth, exceeding $XX Million by 2033.
Liquid Market Segmentation
-
1. Application
- 1.1. Solvents & Catalysts
- 1.2. Process & Operating Fluids
- 1.3. Plastics
- 1.4. Energy Storage
- 1.5. Bio-Refineries
- 1.6. Others
Liquid Market Segmentation By Geography
-
1. Asia Pacific
- 1.1. China
- 1.2. India
- 1.3. Japan
- 1.4. South Korea
- 1.5. Rest of Asia Pacific
-
2. North America
- 2.1. United States
- 2.2. Canada
- 2.3. Mexico
-
3. Europe
- 3.1. Germany
- 3.2. United Kingdom
- 3.3. France
- 3.4. Italy
- 3.5. Rest of Europe
-
4. South America
- 4.1. Brazil
- 4.2. Argentina
- 4.3. Rest of South America
-
5. Middle East and Africa
- 5.1. Saudi Arabia
- 5.2. South Africa
- 5.3. Rest of Middle East and Africa
Liquid Market REPORT HIGHLIGHTS
| Aspects | Details |
|---|---|
| Study Period | 2019-2033 |
| Base Year | 2024 |
| Estimated Year | 2025 |
| Forecast Period | 2025-2033 |
| Historical Period | 2019-2024 |
| Growth Rate | CAGR of > 8.00% from 2019-2033 |
| Segmentation |
|
Table of Contents
- 1. Introduction
- 1.1. Research Scope
- 1.2. Market Segmentation
- 1.3. Research Methodology
- 1.4. Definitions and Assumptions
- 2. Executive Summary
- 2.1. Introduction
- 3. Market Dynamics
- 3.1. Introduction
- 3.2. Market Drivers
- 3.2.1. ; Increasing Use of Ionic Liquid as Industrial Solvents; Growing Consumption of Batteries
- 3.3. Market Restrains
- 3.3.1. ; Aquatic Toxicity Related to Ionic Liquid; Unfavorable Conditions Arising Due to COVID-19 Outbreak
- 3.4. Market Trends
- 3.4.1. Solvents and Catalyst to Dominate the Market
- 4. Market Factor Analysis
- 4.1. Porters Five Forces
- 4.2. Supply/Value Chain
- 4.3. PESTEL analysis
- 4.4. Market Entropy
- 4.5. Patent/Trademark Analysis
- 5. Global Liquid Market Analysis, Insights and Forecast, 2019-2031
- 5.1. Market Analysis, Insights and Forecast - by Application
- 5.1.1. Solvents & Catalysts
- 5.1.2. Process & Operating Fluids
- 5.1.3. Plastics
- 5.1.4. Energy Storage
- 5.1.5. Bio-Refineries
- 5.1.6. Others
- 5.2. Market Analysis, Insights and Forecast - by Region
- 5.2.1. Asia Pacific
- 5.2.2. North America
- 5.2.3. Europe
- 5.2.4. South America
- 5.2.5. Middle East and Africa
- 5.1. Market Analysis, Insights and Forecast - by Application
- 6. Asia Pacific Liquid Market Analysis, Insights and Forecast, 2019-2031
- 6.1. Market Analysis, Insights and Forecast - by Application
- 6.1.1. Solvents & Catalysts
- 6.1.2. Process & Operating Fluids
- 6.1.3. Plastics
- 6.1.4. Energy Storage
- 6.1.5. Bio-Refineries
- 6.1.6. Others
- 6.1. Market Analysis, Insights and Forecast - by Application
- 7. North America Liquid Market Analysis, Insights and Forecast, 2019-2031
- 7.1. Market Analysis, Insights and Forecast - by Application
- 7.1.1. Solvents & Catalysts
- 7.1.2. Process & Operating Fluids
- 7.1.3. Plastics
- 7.1.4. Energy Storage
- 7.1.5. Bio-Refineries
- 7.1.6. Others
- 7.1. Market Analysis, Insights and Forecast - by Application
- 8. Europe Liquid Market Analysis, Insights and Forecast, 2019-2031
- 8.1. Market Analysis, Insights and Forecast - by Application
- 8.1.1. Solvents & Catalysts
- 8.1.2. Process & Operating Fluids
- 8.1.3. Plastics
- 8.1.4. Energy Storage
- 8.1.5. Bio-Refineries
- 8.1.6. Others
- 8.1. Market Analysis, Insights and Forecast - by Application
- 9. South America Liquid Market Analysis, Insights and Forecast, 2019-2031
- 9.1. Market Analysis, Insights and Forecast - by Application
- 9.1.1. Solvents & Catalysts
- 9.1.2. Process & Operating Fluids
- 9.1.3. Plastics
- 9.1.4. Energy Storage
- 9.1.5. Bio-Refineries
- 9.1.6. Others
- 9.1. Market Analysis, Insights and Forecast - by Application
- 10. Middle East and Africa Liquid Market Analysis, Insights and Forecast, 2019-2031
- 10.1. Market Analysis, Insights and Forecast - by Application
- 10.1.1. Solvents & Catalysts
- 10.1.2. Process & Operating Fluids
- 10.1.3. Plastics
- 10.1.4. Energy Storage
- 10.1.5. Bio-Refineries
- 10.1.6. Others
- 10.1. Market Analysis, Insights and Forecast - by Application
- 11. Asia Pacific Liquid Market Analysis, Insights and Forecast, 2019-2031
- 11.1. Market Analysis, Insights and Forecast - By Country/Sub-region
- 11.1.1 China
- 11.1.2 India
- 11.1.3 Japan
- 11.1.4 South Korea
- 11.1.5 Rest of Asia Pacific
- 12. North America Liquid Market Analysis, Insights and Forecast, 2019-2031
- 12.1. Market Analysis, Insights and Forecast - By Country/Sub-region
- 12.1.1 United States
- 12.1.2 Canada
- 12.1.3 Mexico
- 13. Europe Liquid Market Analysis, Insights and Forecast, 2019-2031
- 13.1. Market Analysis, Insights and Forecast - By Country/Sub-region
- 13.1.1 Germany
- 13.1.2 United Kingdom
- 13.1.3 France
- 13.1.4 Italy
- 13.1.5 Rest of Europe
- 14. South America Liquid Market Analysis, Insights and Forecast, 2019-2031
- 14.1. Market Analysis, Insights and Forecast - By Country/Sub-region
- 14.1.1 Brazil
- 14.1.2 Argentina
- 14.1.3 Rest of South America
- 15. Middle East and Africa Liquid Market Analysis, Insights and Forecast, 2019-2031
- 15.1. Market Analysis, Insights and Forecast - By Country/Sub-region
- 15.1.1 Saudi Arabia
- 15.1.2 South Africa
- 15.1.3 Rest of Middle East and Africa
- 16. Competitive Analysis
- 16.1. Global Market Share Analysis 2024
- 16.2. Company Profiles
- 16.2.1 Tokyo Chemical Industry Co Ltd
- 16.2.1.1. Overview
- 16.2.1.2. Products
- 16.2.1.3. SWOT Analysis
- 16.2.1.4. Recent Developments
- 16.2.1.5. Financials (Based on Availability)
- 16.2.2 KOEI CHEMICAL CO LTD
- 16.2.2.1. Overview
- 16.2.2.2. Products
- 16.2.2.3. SWOT Analysis
- 16.2.2.4. Recent Developments
- 16.2.2.5. Financials (Based on Availability)
- 16.2.3 SOLVIONIC
- 16.2.3.1. Overview
- 16.2.3.2. Products
- 16.2.3.3. SWOT Analysis
- 16.2.3.4. Recent Developments
- 16.2.3.5. Financials (Based on Availability)
- 16.2.4 Solvay
- 16.2.4.1. Overview
- 16.2.4.2. Products
- 16.2.4.3. SWOT Analysis
- 16.2.4.4. Recent Developments
- 16.2.4.5. Financials (Based on Availability)
- 16.2.5 Iolitec Ionic Liquids Technologies GmbH
- 16.2.5.1. Overview
- 16.2.5.2. Products
- 16.2.5.3. SWOT Analysis
- 16.2.5.4. Recent Developments
- 16.2.5.5. Financials (Based on Availability)
- 16.2.6 Ottokemi
- 16.2.6.1. Overview
- 16.2.6.2. Products
- 16.2.6.3. SWOT Analysis
- 16.2.6.4. Recent Developments
- 16.2.6.5. Financials (Based on Availability)
- 16.2.7 BASF SE
- 16.2.7.1. Overview
- 16.2.7.2. Products
- 16.2.7.3. SWOT Analysis
- 16.2.7.4. Recent Developments
- 16.2.7.5. Financials (Based on Availability)
- 16.2.8 Kumidas SA
- 16.2.8.1. Overview
- 16.2.8.2. Products
- 16.2.8.3. SWOT Analysis
- 16.2.8.4. Recent Developments
- 16.2.8.5. Financials (Based on Availability)
- 16.2.9 TCI America
- 16.2.9.1. Overview
- 16.2.9.2. Products
- 16.2.9.3. SWOT Analysis
- 16.2.9.4. Recent Developments
- 16.2.9.5. Financials (Based on Availability)
- 16.2.10 Reinste
- 16.2.10.1. Overview
- 16.2.10.2. Products
- 16.2.10.3. SWOT Analysis
- 16.2.10.4. Recent Developments
- 16.2.10.5. Financials (Based on Availability)
- 16.2.1 Tokyo Chemical Industry Co Ltd
List of Figures
- Figure 1: Global Liquid Market Revenue Breakdown (Million, %) by Region 2024 & 2032
- Figure 2: Global Liquid Market Volume Breakdown (Liter, %) by Region 2024 & 2032
- Figure 3: Asia Pacific Liquid Market Revenue (Million), by Country 2024 & 2032
- Figure 4: Asia Pacific Liquid Market Volume (Liter), by Country 2024 & 2032
- Figure 5: Asia Pacific Liquid Market Revenue Share (%), by Country 2024 & 2032
- Figure 6: Asia Pacific Liquid Market Volume Share (%), by Country 2024 & 2032
- Figure 7: North America Liquid Market Revenue (Million), by Country 2024 & 2032
- Figure 8: North America Liquid Market Volume (Liter), by Country 2024 & 2032
- Figure 9: North America Liquid Market Revenue Share (%), by Country 2024 & 2032
- Figure 10: North America Liquid Market Volume Share (%), by Country 2024 & 2032
- Figure 11: Europe Liquid Market Revenue (Million), by Country 2024 & 2032
- Figure 12: Europe Liquid Market Volume (Liter), by Country 2024 & 2032
- Figure 13: Europe Liquid Market Revenue Share (%), by Country 2024 & 2032
- Figure 14: Europe Liquid Market Volume Share (%), by Country 2024 & 2032
- Figure 15: South America Liquid Market Revenue (Million), by Country 2024 & 2032
- Figure 16: South America Liquid Market Volume (Liter), by Country 2024 & 2032
- Figure 17: South America Liquid Market Revenue Share (%), by Country 2024 & 2032
- Figure 18: South America Liquid Market Volume Share (%), by Country 2024 & 2032
- Figure 19: Middle East and Africa Liquid Market Revenue (Million), by Country 2024 & 2032
- Figure 20: Middle East and Africa Liquid Market Volume (Liter), by Country 2024 & 2032
- Figure 21: Middle East and Africa Liquid Market Revenue Share (%), by Country 2024 & 2032
- Figure 22: Middle East and Africa Liquid Market Volume Share (%), by Country 2024 & 2032
- Figure 23: Asia Pacific Liquid Market Revenue (Million), by Application 2024 & 2032
- Figure 24: Asia Pacific Liquid Market Volume (Liter), by Application 2024 & 2032
- Figure 25: Asia Pacific Liquid Market Revenue Share (%), by Application 2024 & 2032
- Figure 26: Asia Pacific Liquid Market Volume Share (%), by Application 2024 & 2032
- Figure 27: Asia Pacific Liquid Market Revenue (Million), by Country 2024 & 2032
- Figure 28: Asia Pacific Liquid Market Volume (Liter), by Country 2024 & 2032
- Figure 29: Asia Pacific Liquid Market Revenue Share (%), by Country 2024 & 2032
- Figure 30: Asia Pacific Liquid Market Volume Share (%), by Country 2024 & 2032
- Figure 31: North America Liquid Market Revenue (Million), by Application 2024 & 2032
- Figure 32: North America Liquid Market Volume (Liter), by Application 2024 & 2032
- Figure 33: North America Liquid Market Revenue Share (%), by Application 2024 & 2032
- Figure 34: North America Liquid Market Volume Share (%), by Application 2024 & 2032
- Figure 35: North America Liquid Market Revenue (Million), by Country 2024 & 2032
- Figure 36: North America Liquid Market Volume (Liter), by Country 2024 & 2032
- Figure 37: North America Liquid Market Revenue Share (%), by Country 2024 & 2032
- Figure 38: North America Liquid Market Volume Share (%), by Country 2024 & 2032
- Figure 39: Europe Liquid Market Revenue (Million), by Application 2024 & 2032
- Figure 40: Europe Liquid Market Volume (Liter), by Application 2024 & 2032
- Figure 41: Europe Liquid Market Revenue Share (%), by Application 2024 & 2032
- Figure 42: Europe Liquid Market Volume Share (%), by Application 2024 & 2032
- Figure 43: Europe Liquid Market Revenue (Million), by Country 2024 & 2032
- Figure 44: Europe Liquid Market Volume (Liter), by Country 2024 & 2032
- Figure 45: Europe Liquid Market Revenue Share (%), by Country 2024 & 2032
- Figure 46: Europe Liquid Market Volume Share (%), by Country 2024 & 2032
- Figure 47: South America Liquid Market Revenue (Million), by Application 2024 & 2032
- Figure 48: South America Liquid Market Volume (Liter), by Application 2024 & 2032
- Figure 49: South America Liquid Market Revenue Share (%), by Application 2024 & 2032
- Figure 50: South America Liquid Market Volume Share (%), by Application 2024 & 2032
- Figure 51: South America Liquid Market Revenue (Million), by Country 2024 & 2032
- Figure 52: South America Liquid Market Volume (Liter), by Country 2024 & 2032
- Figure 53: South America Liquid Market Revenue Share (%), by Country 2024 & 2032
- Figure 54: South America Liquid Market Volume Share (%), by Country 2024 & 2032
- Figure 55: Middle East and Africa Liquid Market Revenue (Million), by Application 2024 & 2032
- Figure 56: Middle East and Africa Liquid Market Volume (Liter), by Application 2024 & 2032
- Figure 57: Middle East and Africa Liquid Market Revenue Share (%), by Application 2024 & 2032
- Figure 58: Middle East and Africa Liquid Market Volume Share (%), by Application 2024 & 2032
- Figure 59: Middle East and Africa Liquid Market Revenue (Million), by Country 2024 & 2032
- Figure 60: Middle East and Africa Liquid Market Volume (Liter), by Country 2024 & 2032
- Figure 61: Middle East and Africa Liquid Market Revenue Share (%), by Country 2024 & 2032
- Figure 62: Middle East and Africa Liquid Market Volume Share (%), by Country 2024 & 2032
List of Tables
- Table 1: Global Liquid Market Revenue Million Forecast, by Region 2019 & 2032
- Table 2: Global Liquid Market Volume Liter Forecast, by Region 2019 & 2032
- Table 3: Global Liquid Market Revenue Million Forecast, by Application 2019 & 2032
- Table 4: Global Liquid Market Volume Liter Forecast, by Application 2019 & 2032
- Table 5: Global Liquid Market Revenue Million Forecast, by Region 2019 & 2032
- Table 6: Global Liquid Market Volume Liter Forecast, by Region 2019 & 2032
- Table 7: Global Liquid Market Revenue Million Forecast, by Country 2019 & 2032
- Table 8: Global Liquid Market Volume Liter Forecast, by Country 2019 & 2032
- Table 9: China Liquid Market Revenue (Million) Forecast, by Application 2019 & 2032
- Table 10: China Liquid Market Volume (Liter) Forecast, by Application 2019 & 2032
- Table 11: India Liquid Market Revenue (Million) Forecast, by Application 2019 & 2032
- Table 12: India Liquid Market Volume (Liter) Forecast, by Application 2019 & 2032
- Table 13: Japan Liquid Market Revenue (Million) Forecast, by Application 2019 & 2032
- Table 14: Japan Liquid Market Volume (Liter) Forecast, by Application 2019 & 2032
- Table 15: South Korea Liquid Market Revenue (Million) Forecast, by Application 2019 & 2032
- Table 16: South Korea Liquid Market Volume (Liter) Forecast, by Application 2019 & 2032
- Table 17: Rest of Asia Pacific Liquid Market Revenue (Million) Forecast, by Application 2019 & 2032
- Table 18: Rest of Asia Pacific Liquid Market Volume (Liter) Forecast, by Application 2019 & 2032
- Table 19: Global Liquid Market Revenue Million Forecast, by Country 2019 & 2032
- Table 20: Global Liquid Market Volume Liter Forecast, by Country 2019 & 2032
- Table 21: United States Liquid Market Revenue (Million) Forecast, by Application 2019 & 2032
- Table 22: United States Liquid Market Volume (Liter) Forecast, by Application 2019 & 2032
- Table 23: Canada Liquid Market Revenue (Million) Forecast, by Application 2019 & 2032
- Table 24: Canada Liquid Market Volume (Liter) Forecast, by Application 2019 & 2032
- Table 25: Mexico Liquid Market Revenue (Million) Forecast, by Application 2019 & 2032
- Table 26: Mexico Liquid Market Volume (Liter) Forecast, by Application 2019 & 2032
- Table 27: Global Liquid Market Revenue Million Forecast, by Country 2019 & 2032
- Table 28: Global Liquid Market Volume Liter Forecast, by Country 2019 & 2032
- Table 29: Germany Liquid Market Revenue (Million) Forecast, by Application 2019 & 2032
- Table 30: Germany Liquid Market Volume (Liter) Forecast, by Application 2019 & 2032
- Table 31: United Kingdom Liquid Market Revenue (Million) Forecast, by Application 2019 & 2032
- Table 32: United Kingdom Liquid Market Volume (Liter) Forecast, by Application 2019 & 2032
- Table 33: France Liquid Market Revenue (Million) Forecast, by Application 2019 & 2032
- Table 34: France Liquid Market Volume (Liter) Forecast, by Application 2019 & 2032
- Table 35: Italy Liquid Market Revenue (Million) Forecast, by Application 2019 & 2032
- Table 36: Italy Liquid Market Volume (Liter) Forecast, by Application 2019 & 2032
- Table 37: Rest of Europe Liquid Market Revenue (Million) Forecast, by Application 2019 & 2032
- Table 38: Rest of Europe Liquid Market Volume (Liter) Forecast, by Application 2019 & 2032
- Table 39: Global Liquid Market Revenue Million Forecast, by Country 2019 & 2032
- Table 40: Global Liquid Market Volume Liter Forecast, by Country 2019 & 2032
- Table 41: Brazil Liquid Market Revenue (Million) Forecast, by Application 2019 & 2032
- Table 42: Brazil Liquid Market Volume (Liter) Forecast, by Application 2019 & 2032
- Table 43: Argentina Liquid Market Revenue (Million) Forecast, by Application 2019 & 2032
- Table 44: Argentina Liquid Market Volume (Liter) Forecast, by Application 2019 & 2032
- Table 45: Rest of South America Liquid Market Revenue (Million) Forecast, by Application 2019 & 2032
- Table 46: Rest of South America Liquid Market Volume (Liter) Forecast, by Application 2019 & 2032
- Table 47: Global Liquid Market Revenue Million Forecast, by Country 2019 & 2032
- Table 48: Global Liquid Market Volume Liter Forecast, by Country 2019 & 2032
- Table 49: Saudi Arabia Liquid Market Revenue (Million) Forecast, by Application 2019 & 2032
- Table 50: Saudi Arabia Liquid Market Volume (Liter) Forecast, by Application 2019 & 2032
- Table 51: South Africa Liquid Market Revenue (Million) Forecast, by Application 2019 & 2032
- Table 52: South Africa Liquid Market Volume (Liter) Forecast, by Application 2019 & 2032
- Table 53: Rest of Middle East and Africa Liquid Market Revenue (Million) Forecast, by Application 2019 & 2032
- Table 54: Rest of Middle East and Africa Liquid Market Volume (Liter) Forecast, by Application 2019 & 2032
- Table 55: Global Liquid Market Revenue Million Forecast, by Application 2019 & 2032
- Table 56: Global Liquid Market Volume Liter Forecast, by Application 2019 & 2032
- Table 57: Global Liquid Market Revenue Million Forecast, by Country 2019 & 2032
- Table 58: Global Liquid Market Volume Liter Forecast, by Country 2019 & 2032
- Table 59: China Liquid Market Revenue (Million) Forecast, by Application 2019 & 2032
- Table 60: China Liquid Market Volume (Liter) Forecast, by Application 2019 & 2032
- Table 61: India Liquid Market Revenue (Million) Forecast, by Application 2019 & 2032
- Table 62: India Liquid Market Volume (Liter) Forecast, by Application 2019 & 2032
- Table 63: Japan Liquid Market Revenue (Million) Forecast, by Application 2019 & 2032
- Table 64: Japan Liquid Market Volume (Liter) Forecast, by Application 2019 & 2032
- Table 65: South Korea Liquid Market Revenue (Million) Forecast, by Application 2019 & 2032
- Table 66: South Korea Liquid Market Volume (Liter) Forecast, by Application 2019 & 2032
- Table 67: Rest of Asia Pacific Liquid Market Revenue (Million) Forecast, by Application 2019 & 2032
- Table 68: Rest of Asia Pacific Liquid Market Volume (Liter) Forecast, by Application 2019 & 2032
- Table 69: Global Liquid Market Revenue Million Forecast, by Application 2019 & 2032
- Table 70: Global Liquid Market Volume Liter Forecast, by Application 2019 & 2032
- Table 71: Global Liquid Market Revenue Million Forecast, by Country 2019 & 2032
- Table 72: Global Liquid Market Volume Liter Forecast, by Country 2019 & 2032
- Table 73: United States Liquid Market Revenue (Million) Forecast, by Application 2019 & 2032
- Table 74: United States Liquid Market Volume (Liter) Forecast, by Application 2019 & 2032
- Table 75: Canada Liquid Market Revenue (Million) Forecast, by Application 2019 & 2032
- Table 76: Canada Liquid Market Volume (Liter) Forecast, by Application 2019 & 2032
- Table 77: Mexico Liquid Market Revenue (Million) Forecast, by Application 2019 & 2032
- Table 78: Mexico Liquid Market Volume (Liter) Forecast, by Application 2019 & 2032
- Table 79: Global Liquid Market Revenue Million Forecast, by Application 2019 & 2032
- Table 80: Global Liquid Market Volume Liter Forecast, by Application 2019 & 2032
- Table 81: Global Liquid Market Revenue Million Forecast, by Country 2019 & 2032
- Table 82: Global Liquid Market Volume Liter Forecast, by Country 2019 & 2032
- Table 83: Germany Liquid Market Revenue (Million) Forecast, by Application 2019 & 2032
- Table 84: Germany Liquid Market Volume (Liter) Forecast, by Application 2019 & 2032
- Table 85: United Kingdom Liquid Market Revenue (Million) Forecast, by Application 2019 & 2032
- Table 86: United Kingdom Liquid Market Volume (Liter) Forecast, by Application 2019 & 2032
- Table 87: France Liquid Market Revenue (Million) Forecast, by Application 2019 & 2032
- Table 88: France Liquid Market Volume (Liter) Forecast, by Application 2019 & 2032
- Table 89: Italy Liquid Market Revenue (Million) Forecast, by Application 2019 & 2032
- Table 90: Italy Liquid Market Volume (Liter) Forecast, by Application 2019 & 2032
- Table 91: Rest of Europe Liquid Market Revenue (Million) Forecast, by Application 2019 & 2032
- Table 92: Rest of Europe Liquid Market Volume (Liter) Forecast, by Application 2019 & 2032
- Table 93: Global Liquid Market Revenue Million Forecast, by Application 2019 & 2032
- Table 94: Global Liquid Market Volume Liter Forecast, by Application 2019 & 2032
- Table 95: Global Liquid Market Revenue Million Forecast, by Country 2019 & 2032
- Table 96: Global Liquid Market Volume Liter Forecast, by Country 2019 & 2032
- Table 97: Brazil Liquid Market Revenue (Million) Forecast, by Application 2019 & 2032
- Table 98: Brazil Liquid Market Volume (Liter) Forecast, by Application 2019 & 2032
- Table 99: Argentina Liquid Market Revenue (Million) Forecast, by Application 2019 & 2032
- Table 100: Argentina Liquid Market Volume (Liter) Forecast, by Application 2019 & 2032
- Table 101: Rest of South America Liquid Market Revenue (Million) Forecast, by Application 2019 & 2032
- Table 102: Rest of South America Liquid Market Volume (Liter) Forecast, by Application 2019 & 2032
- Table 103: Global Liquid Market Revenue Million Forecast, by Application 2019 & 2032
- Table 104: Global Liquid Market Volume Liter Forecast, by Application 2019 & 2032
- Table 105: Global Liquid Market Revenue Million Forecast, by Country 2019 & 2032
- Table 106: Global Liquid Market Volume Liter Forecast, by Country 2019 & 2032
- Table 107: Saudi Arabia Liquid Market Revenue (Million) Forecast, by Application 2019 & 2032
- Table 108: Saudi Arabia Liquid Market Volume (Liter) Forecast, by Application 2019 & 2032
- Table 109: South Africa Liquid Market Revenue (Million) Forecast, by Application 2019 & 2032
- Table 110: South Africa Liquid Market Volume (Liter) Forecast, by Application 2019 & 2032
- Table 111: Rest of Middle East and Africa Liquid Market Revenue (Million) Forecast, by Application 2019 & 2032
- Table 112: Rest of Middle East and Africa Liquid Market Volume (Liter) Forecast, by Application 2019 & 2032
Frequently Asked Questions
1. What is the projected Compound Annual Growth Rate (CAGR) of the Liquid Market?
The projected CAGR is approximately > 8.00%.
2. Which companies are prominent players in the Liquid Market?
Key companies in the market include Tokyo Chemical Industry Co Ltd, KOEI CHEMICAL CO LTD, SOLVIONIC, Solvay, Iolitec Ionic Liquids Technologies GmbH, Ottokemi, BASF SE, Kumidas SA, TCI America, Reinste.
3. What are the main segments of the Liquid Market?
The market segments include Application.
4. Can you provide details about the market size?
The market size is estimated to be USD XX Million as of 2022.
5. What are some drivers contributing to market growth?
; Increasing Use of Ionic Liquid as Industrial Solvents; Growing Consumption of Batteries.
6. What are the notable trends driving market growth?
Solvents and Catalyst to Dominate the Market.
7. Are there any restraints impacting market growth?
; Aquatic Toxicity Related to Ionic Liquid; Unfavorable Conditions Arising Due to COVID-19 Outbreak.
8. Can you provide examples of recent developments in the market?
N/A
9. What pricing options are available for accessing the report?
Pricing options include single-user, multi-user, and enterprise licenses priced at USD 4750, USD 5250, and USD 8750 respectively.
10. Is the market size provided in terms of value or volume?
The market size is provided in terms of value, measured in Million and volume, measured in Liter.
11. Are there any specific market keywords associated with the report?
Yes, the market keyword associated with the report is "Liquid Market," which aids in identifying and referencing the specific market segment covered.
12. How do I determine which pricing option suits my needs best?
The pricing options vary based on user requirements and access needs. Individual users may opt for single-user licenses, while businesses requiring broader access may choose multi-user or enterprise licenses for cost-effective access to the report.
13. Are there any additional resources or data provided in the Liquid Market report?
While the report offers comprehensive insights, it's advisable to review the specific contents or supplementary materials provided to ascertain if additional resources or data are available.
14. How can I stay updated on further developments or reports in the Liquid Market?
To stay informed about further developments, trends, and reports in the Liquid Market, consider subscribing to industry newsletters, following relevant companies and organizations, or regularly checking reputable industry news sources and publications.
Methodology
Step 1 - Identification of Relevant Samples Size from Population Database


Step 2 - Approaches for Defining Global Market Size (Value, Volume* & Price*)

Note*: In applicable scenarios
Step 3 - Data Sources
Primary Research
- Web Analytics
- Survey Reports
- Research Institute
- Latest Research Reports
- Opinion Leaders
Secondary Research
- Annual Reports
- White Paper
- Latest Press Release
- Industry Association
- Paid Database
- Investor Presentations

Step 4 - Data Triangulation
Involves using different sources of information in order to increase the validity of a study
These sources are likely to be stakeholders in a program - participants, other researchers, program staff, other community members, and so on.
Then we put all data in single framework & apply various statistical tools to find out the dynamic on the market.
During the analysis stage, feedback from the stakeholder groups would be compared to determine areas of agreement as well as areas of divergence
