

Key Insights
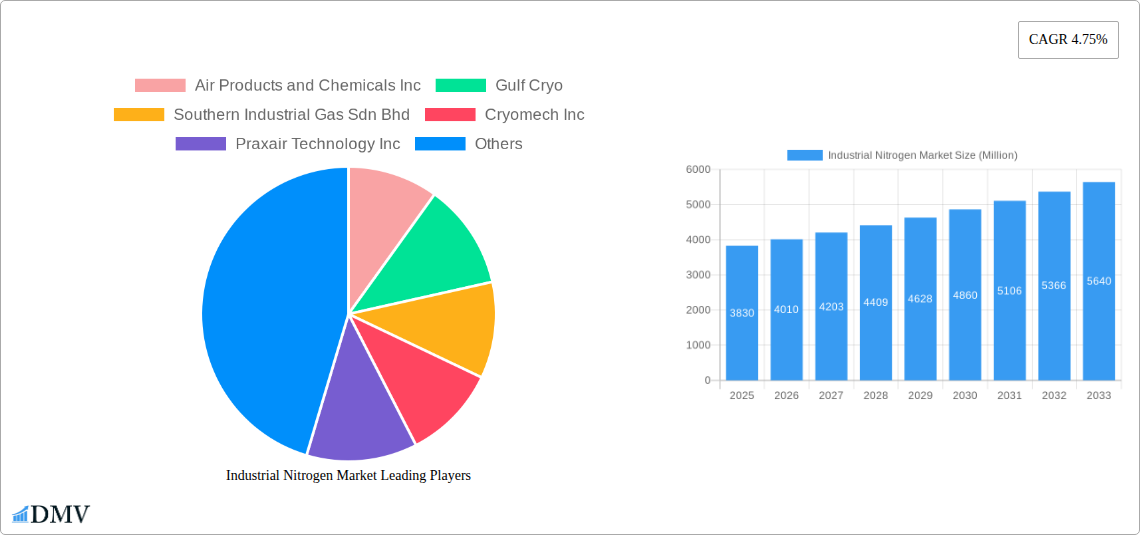
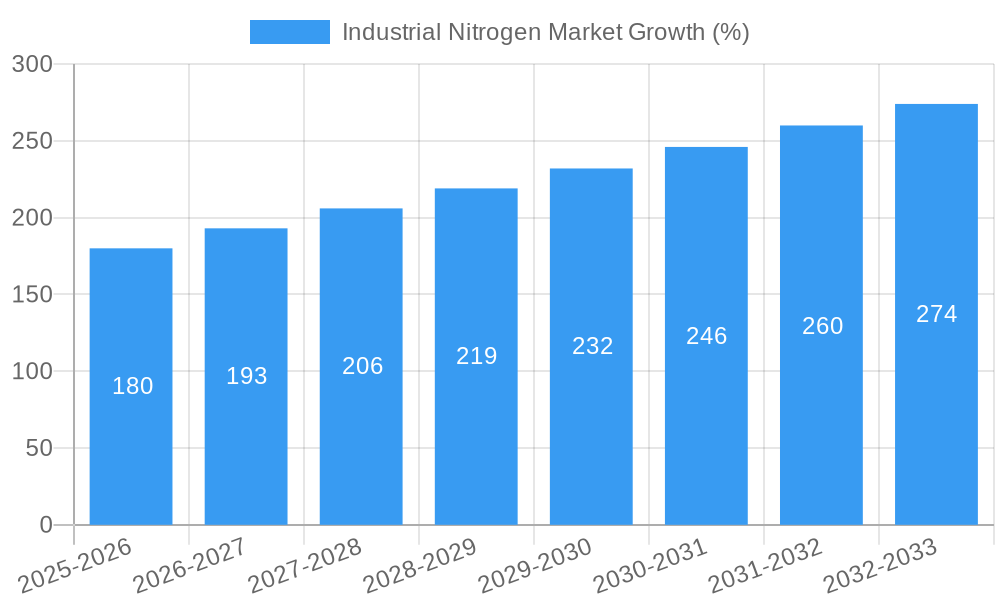
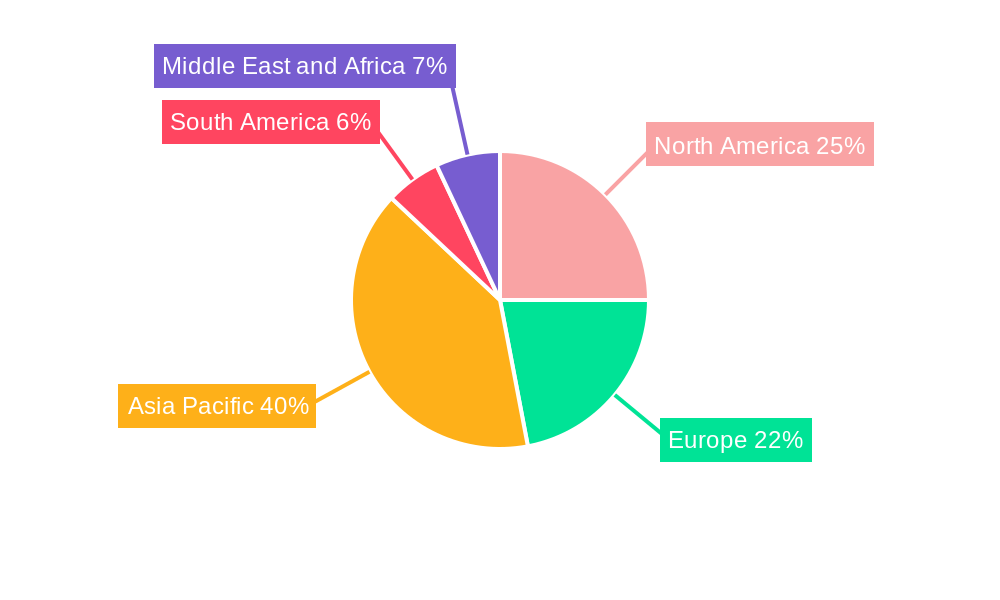
The industrial nitrogen market, valued at $3.83 billion in 2025, is projected to experience robust growth, driven by a compound annual growth rate (CAGR) of 4.75% from 2025 to 2033. This expansion is fueled by several key factors. The burgeoning chemical and pharmaceutical industries, heavily reliant on nitrogen for various processes, represent a significant growth driver. Increased demand for cryogenic coolants and refrigerants in the healthcare and transportation sectors also contributes significantly. Furthermore, advancements in nitrogen generation technologies, leading to improved efficiency and reduced costs, are bolstering market growth. The Asia-Pacific region, particularly China and India, is anticipated to lead the market expansion due to rapid industrialization and increasing investments in infrastructure projects. However, potential price volatility of raw materials and stringent environmental regulations could pose challenges to market growth. Competitive landscape analysis reveals key players such as Air Products and Chemicals, Linde plc, and Air Liquide are actively engaged in market expansion through strategic partnerships, acquisitions, and technological innovations. The market is segmented by storage type (cylinder, packaged gas), function (coolant, refrigerant), and end-user industry, offering opportunities for specialized product development and targeted marketing strategies. Growth in emerging economies and technological advancements will continue to shape the market landscape over the forecast period.
The market segmentation offers opportunities for specialized players to capitalize on niche demands. For example, the packaged gas segment is poised for significant growth due to its ease of handling and transportation, especially in remote locations. Similarly, the increasing adoption of environmentally friendly refrigerants in the transportation and healthcare sectors presents a substantial opportunity for businesses offering sustainable nitrogen solutions. The competitive landscape is characterized by both large multinational corporations and smaller, regional players, leading to both price competition and innovation-driven differentiation. Future growth will depend on the ongoing development of energy-efficient nitrogen generation technologies and the continuous expansion of key end-user industries, particularly in developing economies. Companies are increasingly focusing on providing customized solutions and value-added services to enhance customer satisfaction and maintain a competitive edge.
Industrial Nitrogen Market: A Comprehensive Report (2019-2033)
This insightful report provides a detailed analysis of the Industrial Nitrogen Market, offering a comprehensive overview of its current state, future trends, and key players. With a study period spanning 2019-2033, a base year of 2025, and a forecast period of 2025-2033, this report is an essential resource for stakeholders seeking to understand and capitalize on the opportunities within this dynamic market. The market size is projected to reach xx Million by 2033, exhibiting a robust Compound Annual Growth Rate (CAGR) of xx%.
Industrial Nitrogen Market Composition & Trends
The Industrial Nitrogen Market is characterized by a moderately concentrated landscape, with several major players holding significant market share. Air Products and Chemicals Inc, Linde plc, Air Liquide, and Messer Group are among the key players influencing market dynamics. Market share distribution fluctuates based on capacity expansion and M&A activities. Recent deals, though specific values remain confidential for many transactions (XX Million estimated total value in 2024), reflect consolidation trends. Innovation is driven primarily by enhanced efficiency in nitrogen production, improved storage and delivery solutions, and expansion into niche applications. Regulatory landscapes, varying by region, impact production standards and environmental compliance costs. Substitute products are limited, with most applications relying on the unique properties of industrial nitrogen. End-user profiles are diverse, encompassing chemical and pharmaceutical, healthcare, transportation, and other industries.
- Market Concentration: Moderately Concentrated
- Innovation Catalysts: Efficiency improvements, new delivery systems, niche applications.
- Regulatory Landscape: Regionally diverse, influencing production costs.
- Substitute Products: Limited viable alternatives.
- M&A Activity: Ongoing consolidation with estimated XX Million in deal values in 2024.
Industrial Nitrogen Market Industry Evolution
The Industrial Nitrogen Market has experienced consistent growth throughout the historical period (2019-2024), driven by increasing demand across various end-use sectors. The chemical and pharmaceutical industry, fueled by manufacturing needs, remains the largest consumer, exhibiting a CAGR of xx% during the historical period. Technological advancements in air separation units (ASUs) have increased production efficiency and reduced costs. Shifting consumer demands, primarily towards sustainable and cost-effective solutions, are influencing the market trajectory. Growth is expected to continue in the forecast period (2025-2033), with a projected CAGR of xx%, driven by expanding applications in emerging industries, particularly those with growing environmental sustainability concerns. The adoption of cryogenic technologies in new sectors is also increasing, boosting demand for more cost-efficient storage solutions.
Leading Regions, Countries, or Segments in Industrial Nitrogen Market
The North American region holds a dominant position in the Industrial Nitrogen Market, driven by a robust industrial base and significant investments in infrastructure. Within this region, the United States shows the highest consumption.
Key Drivers (North America):
- High industrial output and manufacturing activity.
- Significant investments in infrastructure and new ASUs.
- Strong regulatory support for technological upgrades within the production process.
Dominant Segments:
- Storage Type: Packaged gas solutions are experiencing higher growth due to ease of handling and transport, while cylinder storage remains the dominant sector.
- Function: Coolant applications in various industries continue to lead the market, with refrigerant uses in specialized sectors also showing significant growth.
- End-user Industry: The Chemical and Pharmaceutical sector consistently leads due to large-scale production needs and ongoing development in the field.
Analysis of Dominance: The dominance of North America stems from a mature industrial infrastructure, coupled with supportive government policies and robust investment in the development of new ASUs. The packaged gas segment is showing increasing popularity due to its efficient, cost-effective nature. The coolant function dominates due to its extensive use in manufacturing processes.
Industrial Nitrogen Market Product Innovations
Recent innovations focus on improving the efficiency of nitrogen production and delivery. Advanced ASU technologies offer increased energy efficiency and reduced operational costs. New packaging designs for both cylinder and packaged gas improve handling and safety. These innovations, alongside the development of specialized nitrogen blends for niche applications, offer unique selling propositions for market players and contribute significantly to market growth.
Propelling Factors for Industrial Nitrogen Market Growth
Several factors propel the growth of the Industrial Nitrogen Market. Technological advancements in ASU technology enhance production efficiency and reduce energy consumption. Strong economic growth in developing nations fuels industrial expansion, thereby increasing nitrogen demand. Favorable regulatory policies supporting industrial growth and environmental protection encourage investment and development within the sector. Finally, the expanding use of industrial nitrogen in emerging sectors such as renewable energy and advanced materials further fuels market expansion.
Obstacles in the Industrial Nitrogen Market
Challenges facing the market include regulatory hurdles related to emissions and safety, potential supply chain disruptions due to global events, and intensifying competition among major players. These factors could impact market growth, particularly in the short-term, though technological advancements and efficiency improvements are expected to minimize these negative impacts.
Future Opportunities in Industrial Nitrogen Market
Future opportunities lie in emerging markets in Asia and Africa, where industrialization is rapidly expanding, creating new demands. Technological innovations like on-site nitrogen generation for localized applications will further drive growth. The increasing focus on sustainability and environmental responsibility also presents opportunities for players focusing on energy-efficient production and delivery methods.
Major Players in the Industrial Nitrogen Market Ecosystem
- Air Products and Chemicals Inc (Air Products and Chemicals Inc)
- Gulf Cryo
- Southern Industrial Gas Sdn Bhd
- Cryomech Inc
- Praxair Technology Inc
- Linde plc (Linde plc)
- TAIYO NIPPON SANSO CORPORATION
- MVS Engineering Pvt Ltd
- Messer Group (Messer Group)
- Air Liquide (Air Liquide)
Key Developments in Industrial Nitrogen Market Industry
- April 2022: Linde plc secured a long-term agreement to supply a major space launch firm in Florida, expanding its liquid nitrogen production capacity by up to 50% to meet increasing demand from aerospace, healthcare, manufacturing, food processing, and water treatment sectors. This signifies significant growth in the aerospace sector's contribution to the industrial nitrogen market.
- February 2022: INOX Air Products commissioned its sixth air separation plant in Hosur, India, boosting high-purity liquid nitrogen production by 150 MT per day, responding to rising healthcare and industrial demand. This highlights the rapid growth in the Indian market and its impact on global capacity.
Strategic Industrial Nitrogen Market Forecast
The Industrial Nitrogen Market is poised for continued growth, driven by technological advancements, increasing industrial activity globally, and the expanding applications across diverse sectors. Emerging markets and sustainable production methods represent significant opportunities, shaping the future landscape of this crucial industrial gas market. The market is expected to witness substantial growth in the coming years, supported by continuous innovation, expanding applications, and favorable economic conditions.
Industrial Nitrogen Market Segmentation
-
1. Storage Type
- 1.1. Cylinder
- 1.2. Packaged Gas
-
2. Function
- 2.1. Coolant
- 2.2. Refrigerant
-
3. End-user Industry
- 3.1. Chemical and Pharmaceutical
- 3.2. Healthcare
- 3.3. Transportation
- 3.4. Other End-user Industries
Industrial Nitrogen Market Segmentation By Geography
-
1. Asia Pacific
- 1.1. China
- 1.2. India
- 1.3. Japan
- 1.4. South Korea
- 1.5. Rest of Asia Pacific
-
2. North America
- 2.1. United States
- 2.2. Canada
- 2.3. Mexico
-
3. Europe
- 3.1. Germany
- 3.2. United Kingdom
- 3.3. Italy
- 3.4. France
- 3.5. Rest of Europe
-
4. South America
- 4.1. Brazil
- 4.2. Argentina
- 4.3. Rest of South America
-
5. Middle East and Africa
- 5.1. Saudi Arabia
- 5.2. South Africa
- 5.3. Rest of Middle East and Africa
Industrial Nitrogen Market REPORT HIGHLIGHTS
| Aspects | Details |
|---|---|
| Study Period | 2019-2033 |
| Base Year | 2024 |
| Estimated Year | 2025 |
| Forecast Period | 2025-2033 |
| Historical Period | 2019-2024 |
| Growth Rate | CAGR of 4.75% from 2019-2033 |
| Segmentation |
|
Table of Contents
- 1. Introduction
- 1.1. Research Scope
- 1.2. Market Segmentation
- 1.3. Research Methodology
- 1.4. Definitions and Assumptions
- 2. Executive Summary
- 2.1. Introduction
- 3. Market Dynamics
- 3.1. Introduction
- 3.2. Market Drivers
- 3.2.1. Increasing Demand from the Chemical and Pharmaceutical Industry; Growing Application in the Healthcare Industry; Other Drivers
- 3.3. Market Restrains
- 3.3.1. Regulatory Restrictions in Maintaining Liquid Nitrogen Plant; Other Restraints
- 3.4. Market Trends
- 3.4.1. Growing Demand from the Chemical and Pharmaceutical Industry
- 4. Market Factor Analysis
- 4.1. Porters Five Forces
- 4.2. Supply/Value Chain
- 4.3. PESTEL analysis
- 4.4. Market Entropy
- 4.5. Patent/Trademark Analysis
- 5. Global Industrial Nitrogen Market Analysis, Insights and Forecast, 2019-2031
- 5.1. Market Analysis, Insights and Forecast - by Storage Type
- 5.1.1. Cylinder
- 5.1.2. Packaged Gas
- 5.2. Market Analysis, Insights and Forecast - by Function
- 5.2.1. Coolant
- 5.2.2. Refrigerant
- 5.3. Market Analysis, Insights and Forecast - by End-user Industry
- 5.3.1. Chemical and Pharmaceutical
- 5.3.2. Healthcare
- 5.3.3. Transportation
- 5.3.4. Other End-user Industries
- 5.4. Market Analysis, Insights and Forecast - by Region
- 5.4.1. Asia Pacific
- 5.4.2. North America
- 5.4.3. Europe
- 5.4.4. South America
- 5.4.5. Middle East and Africa
- 5.1. Market Analysis, Insights and Forecast - by Storage Type
- 6. Asia Pacific Industrial Nitrogen Market Analysis, Insights and Forecast, 2019-2031
- 6.1. Market Analysis, Insights and Forecast - by Storage Type
- 6.1.1. Cylinder
- 6.1.2. Packaged Gas
- 6.2. Market Analysis, Insights and Forecast - by Function
- 6.2.1. Coolant
- 6.2.2. Refrigerant
- 6.3. Market Analysis, Insights and Forecast - by End-user Industry
- 6.3.1. Chemical and Pharmaceutical
- 6.3.2. Healthcare
- 6.3.3. Transportation
- 6.3.4. Other End-user Industries
- 6.1. Market Analysis, Insights and Forecast - by Storage Type
- 7. North America Industrial Nitrogen Market Analysis, Insights and Forecast, 2019-2031
- 7.1. Market Analysis, Insights and Forecast - by Storage Type
- 7.1.1. Cylinder
- 7.1.2. Packaged Gas
- 7.2. Market Analysis, Insights and Forecast - by Function
- 7.2.1. Coolant
- 7.2.2. Refrigerant
- 7.3. Market Analysis, Insights and Forecast - by End-user Industry
- 7.3.1. Chemical and Pharmaceutical
- 7.3.2. Healthcare
- 7.3.3. Transportation
- 7.3.4. Other End-user Industries
- 7.1. Market Analysis, Insights and Forecast - by Storage Type
- 8. Europe Industrial Nitrogen Market Analysis, Insights and Forecast, 2019-2031
- 8.1. Market Analysis, Insights and Forecast - by Storage Type
- 8.1.1. Cylinder
- 8.1.2. Packaged Gas
- 8.2. Market Analysis, Insights and Forecast - by Function
- 8.2.1. Coolant
- 8.2.2. Refrigerant
- 8.3. Market Analysis, Insights and Forecast - by End-user Industry
- 8.3.1. Chemical and Pharmaceutical
- 8.3.2. Healthcare
- 8.3.3. Transportation
- 8.3.4. Other End-user Industries
- 8.1. Market Analysis, Insights and Forecast - by Storage Type
- 9. South America Industrial Nitrogen Market Analysis, Insights and Forecast, 2019-2031
- 9.1. Market Analysis, Insights and Forecast - by Storage Type
- 9.1.1. Cylinder
- 9.1.2. Packaged Gas
- 9.2. Market Analysis, Insights and Forecast - by Function
- 9.2.1. Coolant
- 9.2.2. Refrigerant
- 9.3. Market Analysis, Insights and Forecast - by End-user Industry
- 9.3.1. Chemical and Pharmaceutical
- 9.3.2. Healthcare
- 9.3.3. Transportation
- 9.3.4. Other End-user Industries
- 9.1. Market Analysis, Insights and Forecast - by Storage Type
- 10. Middle East and Africa Industrial Nitrogen Market Analysis, Insights and Forecast, 2019-2031
- 10.1. Market Analysis, Insights and Forecast - by Storage Type
- 10.1.1. Cylinder
- 10.1.2. Packaged Gas
- 10.2. Market Analysis, Insights and Forecast - by Function
- 10.2.1. Coolant
- 10.2.2. Refrigerant
- 10.3. Market Analysis, Insights and Forecast - by End-user Industry
- 10.3.1. Chemical and Pharmaceutical
- 10.3.2. Healthcare
- 10.3.3. Transportation
- 10.3.4. Other End-user Industries
- 10.1. Market Analysis, Insights and Forecast - by Storage Type
- 11. Asia Pacific Industrial Nitrogen Market Analysis, Insights and Forecast, 2019-2031
- 11.1. Market Analysis, Insights and Forecast - By Country/Sub-region
- 11.1.1 China
- 11.1.2 India
- 11.1.3 Japan
- 11.1.4 South Korea
- 11.1.5 Rest of Asia Pacific
- 12. North America Industrial Nitrogen Market Analysis, Insights and Forecast, 2019-2031
- 12.1. Market Analysis, Insights and Forecast - By Country/Sub-region
- 12.1.1 United States
- 12.1.2 Canada
- 12.1.3 Mexico
- 13. Europe Industrial Nitrogen Market Analysis, Insights and Forecast, 2019-2031
- 13.1. Market Analysis, Insights and Forecast - By Country/Sub-region
- 13.1.1 Germany
- 13.1.2 United Kingdom
- 13.1.3 Italy
- 13.1.4 France
- 13.1.5 Rest of Europe
- 14. South America Industrial Nitrogen Market Analysis, Insights and Forecast, 2019-2031
- 14.1. Market Analysis, Insights and Forecast - By Country/Sub-region
- 14.1.1 Brazil
- 14.1.2 Argentina
- 14.1.3 Rest of South America
- 15. Middle East and Africa Industrial Nitrogen Market Analysis, Insights and Forecast, 2019-2031
- 15.1. Market Analysis, Insights and Forecast - By Country/Sub-region
- 15.1.1 Saudi Arabia
- 15.1.2 South Africa
- 15.1.3 Rest of Middle East and Africa
- 16. Competitive Analysis
- 16.1. Global Market Share Analysis 2024
- 16.2. Company Profiles
- 16.2.1 Air Products and Chemicals Inc
- 16.2.1.1. Overview
- 16.2.1.2. Products
- 16.2.1.3. SWOT Analysis
- 16.2.1.4. Recent Developments
- 16.2.1.5. Financials (Based on Availability)
- 16.2.2 Gulf Cryo
- 16.2.2.1. Overview
- 16.2.2.2. Products
- 16.2.2.3. SWOT Analysis
- 16.2.2.4. Recent Developments
- 16.2.2.5. Financials (Based on Availability)
- 16.2.3 Southern Industrial Gas Sdn Bhd
- 16.2.3.1. Overview
- 16.2.3.2. Products
- 16.2.3.3. SWOT Analysis
- 16.2.3.4. Recent Developments
- 16.2.3.5. Financials (Based on Availability)
- 16.2.4 Cryomech Inc
- 16.2.4.1. Overview
- 16.2.4.2. Products
- 16.2.4.3. SWOT Analysis
- 16.2.4.4. Recent Developments
- 16.2.4.5. Financials (Based on Availability)
- 16.2.5 Praxair Technology Inc
- 16.2.5.1. Overview
- 16.2.5.2. Products
- 16.2.5.3. SWOT Analysis
- 16.2.5.4. Recent Developments
- 16.2.5.5. Financials (Based on Availability)
- 16.2.6 Linde plc
- 16.2.6.1. Overview
- 16.2.6.2. Products
- 16.2.6.3. SWOT Analysis
- 16.2.6.4. Recent Developments
- 16.2.6.5. Financials (Based on Availability)
- 16.2.7 TAIYO NIPPON SANSO CORPORATION*List Not Exhaustive
- 16.2.7.1. Overview
- 16.2.7.2. Products
- 16.2.7.3. SWOT Analysis
- 16.2.7.4. Recent Developments
- 16.2.7.5. Financials (Based on Availability)
- 16.2.8 MVS Engineering Pvt Ltd
- 16.2.8.1. Overview
- 16.2.8.2. Products
- 16.2.8.3. SWOT Analysis
- 16.2.8.4. Recent Developments
- 16.2.8.5. Financials (Based on Availability)
- 16.2.9 Messer Group
- 16.2.9.1. Overview
- 16.2.9.2. Products
- 16.2.9.3. SWOT Analysis
- 16.2.9.4. Recent Developments
- 16.2.9.5. Financials (Based on Availability)
- 16.2.10 Air Liquide
- 16.2.10.1. Overview
- 16.2.10.2. Products
- 16.2.10.3. SWOT Analysis
- 16.2.10.4. Recent Developments
- 16.2.10.5. Financials (Based on Availability)
- 16.2.1 Air Products and Chemicals Inc
List of Figures
- Figure 1: Global Industrial Nitrogen Market Revenue Breakdown (Million, %) by Region 2024 & 2032
- Figure 2: Global Industrial Nitrogen Market Volume Breakdown (K Tons, %) by Region 2024 & 2032
- Figure 3: Asia Pacific Industrial Nitrogen Market Revenue (Million), by Country 2024 & 2032
- Figure 4: Asia Pacific Industrial Nitrogen Market Volume (K Tons), by Country 2024 & 2032
- Figure 5: Asia Pacific Industrial Nitrogen Market Revenue Share (%), by Country 2024 & 2032
- Figure 6: Asia Pacific Industrial Nitrogen Market Volume Share (%), by Country 2024 & 2032
- Figure 7: North America Industrial Nitrogen Market Revenue (Million), by Country 2024 & 2032
- Figure 8: North America Industrial Nitrogen Market Volume (K Tons), by Country 2024 & 2032
- Figure 9: North America Industrial Nitrogen Market Revenue Share (%), by Country 2024 & 2032
- Figure 10: North America Industrial Nitrogen Market Volume Share (%), by Country 2024 & 2032
- Figure 11: Europe Industrial Nitrogen Market Revenue (Million), by Country 2024 & 2032
- Figure 12: Europe Industrial Nitrogen Market Volume (K Tons), by Country 2024 & 2032
- Figure 13: Europe Industrial Nitrogen Market Revenue Share (%), by Country 2024 & 2032
- Figure 14: Europe Industrial Nitrogen Market Volume Share (%), by Country 2024 & 2032
- Figure 15: South America Industrial Nitrogen Market Revenue (Million), by Country 2024 & 2032
- Figure 16: South America Industrial Nitrogen Market Volume (K Tons), by Country 2024 & 2032
- Figure 17: South America Industrial Nitrogen Market Revenue Share (%), by Country 2024 & 2032
- Figure 18: South America Industrial Nitrogen Market Volume Share (%), by Country 2024 & 2032
- Figure 19: Middle East and Africa Industrial Nitrogen Market Revenue (Million), by Country 2024 & 2032
- Figure 20: Middle East and Africa Industrial Nitrogen Market Volume (K Tons), by Country 2024 & 2032
- Figure 21: Middle East and Africa Industrial Nitrogen Market Revenue Share (%), by Country 2024 & 2032
- Figure 22: Middle East and Africa Industrial Nitrogen Market Volume Share (%), by Country 2024 & 2032
- Figure 23: Asia Pacific Industrial Nitrogen Market Revenue (Million), by Storage Type 2024 & 2032
- Figure 24: Asia Pacific Industrial Nitrogen Market Volume (K Tons), by Storage Type 2024 & 2032
- Figure 25: Asia Pacific Industrial Nitrogen Market Revenue Share (%), by Storage Type 2024 & 2032
- Figure 26: Asia Pacific Industrial Nitrogen Market Volume Share (%), by Storage Type 2024 & 2032
- Figure 27: Asia Pacific Industrial Nitrogen Market Revenue (Million), by Function 2024 & 2032
- Figure 28: Asia Pacific Industrial Nitrogen Market Volume (K Tons), by Function 2024 & 2032
- Figure 29: Asia Pacific Industrial Nitrogen Market Revenue Share (%), by Function 2024 & 2032
- Figure 30: Asia Pacific Industrial Nitrogen Market Volume Share (%), by Function 2024 & 2032
- Figure 31: Asia Pacific Industrial Nitrogen Market Revenue (Million), by End-user Industry 2024 & 2032
- Figure 32: Asia Pacific Industrial Nitrogen Market Volume (K Tons), by End-user Industry 2024 & 2032
- Figure 33: Asia Pacific Industrial Nitrogen Market Revenue Share (%), by End-user Industry 2024 & 2032
- Figure 34: Asia Pacific Industrial Nitrogen Market Volume Share (%), by End-user Industry 2024 & 2032
- Figure 35: Asia Pacific Industrial Nitrogen Market Revenue (Million), by Country 2024 & 2032
- Figure 36: Asia Pacific Industrial Nitrogen Market Volume (K Tons), by Country 2024 & 2032
- Figure 37: Asia Pacific Industrial Nitrogen Market Revenue Share (%), by Country 2024 & 2032
- Figure 38: Asia Pacific Industrial Nitrogen Market Volume Share (%), by Country 2024 & 2032
- Figure 39: North America Industrial Nitrogen Market Revenue (Million), by Storage Type 2024 & 2032
- Figure 40: North America Industrial Nitrogen Market Volume (K Tons), by Storage Type 2024 & 2032
- Figure 41: North America Industrial Nitrogen Market Revenue Share (%), by Storage Type 2024 & 2032
- Figure 42: North America Industrial Nitrogen Market Volume Share (%), by Storage Type 2024 & 2032
- Figure 43: North America Industrial Nitrogen Market Revenue (Million), by Function 2024 & 2032
- Figure 44: North America Industrial Nitrogen Market Volume (K Tons), by Function 2024 & 2032
- Figure 45: North America Industrial Nitrogen Market Revenue Share (%), by Function 2024 & 2032
- Figure 46: North America Industrial Nitrogen Market Volume Share (%), by Function 2024 & 2032
- Figure 47: North America Industrial Nitrogen Market Revenue (Million), by End-user Industry 2024 & 2032
- Figure 48: North America Industrial Nitrogen Market Volume (K Tons), by End-user Industry 2024 & 2032
- Figure 49: North America Industrial Nitrogen Market Revenue Share (%), by End-user Industry 2024 & 2032
- Figure 50: North America Industrial Nitrogen Market Volume Share (%), by End-user Industry 2024 & 2032
- Figure 51: North America Industrial Nitrogen Market Revenue (Million), by Country 2024 & 2032
- Figure 52: North America Industrial Nitrogen Market Volume (K Tons), by Country 2024 & 2032
- Figure 53: North America Industrial Nitrogen Market Revenue Share (%), by Country 2024 & 2032
- Figure 54: North America Industrial Nitrogen Market Volume Share (%), by Country 2024 & 2032
- Figure 55: Europe Industrial Nitrogen Market Revenue (Million), by Storage Type 2024 & 2032
- Figure 56: Europe Industrial Nitrogen Market Volume (K Tons), by Storage Type 2024 & 2032
- Figure 57: Europe Industrial Nitrogen Market Revenue Share (%), by Storage Type 2024 & 2032
- Figure 58: Europe Industrial Nitrogen Market Volume Share (%), by Storage Type 2024 & 2032
- Figure 59: Europe Industrial Nitrogen Market Revenue (Million), by Function 2024 & 2032
- Figure 60: Europe Industrial Nitrogen Market Volume (K Tons), by Function 2024 & 2032
- Figure 61: Europe Industrial Nitrogen Market Revenue Share (%), by Function 2024 & 2032
- Figure 62: Europe Industrial Nitrogen Market Volume Share (%), by Function 2024 & 2032
- Figure 63: Europe Industrial Nitrogen Market Revenue (Million), by End-user Industry 2024 & 2032
- Figure 64: Europe Industrial Nitrogen Market Volume (K Tons), by End-user Industry 2024 & 2032
- Figure 65: Europe Industrial Nitrogen Market Revenue Share (%), by End-user Industry 2024 & 2032
- Figure 66: Europe Industrial Nitrogen Market Volume Share (%), by End-user Industry 2024 & 2032
- Figure 67: Europe Industrial Nitrogen Market Revenue (Million), by Country 2024 & 2032
- Figure 68: Europe Industrial Nitrogen Market Volume (K Tons), by Country 2024 & 2032
- Figure 69: Europe Industrial Nitrogen Market Revenue Share (%), by Country 2024 & 2032
- Figure 70: Europe Industrial Nitrogen Market Volume Share (%), by Country 2024 & 2032
- Figure 71: South America Industrial Nitrogen Market Revenue (Million), by Storage Type 2024 & 2032
- Figure 72: South America Industrial Nitrogen Market Volume (K Tons), by Storage Type 2024 & 2032
- Figure 73: South America Industrial Nitrogen Market Revenue Share (%), by Storage Type 2024 & 2032
- Figure 74: South America Industrial Nitrogen Market Volume Share (%), by Storage Type 2024 & 2032
- Figure 75: South America Industrial Nitrogen Market Revenue (Million), by Function 2024 & 2032
- Figure 76: South America Industrial Nitrogen Market Volume (K Tons), by Function 2024 & 2032
- Figure 77: South America Industrial Nitrogen Market Revenue Share (%), by Function 2024 & 2032
- Figure 78: South America Industrial Nitrogen Market Volume Share (%), by Function 2024 & 2032
- Figure 79: South America Industrial Nitrogen Market Revenue (Million), by End-user Industry 2024 & 2032
- Figure 80: South America Industrial Nitrogen Market Volume (K Tons), by End-user Industry 2024 & 2032
- Figure 81: South America Industrial Nitrogen Market Revenue Share (%), by End-user Industry 2024 & 2032
- Figure 82: South America Industrial Nitrogen Market Volume Share (%), by End-user Industry 2024 & 2032
- Figure 83: South America Industrial Nitrogen Market Revenue (Million), by Country 2024 & 2032
- Figure 84: South America Industrial Nitrogen Market Volume (K Tons), by Country 2024 & 2032
- Figure 85: South America Industrial Nitrogen Market Revenue Share (%), by Country 2024 & 2032
- Figure 86: South America Industrial Nitrogen Market Volume Share (%), by Country 2024 & 2032
- Figure 87: Middle East and Africa Industrial Nitrogen Market Revenue (Million), by Storage Type 2024 & 2032
- Figure 88: Middle East and Africa Industrial Nitrogen Market Volume (K Tons), by Storage Type 2024 & 2032
- Figure 89: Middle East and Africa Industrial Nitrogen Market Revenue Share (%), by Storage Type 2024 & 2032
- Figure 90: Middle East and Africa Industrial Nitrogen Market Volume Share (%), by Storage Type 2024 & 2032
- Figure 91: Middle East and Africa Industrial Nitrogen Market Revenue (Million), by Function 2024 & 2032
- Figure 92: Middle East and Africa Industrial Nitrogen Market Volume (K Tons), by Function 2024 & 2032
- Figure 93: Middle East and Africa Industrial Nitrogen Market Revenue Share (%), by Function 2024 & 2032
- Figure 94: Middle East and Africa Industrial Nitrogen Market Volume Share (%), by Function 2024 & 2032
- Figure 95: Middle East and Africa Industrial Nitrogen Market Revenue (Million), by End-user Industry 2024 & 2032
- Figure 96: Middle East and Africa Industrial Nitrogen Market Volume (K Tons), by End-user Industry 2024 & 2032
- Figure 97: Middle East and Africa Industrial Nitrogen Market Revenue Share (%), by End-user Industry 2024 & 2032
- Figure 98: Middle East and Africa Industrial Nitrogen Market Volume Share (%), by End-user Industry 2024 & 2032
- Figure 99: Middle East and Africa Industrial Nitrogen Market Revenue (Million), by Country 2024 & 2032
- Figure 100: Middle East and Africa Industrial Nitrogen Market Volume (K Tons), by Country 2024 & 2032
- Figure 101: Middle East and Africa Industrial Nitrogen Market Revenue Share (%), by Country 2024 & 2032
- Figure 102: Middle East and Africa Industrial Nitrogen Market Volume Share (%), by Country 2024 & 2032
List of Tables
- Table 1: Global Industrial Nitrogen Market Revenue Million Forecast, by Region 2019 & 2032
- Table 2: Global Industrial Nitrogen Market Volume K Tons Forecast, by Region 2019 & 2032
- Table 3: Global Industrial Nitrogen Market Revenue Million Forecast, by Storage Type 2019 & 2032
- Table 4: Global Industrial Nitrogen Market Volume K Tons Forecast, by Storage Type 2019 & 2032
- Table 5: Global Industrial Nitrogen Market Revenue Million Forecast, by Function 2019 & 2032
- Table 6: Global Industrial Nitrogen Market Volume K Tons Forecast, by Function 2019 & 2032
- Table 7: Global Industrial Nitrogen Market Revenue Million Forecast, by End-user Industry 2019 & 2032
- Table 8: Global Industrial Nitrogen Market Volume K Tons Forecast, by End-user Industry 2019 & 2032
- Table 9: Global Industrial Nitrogen Market Revenue Million Forecast, by Region 2019 & 2032
- Table 10: Global Industrial Nitrogen Market Volume K Tons Forecast, by Region 2019 & 2032
- Table 11: Global Industrial Nitrogen Market Revenue Million Forecast, by Country 2019 & 2032
- Table 12: Global Industrial Nitrogen Market Volume K Tons Forecast, by Country 2019 & 2032
- Table 13: China Industrial Nitrogen Market Revenue (Million) Forecast, by Application 2019 & 2032
- Table 14: China Industrial Nitrogen Market Volume (K Tons) Forecast, by Application 2019 & 2032
- Table 15: India Industrial Nitrogen Market Revenue (Million) Forecast, by Application 2019 & 2032
- Table 16: India Industrial Nitrogen Market Volume (K Tons) Forecast, by Application 2019 & 2032
- Table 17: Japan Industrial Nitrogen Market Revenue (Million) Forecast, by Application 2019 & 2032
- Table 18: Japan Industrial Nitrogen Market Volume (K Tons) Forecast, by Application 2019 & 2032
- Table 19: South Korea Industrial Nitrogen Market Revenue (Million) Forecast, by Application 2019 & 2032
- Table 20: South Korea Industrial Nitrogen Market Volume (K Tons) Forecast, by Application 2019 & 2032
- Table 21: Rest of Asia Pacific Industrial Nitrogen Market Revenue (Million) Forecast, by Application 2019 & 2032
- Table 22: Rest of Asia Pacific Industrial Nitrogen Market Volume (K Tons) Forecast, by Application 2019 & 2032
- Table 23: Global Industrial Nitrogen Market Revenue Million Forecast, by Country 2019 & 2032
- Table 24: Global Industrial Nitrogen Market Volume K Tons Forecast, by Country 2019 & 2032
- Table 25: United States Industrial Nitrogen Market Revenue (Million) Forecast, by Application 2019 & 2032
- Table 26: United States Industrial Nitrogen Market Volume (K Tons) Forecast, by Application 2019 & 2032
- Table 27: Canada Industrial Nitrogen Market Revenue (Million) Forecast, by Application 2019 & 2032
- Table 28: Canada Industrial Nitrogen Market Volume (K Tons) Forecast, by Application 2019 & 2032
- Table 29: Mexico Industrial Nitrogen Market Revenue (Million) Forecast, by Application 2019 & 2032
- Table 30: Mexico Industrial Nitrogen Market Volume (K Tons) Forecast, by Application 2019 & 2032
- Table 31: Global Industrial Nitrogen Market Revenue Million Forecast, by Country 2019 & 2032
- Table 32: Global Industrial Nitrogen Market Volume K Tons Forecast, by Country 2019 & 2032
- Table 33: Germany Industrial Nitrogen Market Revenue (Million) Forecast, by Application 2019 & 2032
- Table 34: Germany Industrial Nitrogen Market Volume (K Tons) Forecast, by Application 2019 & 2032
- Table 35: United Kingdom Industrial Nitrogen Market Revenue (Million) Forecast, by Application 2019 & 2032
- Table 36: United Kingdom Industrial Nitrogen Market Volume (K Tons) Forecast, by Application 2019 & 2032
- Table 37: Italy Industrial Nitrogen Market Revenue (Million) Forecast, by Application 2019 & 2032
- Table 38: Italy Industrial Nitrogen Market Volume (K Tons) Forecast, by Application 2019 & 2032
- Table 39: France Industrial Nitrogen Market Revenue (Million) Forecast, by Application 2019 & 2032
- Table 40: France Industrial Nitrogen Market Volume (K Tons) Forecast, by Application 2019 & 2032
- Table 41: Rest of Europe Industrial Nitrogen Market Revenue (Million) Forecast, by Application 2019 & 2032
- Table 42: Rest of Europe Industrial Nitrogen Market Volume (K Tons) Forecast, by Application 2019 & 2032
- Table 43: Global Industrial Nitrogen Market Revenue Million Forecast, by Country 2019 & 2032
- Table 44: Global Industrial Nitrogen Market Volume K Tons Forecast, by Country 2019 & 2032
- Table 45: Brazil Industrial Nitrogen Market Revenue (Million) Forecast, by Application 2019 & 2032
- Table 46: Brazil Industrial Nitrogen Market Volume (K Tons) Forecast, by Application 2019 & 2032
- Table 47: Argentina Industrial Nitrogen Market Revenue (Million) Forecast, by Application 2019 & 2032
- Table 48: Argentina Industrial Nitrogen Market Volume (K Tons) Forecast, by Application 2019 & 2032
- Table 49: Rest of South America Industrial Nitrogen Market Revenue (Million) Forecast, by Application 2019 & 2032
- Table 50: Rest of South America Industrial Nitrogen Market Volume (K Tons) Forecast, by Application 2019 & 2032
- Table 51: Global Industrial Nitrogen Market Revenue Million Forecast, by Country 2019 & 2032
- Table 52: Global Industrial Nitrogen Market Volume K Tons Forecast, by Country 2019 & 2032
- Table 53: Saudi Arabia Industrial Nitrogen Market Revenue (Million) Forecast, by Application 2019 & 2032
- Table 54: Saudi Arabia Industrial Nitrogen Market Volume (K Tons) Forecast, by Application 2019 & 2032
- Table 55: South Africa Industrial Nitrogen Market Revenue (Million) Forecast, by Application 2019 & 2032
- Table 56: South Africa Industrial Nitrogen Market Volume (K Tons) Forecast, by Application 2019 & 2032
- Table 57: Rest of Middle East and Africa Industrial Nitrogen Market Revenue (Million) Forecast, by Application 2019 & 2032
- Table 58: Rest of Middle East and Africa Industrial Nitrogen Market Volume (K Tons) Forecast, by Application 2019 & 2032
- Table 59: Global Industrial Nitrogen Market Revenue Million Forecast, by Storage Type 2019 & 2032
- Table 60: Global Industrial Nitrogen Market Volume K Tons Forecast, by Storage Type 2019 & 2032
- Table 61: Global Industrial Nitrogen Market Revenue Million Forecast, by Function 2019 & 2032
- Table 62: Global Industrial Nitrogen Market Volume K Tons Forecast, by Function 2019 & 2032
- Table 63: Global Industrial Nitrogen Market Revenue Million Forecast, by End-user Industry 2019 & 2032
- Table 64: Global Industrial Nitrogen Market Volume K Tons Forecast, by End-user Industry 2019 & 2032
- Table 65: Global Industrial Nitrogen Market Revenue Million Forecast, by Country 2019 & 2032
- Table 66: Global Industrial Nitrogen Market Volume K Tons Forecast, by Country 2019 & 2032
- Table 67: China Industrial Nitrogen Market Revenue (Million) Forecast, by Application 2019 & 2032
- Table 68: China Industrial Nitrogen Market Volume (K Tons) Forecast, by Application 2019 & 2032
- Table 69: India Industrial Nitrogen Market Revenue (Million) Forecast, by Application 2019 & 2032
- Table 70: India Industrial Nitrogen Market Volume (K Tons) Forecast, by Application 2019 & 2032
- Table 71: Japan Industrial Nitrogen Market Revenue (Million) Forecast, by Application 2019 & 2032
- Table 72: Japan Industrial Nitrogen Market Volume (K Tons) Forecast, by Application 2019 & 2032
- Table 73: South Korea Industrial Nitrogen Market Revenue (Million) Forecast, by Application 2019 & 2032
- Table 74: South Korea Industrial Nitrogen Market Volume (K Tons) Forecast, by Application 2019 & 2032
- Table 75: Rest of Asia Pacific Industrial Nitrogen Market Revenue (Million) Forecast, by Application 2019 & 2032
- Table 76: Rest of Asia Pacific Industrial Nitrogen Market Volume (K Tons) Forecast, by Application 2019 & 2032
- Table 77: Global Industrial Nitrogen Market Revenue Million Forecast, by Storage Type 2019 & 2032
- Table 78: Global Industrial Nitrogen Market Volume K Tons Forecast, by Storage Type 2019 & 2032
- Table 79: Global Industrial Nitrogen Market Revenue Million Forecast, by Function 2019 & 2032
- Table 80: Global Industrial Nitrogen Market Volume K Tons Forecast, by Function 2019 & 2032
- Table 81: Global Industrial Nitrogen Market Revenue Million Forecast, by End-user Industry 2019 & 2032
- Table 82: Global Industrial Nitrogen Market Volume K Tons Forecast, by End-user Industry 2019 & 2032
- Table 83: Global Industrial Nitrogen Market Revenue Million Forecast, by Country 2019 & 2032
- Table 84: Global Industrial Nitrogen Market Volume K Tons Forecast, by Country 2019 & 2032
- Table 85: United States Industrial Nitrogen Market Revenue (Million) Forecast, by Application 2019 & 2032
- Table 86: United States Industrial Nitrogen Market Volume (K Tons) Forecast, by Application 2019 & 2032
- Table 87: Canada Industrial Nitrogen Market Revenue (Million) Forecast, by Application 2019 & 2032
- Table 88: Canada Industrial Nitrogen Market Volume (K Tons) Forecast, by Application 2019 & 2032
- Table 89: Mexico Industrial Nitrogen Market Revenue (Million) Forecast, by Application 2019 & 2032
- Table 90: Mexico Industrial Nitrogen Market Volume (K Tons) Forecast, by Application 2019 & 2032
- Table 91: Global Industrial Nitrogen Market Revenue Million Forecast, by Storage Type 2019 & 2032
- Table 92: Global Industrial Nitrogen Market Volume K Tons Forecast, by Storage Type 2019 & 2032
- Table 93: Global Industrial Nitrogen Market Revenue Million Forecast, by Function 2019 & 2032
- Table 94: Global Industrial Nitrogen Market Volume K Tons Forecast, by Function 2019 & 2032
- Table 95: Global Industrial Nitrogen Market Revenue Million Forecast, by End-user Industry 2019 & 2032
- Table 96: Global Industrial Nitrogen Market Volume K Tons Forecast, by End-user Industry 2019 & 2032
- Table 97: Global Industrial Nitrogen Market Revenue Million Forecast, by Country 2019 & 2032
- Table 98: Global Industrial Nitrogen Market Volume K Tons Forecast, by Country 2019 & 2032
- Table 99: Germany Industrial Nitrogen Market Revenue (Million) Forecast, by Application 2019 & 2032
- Table 100: Germany Industrial Nitrogen Market Volume (K Tons) Forecast, by Application 2019 & 2032
- Table 101: United Kingdom Industrial Nitrogen Market Revenue (Million) Forecast, by Application 2019 & 2032
- Table 102: United Kingdom Industrial Nitrogen Market Volume (K Tons) Forecast, by Application 2019 & 2032
- Table 103: Italy Industrial Nitrogen Market Revenue (Million) Forecast, by Application 2019 & 2032
- Table 104: Italy Industrial Nitrogen Market Volume (K Tons) Forecast, by Application 2019 & 2032
- Table 105: France Industrial Nitrogen Market Revenue (Million) Forecast, by Application 2019 & 2032
- Table 106: France Industrial Nitrogen Market Volume (K Tons) Forecast, by Application 2019 & 2032
- Table 107: Rest of Europe Industrial Nitrogen Market Revenue (Million) Forecast, by Application 2019 & 2032
- Table 108: Rest of Europe Industrial Nitrogen Market Volume (K Tons) Forecast, by Application 2019 & 2032
- Table 109: Global Industrial Nitrogen Market Revenue Million Forecast, by Storage Type 2019 & 2032
- Table 110: Global Industrial Nitrogen Market Volume K Tons Forecast, by Storage Type 2019 & 2032
- Table 111: Global Industrial Nitrogen Market Revenue Million Forecast, by Function 2019 & 2032
- Table 112: Global Industrial Nitrogen Market Volume K Tons Forecast, by Function 2019 & 2032
- Table 113: Global Industrial Nitrogen Market Revenue Million Forecast, by End-user Industry 2019 & 2032
- Table 114: Global Industrial Nitrogen Market Volume K Tons Forecast, by End-user Industry 2019 & 2032
- Table 115: Global Industrial Nitrogen Market Revenue Million Forecast, by Country 2019 & 2032
- Table 116: Global Industrial Nitrogen Market Volume K Tons Forecast, by Country 2019 & 2032
- Table 117: Brazil Industrial Nitrogen Market Revenue (Million) Forecast, by Application 2019 & 2032
- Table 118: Brazil Industrial Nitrogen Market Volume (K Tons) Forecast, by Application 2019 & 2032
- Table 119: Argentina Industrial Nitrogen Market Revenue (Million) Forecast, by Application 2019 & 2032
- Table 120: Argentina Industrial Nitrogen Market Volume (K Tons) Forecast, by Application 2019 & 2032
- Table 121: Rest of South America Industrial Nitrogen Market Revenue (Million) Forecast, by Application 2019 & 2032
- Table 122: Rest of South America Industrial Nitrogen Market Volume (K Tons) Forecast, by Application 2019 & 2032
- Table 123: Global Industrial Nitrogen Market Revenue Million Forecast, by Storage Type 2019 & 2032
- Table 124: Global Industrial Nitrogen Market Volume K Tons Forecast, by Storage Type 2019 & 2032
- Table 125: Global Industrial Nitrogen Market Revenue Million Forecast, by Function 2019 & 2032
- Table 126: Global Industrial Nitrogen Market Volume K Tons Forecast, by Function 2019 & 2032
- Table 127: Global Industrial Nitrogen Market Revenue Million Forecast, by End-user Industry 2019 & 2032
- Table 128: Global Industrial Nitrogen Market Volume K Tons Forecast, by End-user Industry 2019 & 2032
- Table 129: Global Industrial Nitrogen Market Revenue Million Forecast, by Country 2019 & 2032
- Table 130: Global Industrial Nitrogen Market Volume K Tons Forecast, by Country 2019 & 2032
- Table 131: Saudi Arabia Industrial Nitrogen Market Revenue (Million) Forecast, by Application 2019 & 2032
- Table 132: Saudi Arabia Industrial Nitrogen Market Volume (K Tons) Forecast, by Application 2019 & 2032
- Table 133: South Africa Industrial Nitrogen Market Revenue (Million) Forecast, by Application 2019 & 2032
- Table 134: South Africa Industrial Nitrogen Market Volume (K Tons) Forecast, by Application 2019 & 2032
- Table 135: Rest of Middle East and Africa Industrial Nitrogen Market Revenue (Million) Forecast, by Application 2019 & 2032
- Table 136: Rest of Middle East and Africa Industrial Nitrogen Market Volume (K Tons) Forecast, by Application 2019 & 2032
Frequently Asked Questions
1. What is the projected Compound Annual Growth Rate (CAGR) of the Industrial Nitrogen Market?
The projected CAGR is approximately 4.75%.
2. Which companies are prominent players in the Industrial Nitrogen Market?
Key companies in the market include Air Products and Chemicals Inc, Gulf Cryo, Southern Industrial Gas Sdn Bhd, Cryomech Inc, Praxair Technology Inc, Linde plc, TAIYO NIPPON SANSO CORPORATION*List Not Exhaustive, MVS Engineering Pvt Ltd, Messer Group, Air Liquide.
3. What are the main segments of the Industrial Nitrogen Market?
The market segments include Storage Type, Function, End-user Industry.
4. Can you provide details about the market size?
The market size is estimated to be USD 3830 Million as of 2022.
5. What are some drivers contributing to market growth?
Increasing Demand from the Chemical and Pharmaceutical Industry; Growing Application in the Healthcare Industry; Other Drivers.
6. What are the notable trends driving market growth?
Growing Demand from the Chemical and Pharmaceutical Industry.
7. Are there any restraints impacting market growth?
Regulatory Restrictions in Maintaining Liquid Nitrogen Plant; Other Restraints.
8. Can you provide examples of recent developments in the market?
April 2022: Linde plc signed another long-term arrangement to supply bulk industrial gases with a major space launch firm in Florida. Linde will deliver liquid nitrogen to the client from its air separation facility in Mims, Florida, expanding to increase production capacity by up to 50%. The extra capacity, expected to begin operations in 2023, will fulfill the new agreement's demands and increase demand from clients in the aerospace, healthcare, manufacturing, food processing, and water treatment end sectors.
9. What pricing options are available for accessing the report?
Pricing options include single-user, multi-user, and enterprise licenses priced at USD 4750, USD 5250, and USD 8750 respectively.
10. Is the market size provided in terms of value or volume?
The market size is provided in terms of value, measured in Million and volume, measured in K Tons.
11. Are there any specific market keywords associated with the report?
Yes, the market keyword associated with the report is "Industrial Nitrogen Market," which aids in identifying and referencing the specific market segment covered.
12. How do I determine which pricing option suits my needs best?
The pricing options vary based on user requirements and access needs. Individual users may opt for single-user licenses, while businesses requiring broader access may choose multi-user or enterprise licenses for cost-effective access to the report.
13. Are there any additional resources or data provided in the Industrial Nitrogen Market report?
While the report offers comprehensive insights, it's advisable to review the specific contents or supplementary materials provided to ascertain if additional resources or data are available.
14. How can I stay updated on further developments or reports in the Industrial Nitrogen Market?
To stay informed about further developments, trends, and reports in the Industrial Nitrogen Market, consider subscribing to industry newsletters, following relevant companies and organizations, or regularly checking reputable industry news sources and publications.
Methodology
Step 1 - Identification of Relevant Samples Size from Population Database


Step 2 - Approaches for Defining Global Market Size (Value, Volume* & Price*)

Note*: In applicable scenarios
Step 3 - Data Sources
Primary Research
- Web Analytics
- Survey Reports
- Research Institute
- Latest Research Reports
- Opinion Leaders
Secondary Research
- Annual Reports
- White Paper
- Latest Press Release
- Industry Association
- Paid Database
- Investor Presentations

Step 4 - Data Triangulation
Involves using different sources of information in order to increase the validity of a study
These sources are likely to be stakeholders in a program - participants, other researchers, program staff, other community members, and so on.
Then we put all data in single framework & apply various statistical tools to find out the dynamic on the market.
During the analysis stage, feedback from the stakeholder groups would be compared to determine areas of agreement as well as areas of divergence
