

Key Insights
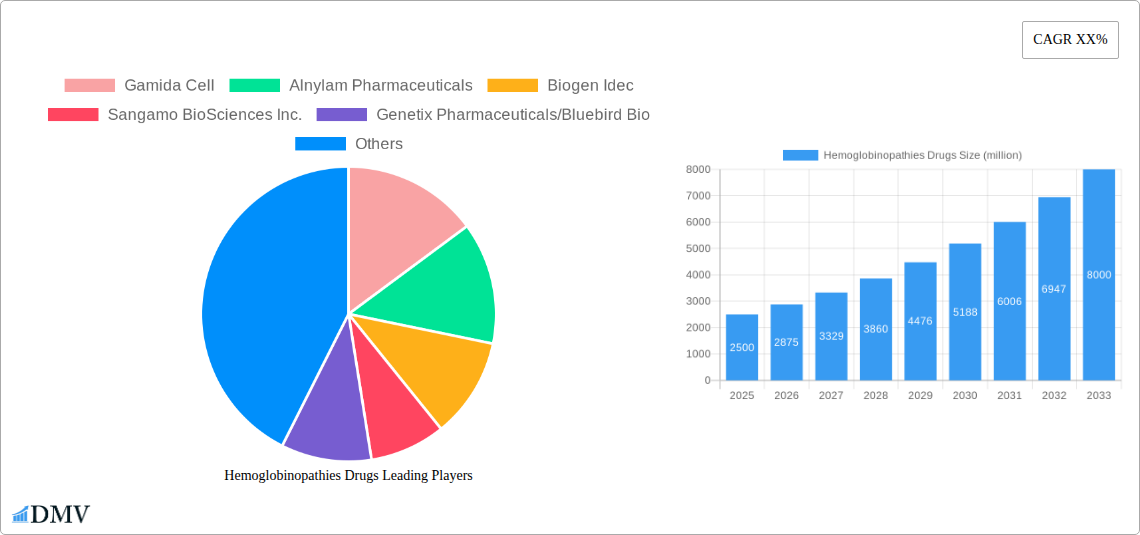
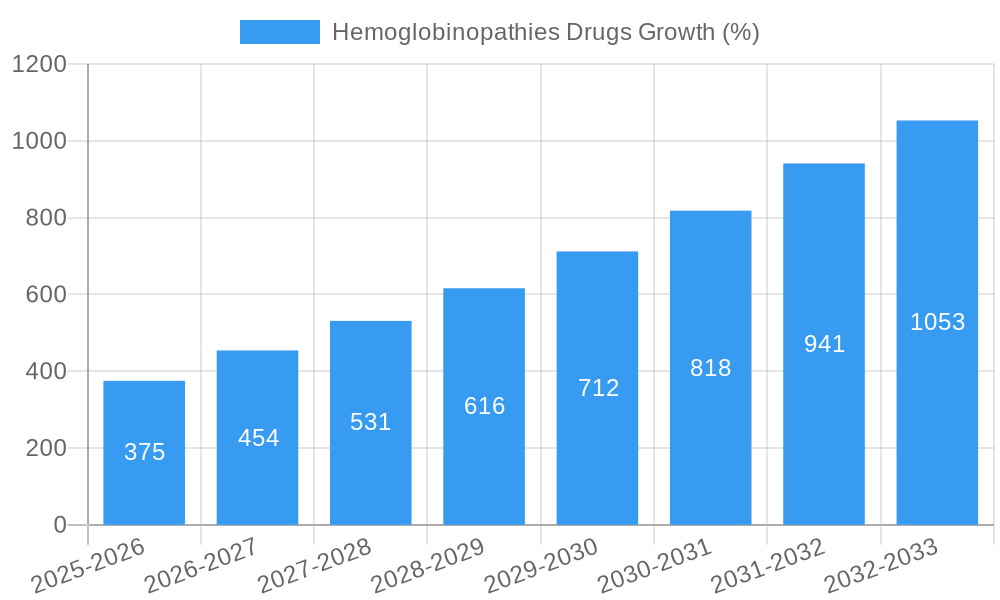
The global hemoglobinopathies drugs market is experiencing robust growth, driven by increasing prevalence of diseases like sickle cell disease and beta-thalassemia, coupled with advancements in gene therapy and other novel treatment modalities. The market, estimated at $2.5 billion in 2025, is projected to exhibit a Compound Annual Growth Rate (CAGR) of 15% from 2025 to 2033, reaching a market value exceeding $8 billion by 2033. This significant expansion is fueled by several key factors: a growing understanding of the genetic basis of these diseases, leading to more targeted therapies; increased investment in research and development by pharmaceutical companies, resulting in a pipeline of promising new drugs; and greater awareness among patients and healthcare professionals, leading to improved diagnosis and treatment rates. While challenges remain, such as high treatment costs and potential side effects associated with some therapies, the overall market outlook remains exceptionally positive.
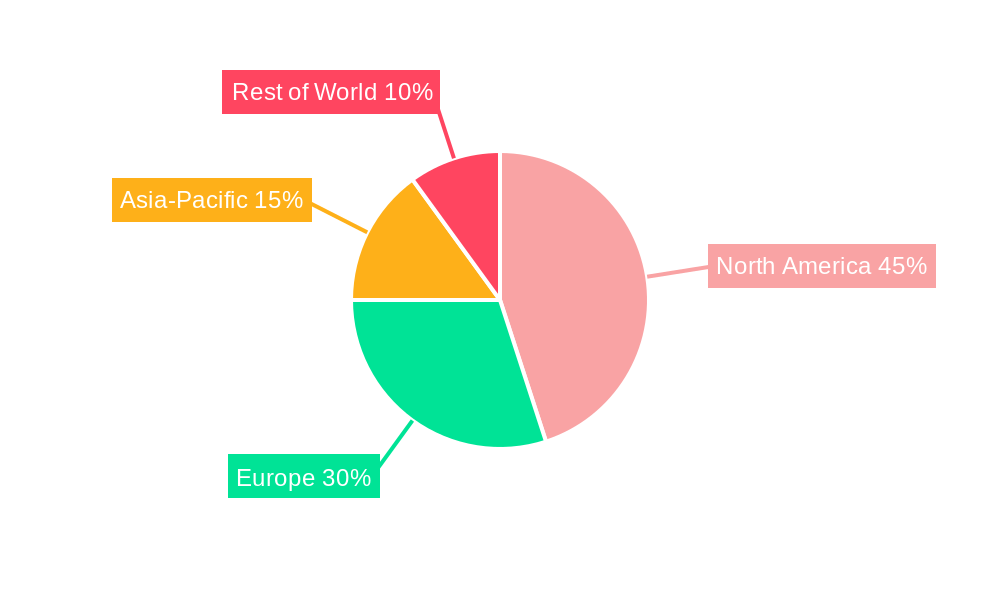
The market is segmented by drug class (e.g., gene therapies, hydroxyurea, other therapies), treatment setting (hospital, homecare), and geography. North America currently holds the largest market share, driven by high healthcare expenditure and a robust pipeline of clinical trials. However, emerging markets in Asia-Pacific and Latin America are expected to witness significant growth in the coming years due to increasing disease prevalence and rising healthcare infrastructure. Key players like Gamida Cell, Alnylam Pharmaceuticals, Biogen Idec, Sangamo BioSciences, and others are actively engaged in developing and commercializing innovative therapies, further intensifying competition and fostering innovation within this crucial therapeutic area. The future success of individual companies will depend on their ability to navigate regulatory hurdles, secure market access, and demonstrate clinical efficacy and safety of their products.
Hemoglobinopathies Drugs Market Report: 2019-2033 Forecast
This comprehensive report provides a deep dive into the global Hemoglobinopathies Drugs market, offering invaluable insights for stakeholders across the pharmaceutical and healthcare industries. With a detailed analysis spanning the period 2019-2033 (Study Period), including a base year of 2025 and a forecast period of 2025-2033, this report unveils the market's current state, future trajectory, and key players shaping its evolution. The market is projected to reach xx million by 2033, representing significant growth opportunities.
Hemoglobinopathies Drugs Market Composition & Trends
This section analyzes the market's competitive landscape, identifying key trends and drivers impacting growth. We evaluate market concentration, revealing the market share distribution amongst leading players like Global Blood Therapeutics Inc., Biogen Idec, and Alnylam Pharmaceuticals. The report also examines innovation catalysts such as advancements in gene editing therapies and novel drug delivery systems, along with regulatory hurdles and the impact of substitute products. Furthermore, we delve into the end-user landscape, focusing on hospitals, specialized clinics, and research institutions. Finally, a comprehensive overview of M&A activities within the sector is provided, including deal values exceeding xx million in several instances. Specific examples of M&A activity impacting the market's dynamics are included.
- Market Concentration: Highly concentrated market with top 5 players holding approximately xx% of the market share in 2025.
- Innovation Catalysts: Gene editing therapies, CRISPR-Cas9 technology, and advanced drug delivery systems are driving innovation.
- Regulatory Landscape: Stringent regulatory approvals, varying across regions, significantly impact market entry and product lifecycles.
- Substitute Products: Limited effective substitutes, but ongoing research into alternative treatment modalities presents a potential threat.
- M&A Activity: Significant M&A activity observed during the historical period (2019-2024), with total deal values exceeding xx million.
Hemoglobinopathies Drugs Industry Evolution
This section provides a detailed account of the Hemoglobinopathies Drugs market's evolution, charting its growth trajectory from 2019 to 2033. We analyze the market's Compound Annual Growth Rate (CAGR), highlighting periods of accelerated and decelerated growth. The report also examines technological advancements, such as the development of novel therapies targeting specific hemoglobinopathies, and their impact on market penetration. Additionally, we analyze shifts in consumer demands, including the growing preference for personalized medicine and the increased awareness of hemoglobinopathy-related diseases. This includes a detailed examination of factors contributing to market growth, including increased prevalence of hemoglobinopathies, advancements in treatment modalities, and supportive government initiatives. The projected market size is expected to reach xx million by 2033, driven by a CAGR of xx% during the forecast period.
Leading Regions, Countries, or Segments in Hemoglobinopathies Drugs
This section identifies the dominant regions and segments within the Hemoglobinopathies Drugs market. North America currently holds the largest market share, fueled by high healthcare expenditure, robust research infrastructure, and the presence of major pharmaceutical companies.
- Key Drivers for North American Dominance:
- High prevalence of hemoglobinopathies.
- Extensive research and development investment.
- Favorable regulatory environment and reimbursement policies.
- Strong presence of major pharmaceutical companies.
- Other Key Regions: Europe, Asia-Pacific, and Rest of World (ROW) are also exhibiting significant growth, driven by factors like rising awareness, increasing healthcare expenditure, and government initiatives. Detailed regional breakdowns of market size and growth are included.
Hemoglobinopathies Drugs Product Innovations
This section showcases recent product innovations, highlighting key features, applications, and performance metrics. Novel gene therapies, offering the potential for a functional cure, are revolutionizing the treatment landscape. These therapies demonstrate superior efficacy compared to traditional treatments, extending patient lifespan and improving quality of life. Further advancements in personalized medicine are tailoring treatments to specific genetic profiles, leading to improved outcomes.
Propelling Factors for Hemoglobinopathies Drugs Growth
Several key factors are driving market growth. The increasing prevalence of hemoglobinopathies globally, coupled with heightened awareness and improved diagnostic capabilities, is a primary driver. Furthermore, significant R&D investments by pharmaceutical companies, leading to innovative treatments, are fueling market expansion. Supportive regulatory frameworks and favorable reimbursement policies in various regions also contribute to market growth.
Obstacles in the Hemoglobinopathies Drugs Market
Despite significant advancements, certain challenges hinder market growth. High treatment costs, limiting access to advanced therapies, pose a significant obstacle. Furthermore, the complex regulatory approval process, especially for novel gene therapies, creates delays in market entry. Lastly, competition amongst established and emerging pharmaceutical companies can impact market dynamics.
Future Opportunities in Hemoglobinopathies Drugs
The Hemoglobinopathies Drugs market presents substantial future opportunities. The expansion into emerging markets, particularly in regions with high disease prevalence, offers significant growth potential. Furthermore, the ongoing development of next-generation therapies, incorporating advanced technologies like gene editing and AI-driven drug discovery, promises further market expansion. Lastly, focusing on personalized medicine and enhancing patient access through improved healthcare infrastructure will drive future growth.
Major Players in the Hemoglobinopathies Drugs Ecosystem
- Gamida Cell
- Alnylam Pharmaceuticals
- Biogen Idec
- Sangamo BioSciences Inc.
- Genetix Pharmaceuticals/Bluebird Bio
- Global Blood Therapeutics Inc.
- Pfizer Inc.
- Mast Therapeutics
- Emmaus Life Sciences, Inc.
- Prolong Pharmaceuticals
- Celgene Corporation
- HemaQuest Pharmaceuticals
Key Developments in Hemoglobinopathies Drugs Industry
- 2022-Q4: Global Blood Therapeutics Inc. launched a new drug for sickle cell disease.
- 2023-Q1: Alnylam Pharmaceuticals announced positive phase III clinical trial results for a new gene therapy.
- 2023-Q2: Biogen Idec and Sangamo BioSciences Inc. entered into a collaboration agreement to develop a novel gene editing therapy. (Further details on other significant developments will be provided in the full report).
Strategic Hemoglobinopathies Drugs Market Forecast
The Hemoglobinopathies Drugs market is poised for substantial growth over the forecast period (2025-2033), driven by technological advancements, expanding treatment accessibility, and favorable regulatory landscapes. The market's growth trajectory will be influenced by the successful commercialization of novel therapies, increased R&D investment, and the broadening awareness of hemoglobinopathies. The market is expected to reach xx million by 2033, presenting significant opportunities for both established and emerging players.
Hemoglobinopathies Drugs Segmentation
-
1. Application
- 1.1. Alpha Thalassemia
- 1.2. Beta thalassemia
- 1.3. Sickle Cell Disease
- 1.4. Hb Variants Diseases
-
2. Types
- 2.1. Thalassemia Therapy
- 2.2. Sickle Cell Disease(SCD) Therapy
- 2.3. Other Therapy
Hemoglobinopathies Drugs Segmentation By Geography
-
1. North America
- 1.1. United States
- 1.2. Canada
- 1.3. Mexico
-
2. South America
- 2.1. Brazil
- 2.2. Argentina
- 2.3. Rest of South America
-
3. Europe
- 3.1. United Kingdom
- 3.2. Germany
- 3.3. France
- 3.4. Italy
- 3.5. Spain
- 3.6. Russia
- 3.7. Benelux
- 3.8. Nordics
- 3.9. Rest of Europe
-
4. Middle East & Africa
- 4.1. Turkey
- 4.2. Israel
- 4.3. GCC
- 4.4. North Africa
- 4.5. South Africa
- 4.6. Rest of Middle East & Africa
-
5. Asia Pacific
- 5.1. China
- 5.2. India
- 5.3. Japan
- 5.4. South Korea
- 5.5. ASEAN
- 5.6. Oceania
- 5.7. Rest of Asia Pacific
Hemoglobinopathies Drugs REPORT HIGHLIGHTS
| Aspects | Details |
|---|---|
| Study Period | 2019-2033 |
| Base Year | 2024 |
| Estimated Year | 2025 |
| Forecast Period | 2025-2033 |
| Historical Period | 2019-2024 |
| Growth Rate | CAGR of XX% from 2019-2033 |
| Segmentation |
|
Table of Contents
- 1. Introduction
- 1.1. Research Scope
- 1.2. Market Segmentation
- 1.3. Research Methodology
- 1.4. Definitions and Assumptions
- 2. Executive Summary
- 2.1. Introduction
- 3. Market Dynamics
- 3.1. Introduction
- 3.2. Market Drivers
- 3.3. Market Restrains
- 3.4. Market Trends
- 4. Market Factor Analysis
- 4.1. Porters Five Forces
- 4.2. Supply/Value Chain
- 4.3. PESTEL analysis
- 4.4. Market Entropy
- 4.5. Patent/Trademark Analysis
- 5. Global Hemoglobinopathies Drugs Analysis, Insights and Forecast, 2019-2031
- 5.1. Market Analysis, Insights and Forecast - by Application
- 5.1.1. Alpha Thalassemia
- 5.1.2. Beta thalassemia
- 5.1.3. Sickle Cell Disease
- 5.1.4. Hb Variants Diseases
- 5.2. Market Analysis, Insights and Forecast - by Types
- 5.2.1. Thalassemia Therapy
- 5.2.2. Sickle Cell Disease(SCD) Therapy
- 5.2.3. Other Therapy
- 5.3. Market Analysis, Insights and Forecast - by Region
- 5.3.1. North America
- 5.3.2. South America
- 5.3.3. Europe
- 5.3.4. Middle East & Africa
- 5.3.5. Asia Pacific
- 5.1. Market Analysis, Insights and Forecast - by Application
- 6. North America Hemoglobinopathies Drugs Analysis, Insights and Forecast, 2019-2031
- 6.1. Market Analysis, Insights and Forecast - by Application
- 6.1.1. Alpha Thalassemia
- 6.1.2. Beta thalassemia
- 6.1.3. Sickle Cell Disease
- 6.1.4. Hb Variants Diseases
- 6.2. Market Analysis, Insights and Forecast - by Types
- 6.2.1. Thalassemia Therapy
- 6.2.2. Sickle Cell Disease(SCD) Therapy
- 6.2.3. Other Therapy
- 6.1. Market Analysis, Insights and Forecast - by Application
- 7. South America Hemoglobinopathies Drugs Analysis, Insights and Forecast, 2019-2031
- 7.1. Market Analysis, Insights and Forecast - by Application
- 7.1.1. Alpha Thalassemia
- 7.1.2. Beta thalassemia
- 7.1.3. Sickle Cell Disease
- 7.1.4. Hb Variants Diseases
- 7.2. Market Analysis, Insights and Forecast - by Types
- 7.2.1. Thalassemia Therapy
- 7.2.2. Sickle Cell Disease(SCD) Therapy
- 7.2.3. Other Therapy
- 7.1. Market Analysis, Insights and Forecast - by Application
- 8. Europe Hemoglobinopathies Drugs Analysis, Insights and Forecast, 2019-2031
- 8.1. Market Analysis, Insights and Forecast - by Application
- 8.1.1. Alpha Thalassemia
- 8.1.2. Beta thalassemia
- 8.1.3. Sickle Cell Disease
- 8.1.4. Hb Variants Diseases
- 8.2. Market Analysis, Insights and Forecast - by Types
- 8.2.1. Thalassemia Therapy
- 8.2.2. Sickle Cell Disease(SCD) Therapy
- 8.2.3. Other Therapy
- 8.1. Market Analysis, Insights and Forecast - by Application
- 9. Middle East & Africa Hemoglobinopathies Drugs Analysis, Insights and Forecast, 2019-2031
- 9.1. Market Analysis, Insights and Forecast - by Application
- 9.1.1. Alpha Thalassemia
- 9.1.2. Beta thalassemia
- 9.1.3. Sickle Cell Disease
- 9.1.4. Hb Variants Diseases
- 9.2. Market Analysis, Insights and Forecast - by Types
- 9.2.1. Thalassemia Therapy
- 9.2.2. Sickle Cell Disease(SCD) Therapy
- 9.2.3. Other Therapy
- 9.1. Market Analysis, Insights and Forecast - by Application
- 10. Asia Pacific Hemoglobinopathies Drugs Analysis, Insights and Forecast, 2019-2031
- 10.1. Market Analysis, Insights and Forecast - by Application
- 10.1.1. Alpha Thalassemia
- 10.1.2. Beta thalassemia
- 10.1.3. Sickle Cell Disease
- 10.1.4. Hb Variants Diseases
- 10.2. Market Analysis, Insights and Forecast - by Types
- 10.2.1. Thalassemia Therapy
- 10.2.2. Sickle Cell Disease(SCD) Therapy
- 10.2.3. Other Therapy
- 10.1. Market Analysis, Insights and Forecast - by Application
- 11. Competitive Analysis
- 11.1. Global Market Share Analysis 2024
- 11.2. Company Profiles
- 11.2.1 Gamida Cell
- 11.2.1.1. Overview
- 11.2.1.2. Products
- 11.2.1.3. SWOT Analysis
- 11.2.1.4. Recent Developments
- 11.2.1.5. Financials (Based on Availability)
- 11.2.2 Alnylam Pharmaceuticals
- 11.2.2.1. Overview
- 11.2.2.2. Products
- 11.2.2.3. SWOT Analysis
- 11.2.2.4. Recent Developments
- 11.2.2.5. Financials (Based on Availability)
- 11.2.3 Biogen Idec
- 11.2.3.1. Overview
- 11.2.3.2. Products
- 11.2.3.3. SWOT Analysis
- 11.2.3.4. Recent Developments
- 11.2.3.5. Financials (Based on Availability)
- 11.2.4 Sangamo BioSciences Inc.
- 11.2.4.1. Overview
- 11.2.4.2. Products
- 11.2.4.3. SWOT Analysis
- 11.2.4.4. Recent Developments
- 11.2.4.5. Financials (Based on Availability)
- 11.2.5 Genetix Pharmaceuticals/Bluebird Bio
- 11.2.5.1. Overview
- 11.2.5.2. Products
- 11.2.5.3. SWOT Analysis
- 11.2.5.4. Recent Developments
- 11.2.5.5. Financials (Based on Availability)
- 11.2.6 Global Blood Therapeutics Inc.
- 11.2.6.1. Overview
- 11.2.6.2. Products
- 11.2.6.3. SWOT Analysis
- 11.2.6.4. Recent Developments
- 11.2.6.5. Financials (Based on Availability)
- 11.2.7 Pfizer Inc.
- 11.2.7.1. Overview
- 11.2.7.2. Products
- 11.2.7.3. SWOT Analysis
- 11.2.7.4. Recent Developments
- 11.2.7.5. Financials (Based on Availability)
- 11.2.8 Mast Therapeutics
- 11.2.8.1. Overview
- 11.2.8.2. Products
- 11.2.8.3. SWOT Analysis
- 11.2.8.4. Recent Developments
- 11.2.8.5. Financials (Based on Availability)
- 11.2.9 Emmaus Life Sciences
- 11.2.9.1. Overview
- 11.2.9.2. Products
- 11.2.9.3. SWOT Analysis
- 11.2.9.4. Recent Developments
- 11.2.9.5. Financials (Based on Availability)
- 11.2.10 Inc.
- 11.2.10.1. Overview
- 11.2.10.2. Products
- 11.2.10.3. SWOT Analysis
- 11.2.10.4. Recent Developments
- 11.2.10.5. Financials (Based on Availability)
- 11.2.11 Prolong Pharmaceuticals
- 11.2.11.1. Overview
- 11.2.11.2. Products
- 11.2.11.3. SWOT Analysis
- 11.2.11.4. Recent Developments
- 11.2.11.5. Financials (Based on Availability)
- 11.2.12 Celgene Corporation
- 11.2.12.1. Overview
- 11.2.12.2. Products
- 11.2.12.3. SWOT Analysis
- 11.2.12.4. Recent Developments
- 11.2.12.5. Financials (Based on Availability)
- 11.2.13 HemaQuest Pharmaceuticals
- 11.2.13.1. Overview
- 11.2.13.2. Products
- 11.2.13.3. SWOT Analysis
- 11.2.13.4. Recent Developments
- 11.2.13.5. Financials (Based on Availability)
- 11.2.1 Gamida Cell
List of Figures
- Figure 1: Global Hemoglobinopathies Drugs Revenue Breakdown (million, %) by Region 2024 & 2032
- Figure 2: North America Hemoglobinopathies Drugs Revenue (million), by Application 2024 & 2032
- Figure 3: North America Hemoglobinopathies Drugs Revenue Share (%), by Application 2024 & 2032
- Figure 4: North America Hemoglobinopathies Drugs Revenue (million), by Types 2024 & 2032
- Figure 5: North America Hemoglobinopathies Drugs Revenue Share (%), by Types 2024 & 2032
- Figure 6: North America Hemoglobinopathies Drugs Revenue (million), by Country 2024 & 2032
- Figure 7: North America Hemoglobinopathies Drugs Revenue Share (%), by Country 2024 & 2032
- Figure 8: South America Hemoglobinopathies Drugs Revenue (million), by Application 2024 & 2032
- Figure 9: South America Hemoglobinopathies Drugs Revenue Share (%), by Application 2024 & 2032
- Figure 10: South America Hemoglobinopathies Drugs Revenue (million), by Types 2024 & 2032
- Figure 11: South America Hemoglobinopathies Drugs Revenue Share (%), by Types 2024 & 2032
- Figure 12: South America Hemoglobinopathies Drugs Revenue (million), by Country 2024 & 2032
- Figure 13: South America Hemoglobinopathies Drugs Revenue Share (%), by Country 2024 & 2032
- Figure 14: Europe Hemoglobinopathies Drugs Revenue (million), by Application 2024 & 2032
- Figure 15: Europe Hemoglobinopathies Drugs Revenue Share (%), by Application 2024 & 2032
- Figure 16: Europe Hemoglobinopathies Drugs Revenue (million), by Types 2024 & 2032
- Figure 17: Europe Hemoglobinopathies Drugs Revenue Share (%), by Types 2024 & 2032
- Figure 18: Europe Hemoglobinopathies Drugs Revenue (million), by Country 2024 & 2032
- Figure 19: Europe Hemoglobinopathies Drugs Revenue Share (%), by Country 2024 & 2032
- Figure 20: Middle East & Africa Hemoglobinopathies Drugs Revenue (million), by Application 2024 & 2032
- Figure 21: Middle East & Africa Hemoglobinopathies Drugs Revenue Share (%), by Application 2024 & 2032
- Figure 22: Middle East & Africa Hemoglobinopathies Drugs Revenue (million), by Types 2024 & 2032
- Figure 23: Middle East & Africa Hemoglobinopathies Drugs Revenue Share (%), by Types 2024 & 2032
- Figure 24: Middle East & Africa Hemoglobinopathies Drugs Revenue (million), by Country 2024 & 2032
- Figure 25: Middle East & Africa Hemoglobinopathies Drugs Revenue Share (%), by Country 2024 & 2032
- Figure 26: Asia Pacific Hemoglobinopathies Drugs Revenue (million), by Application 2024 & 2032
- Figure 27: Asia Pacific Hemoglobinopathies Drugs Revenue Share (%), by Application 2024 & 2032
- Figure 28: Asia Pacific Hemoglobinopathies Drugs Revenue (million), by Types 2024 & 2032
- Figure 29: Asia Pacific Hemoglobinopathies Drugs Revenue Share (%), by Types 2024 & 2032
- Figure 30: Asia Pacific Hemoglobinopathies Drugs Revenue (million), by Country 2024 & 2032
- Figure 31: Asia Pacific Hemoglobinopathies Drugs Revenue Share (%), by Country 2024 & 2032
List of Tables
- Table 1: Global Hemoglobinopathies Drugs Revenue million Forecast, by Region 2019 & 2032
- Table 2: Global Hemoglobinopathies Drugs Revenue million Forecast, by Application 2019 & 2032
- Table 3: Global Hemoglobinopathies Drugs Revenue million Forecast, by Types 2019 & 2032
- Table 4: Global Hemoglobinopathies Drugs Revenue million Forecast, by Region 2019 & 2032
- Table 5: Global Hemoglobinopathies Drugs Revenue million Forecast, by Application 2019 & 2032
- Table 6: Global Hemoglobinopathies Drugs Revenue million Forecast, by Types 2019 & 2032
- Table 7: Global Hemoglobinopathies Drugs Revenue million Forecast, by Country 2019 & 2032
- Table 8: United States Hemoglobinopathies Drugs Revenue (million) Forecast, by Application 2019 & 2032
- Table 9: Canada Hemoglobinopathies Drugs Revenue (million) Forecast, by Application 2019 & 2032
- Table 10: Mexico Hemoglobinopathies Drugs Revenue (million) Forecast, by Application 2019 & 2032
- Table 11: Global Hemoglobinopathies Drugs Revenue million Forecast, by Application 2019 & 2032
- Table 12: Global Hemoglobinopathies Drugs Revenue million Forecast, by Types 2019 & 2032
- Table 13: Global Hemoglobinopathies Drugs Revenue million Forecast, by Country 2019 & 2032
- Table 14: Brazil Hemoglobinopathies Drugs Revenue (million) Forecast, by Application 2019 & 2032
- Table 15: Argentina Hemoglobinopathies Drugs Revenue (million) Forecast, by Application 2019 & 2032
- Table 16: Rest of South America Hemoglobinopathies Drugs Revenue (million) Forecast, by Application 2019 & 2032
- Table 17: Global Hemoglobinopathies Drugs Revenue million Forecast, by Application 2019 & 2032
- Table 18: Global Hemoglobinopathies Drugs Revenue million Forecast, by Types 2019 & 2032
- Table 19: Global Hemoglobinopathies Drugs Revenue million Forecast, by Country 2019 & 2032
- Table 20: United Kingdom Hemoglobinopathies Drugs Revenue (million) Forecast, by Application 2019 & 2032
- Table 21: Germany Hemoglobinopathies Drugs Revenue (million) Forecast, by Application 2019 & 2032
- Table 22: France Hemoglobinopathies Drugs Revenue (million) Forecast, by Application 2019 & 2032
- Table 23: Italy Hemoglobinopathies Drugs Revenue (million) Forecast, by Application 2019 & 2032
- Table 24: Spain Hemoglobinopathies Drugs Revenue (million) Forecast, by Application 2019 & 2032
- Table 25: Russia Hemoglobinopathies Drugs Revenue (million) Forecast, by Application 2019 & 2032
- Table 26: Benelux Hemoglobinopathies Drugs Revenue (million) Forecast, by Application 2019 & 2032
- Table 27: Nordics Hemoglobinopathies Drugs Revenue (million) Forecast, by Application 2019 & 2032
- Table 28: Rest of Europe Hemoglobinopathies Drugs Revenue (million) Forecast, by Application 2019 & 2032
- Table 29: Global Hemoglobinopathies Drugs Revenue million Forecast, by Application 2019 & 2032
- Table 30: Global Hemoglobinopathies Drugs Revenue million Forecast, by Types 2019 & 2032
- Table 31: Global Hemoglobinopathies Drugs Revenue million Forecast, by Country 2019 & 2032
- Table 32: Turkey Hemoglobinopathies Drugs Revenue (million) Forecast, by Application 2019 & 2032
- Table 33: Israel Hemoglobinopathies Drugs Revenue (million) Forecast, by Application 2019 & 2032
- Table 34: GCC Hemoglobinopathies Drugs Revenue (million) Forecast, by Application 2019 & 2032
- Table 35: North Africa Hemoglobinopathies Drugs Revenue (million) Forecast, by Application 2019 & 2032
- Table 36: South Africa Hemoglobinopathies Drugs Revenue (million) Forecast, by Application 2019 & 2032
- Table 37: Rest of Middle East & Africa Hemoglobinopathies Drugs Revenue (million) Forecast, by Application 2019 & 2032
- Table 38: Global Hemoglobinopathies Drugs Revenue million Forecast, by Application 2019 & 2032
- Table 39: Global Hemoglobinopathies Drugs Revenue million Forecast, by Types 2019 & 2032
- Table 40: Global Hemoglobinopathies Drugs Revenue million Forecast, by Country 2019 & 2032
- Table 41: China Hemoglobinopathies Drugs Revenue (million) Forecast, by Application 2019 & 2032
- Table 42: India Hemoglobinopathies Drugs Revenue (million) Forecast, by Application 2019 & 2032
- Table 43: Japan Hemoglobinopathies Drugs Revenue (million) Forecast, by Application 2019 & 2032
- Table 44: South Korea Hemoglobinopathies Drugs Revenue (million) Forecast, by Application 2019 & 2032
- Table 45: ASEAN Hemoglobinopathies Drugs Revenue (million) Forecast, by Application 2019 & 2032
- Table 46: Oceania Hemoglobinopathies Drugs Revenue (million) Forecast, by Application 2019 & 2032
- Table 47: Rest of Asia Pacific Hemoglobinopathies Drugs Revenue (million) Forecast, by Application 2019 & 2032
Frequently Asked Questions
1. What is the projected Compound Annual Growth Rate (CAGR) of the Hemoglobinopathies Drugs?
The projected CAGR is approximately XX%.
2. Which companies are prominent players in the Hemoglobinopathies Drugs?
Key companies in the market include Gamida Cell, Alnylam Pharmaceuticals, Biogen Idec, Sangamo BioSciences Inc., Genetix Pharmaceuticals/Bluebird Bio, Global Blood Therapeutics Inc., Pfizer Inc., Mast Therapeutics, Emmaus Life Sciences, Inc., Prolong Pharmaceuticals, Celgene Corporation, HemaQuest Pharmaceuticals.
3. What are the main segments of the Hemoglobinopathies Drugs?
The market segments include Application, Types.
4. Can you provide details about the market size?
The market size is estimated to be USD XXX million as of 2022.
5. What are some drivers contributing to market growth?
N/A
6. What are the notable trends driving market growth?
N/A
7. Are there any restraints impacting market growth?
N/A
8. Can you provide examples of recent developments in the market?
N/A
9. What pricing options are available for accessing the report?
Pricing options include single-user, multi-user, and enterprise licenses priced at USD 4900.00, USD 7350.00, and USD 9800.00 respectively.
10. Is the market size provided in terms of value or volume?
The market size is provided in terms of value, measured in million.
11. Are there any specific market keywords associated with the report?
Yes, the market keyword associated with the report is "Hemoglobinopathies Drugs," which aids in identifying and referencing the specific market segment covered.
12. How do I determine which pricing option suits my needs best?
The pricing options vary based on user requirements and access needs. Individual users may opt for single-user licenses, while businesses requiring broader access may choose multi-user or enterprise licenses for cost-effective access to the report.
13. Are there any additional resources or data provided in the Hemoglobinopathies Drugs report?
While the report offers comprehensive insights, it's advisable to review the specific contents or supplementary materials provided to ascertain if additional resources or data are available.
14. How can I stay updated on further developments or reports in the Hemoglobinopathies Drugs?
To stay informed about further developments, trends, and reports in the Hemoglobinopathies Drugs, consider subscribing to industry newsletters, following relevant companies and organizations, or regularly checking reputable industry news sources and publications.
Methodology
Step 1 - Identification of Relevant Samples Size from Population Database


Step 2 - Approaches for Defining Global Market Size (Value, Volume* & Price*)

Note*: In applicable scenarios
Step 3 - Data Sources
Primary Research
- Web Analytics
- Survey Reports
- Research Institute
- Latest Research Reports
- Opinion Leaders
Secondary Research
- Annual Reports
- White Paper
- Latest Press Release
- Industry Association
- Paid Database
- Investor Presentations

Step 4 - Data Triangulation
Involves using different sources of information in order to increase the validity of a study
These sources are likely to be stakeholders in a program - participants, other researchers, program staff, other community members, and so on.
Then we put all data in single framework & apply various statistical tools to find out the dynamic on the market.
During the analysis stage, feedback from the stakeholder groups would be compared to determine areas of agreement as well as areas of divergence
