

Key Insights
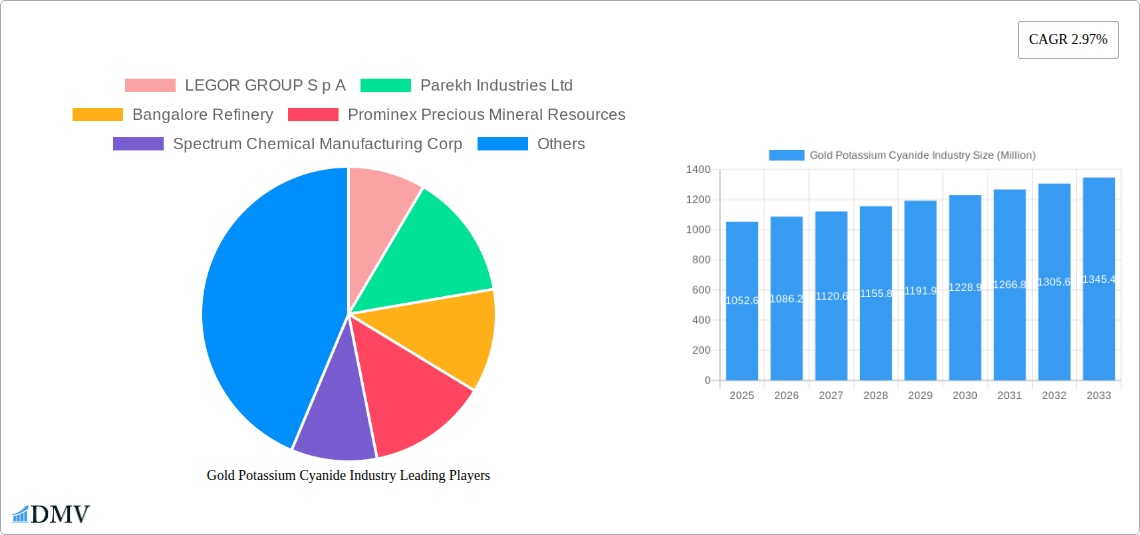
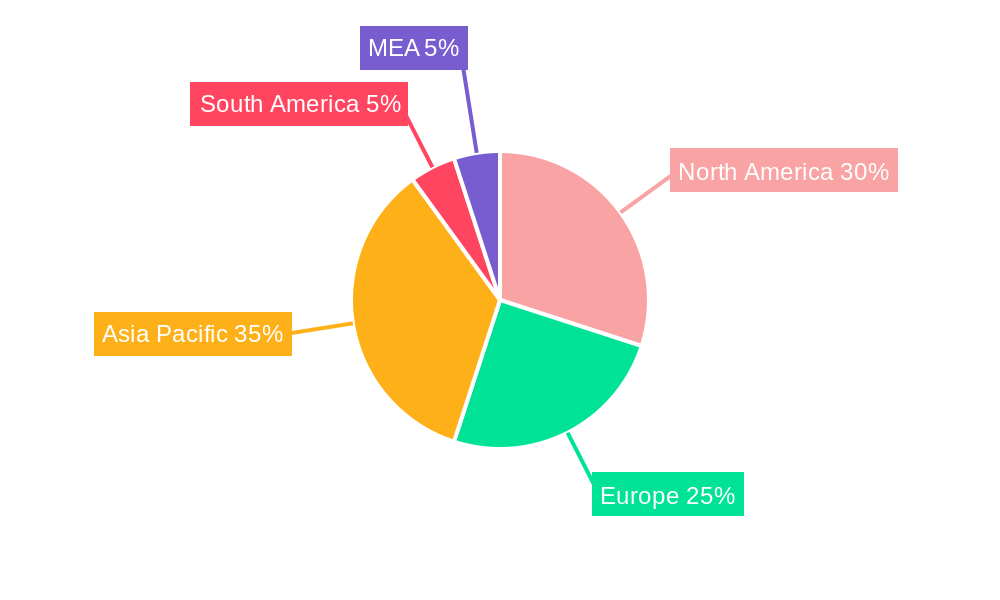
The global gold potassium cyanide market, valued at $1052.6 million in 2025, is projected to experience steady growth, driven by its crucial role in the electroplating industry, particularly for jewelry and electronic components. The market's Compound Annual Growth Rate (CAGR) of 2.97% from 2019 to 2024 suggests a consistent, albeit moderate, expansion. Key drivers include the increasing demand for gold-plated jewelry, the proliferation of electronic devices requiring gold plating for conductivity and durability, and the continuous innovation in electroplating techniques that improve efficiency and reduce environmental impact. However, stringent environmental regulations regarding cyanide usage and the availability of alternative plating solutions pose significant restraints on market growth. The market is segmented by purity (low and high) and application (electroplating of metals, decorative costume jewelry, electronic devices, watches, and other applications). High-purity gold potassium cyanide commands a premium price due to its superior performance in demanding applications. The geographical distribution showcases a diverse landscape, with North America and Asia-Pacific emerging as prominent regions due to substantial manufacturing and consumption of gold-plated products. The established players, including LEGOR Group S.p.A, Parekh Industries Ltd, and Umicore Electroplating, hold significant market share, while smaller companies cater to niche applications. The forecast period of 2025-2033 anticipates continued growth, albeit at a pace influenced by economic conditions and evolving technological advancements.
The forecast for 2026-2033 projects continued expansion, albeit at a rate influenced by global economic trends and technological advancements. The introduction of more sustainable electroplating methods and stricter environmental regulations will likely shape the market's trajectory. While the high-purity segment is expected to retain its premium positioning, the low-purity segment may experience growth driven by cost-sensitive applications. Regional variations will continue to be influenced by economic growth and industry-specific regulations, with Asia-Pacific likely maintaining its strong position due to its large manufacturing base. Further research into alternative plating technologies could eventually influence market dynamics, though gold potassium cyanide's established role in electroplating ensures its continued relevance for the foreseeable future.
Gold Potassium Cyanide Industry: A Comprehensive Market Report (2019-2033)
This insightful report provides a comprehensive analysis of the Gold Potassium Cyanide industry, offering invaluable insights for stakeholders seeking to navigate this dynamic market. Covering the period from 2019 to 2033, with a base year of 2025 and a forecast period spanning 2025-2033, this report delves into market composition, industry evolution, leading players, and future opportunities. The global market value is estimated at xx Million in 2025 and is projected to reach xx Million by 2033.
Gold Potassium Cyanide Industry Market Composition & Trends
This section evaluates the competitive landscape, innovation drivers, regulatory environment, and market dynamics within the Gold Potassium Cyanide industry. We analyze market concentration, revealing the market share distribution among key players, including LEGOR GROUP S p A, Parekh Industries Ltd, Bangalore Refinery, Prominex Precious Mineral Resources, Spectrum Chemical Manufacturing Corp, Umicore Electroplating, Innova Corporate, Alfa Aesar Thermo Fisher Scientific, Mahavir Expochem Ltd, and METALOR Technologies SA. The report further examines the impact of mergers and acquisitions (M&A) activities, detailing significant deals and their influence on market consolidation. The analysis considers the prevalence of substitute products and their potential impact on market share. Finally, we explore the diverse end-user profiles, highlighting key application segments and their growth trajectories. The estimated total value of M&A deals within the industry during the study period (2019-2024) is approximately xx Million.
- Market Concentration: A detailed breakdown of market share held by each major player.
- Innovation Catalysts: Analysis of technological advancements and their impact on market growth.
- Regulatory Landscape: Assessment of existing and upcoming regulations impacting the industry.
- Substitute Products: Evaluation of alternative materials and their competitive threats.
- End-User Profiles: Detailed segmentation of end-users across various applications.
- M&A Activities: Review of significant mergers and acquisitions, including deal values and strategic implications.
Gold Potassium Cyanide Industry Industry Evolution
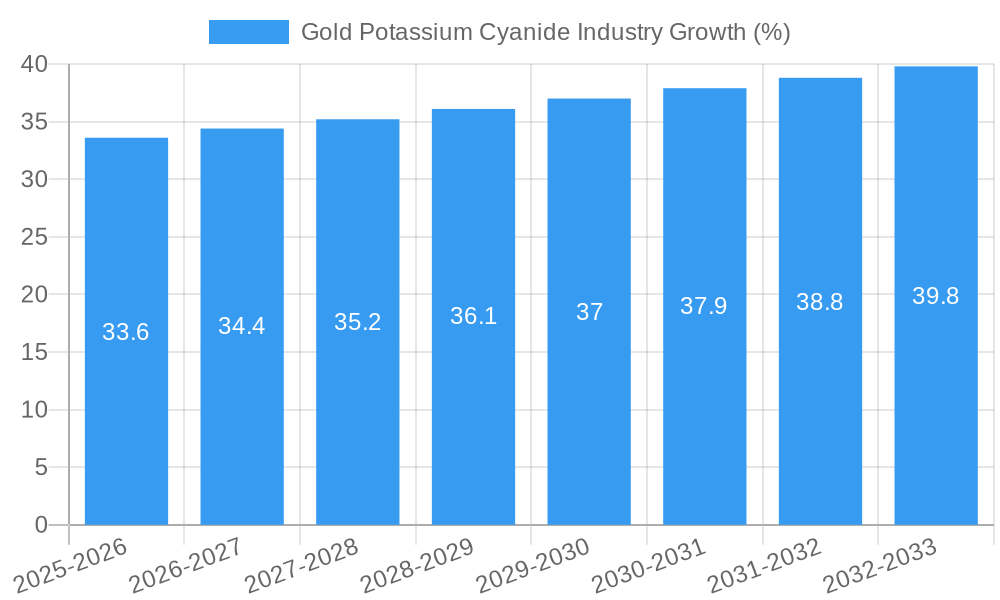
This section provides a comprehensive analysis of the Gold Potassium Cyanide industry's historical and projected growth trajectories. We examine the market's evolution from 2019 to 2024, highlighting key milestones and shifts in market dynamics. Technological advancements, such as improvements in production processes and the development of more efficient and sustainable alternatives, are examined in detail. The report also analyzes the changing consumer demands and their impact on product development and market segmentation. We present data on Compound Annual Growth Rate (CAGR) for the historical and forecast periods, offering quantitative insights into market expansion. Specific attention is given to the growing demand for high-purity gold potassium cyanide in key application areas, driving increased investment and innovation within the sector. The CAGR for the historical period (2019-2024) is estimated to be xx%, while the projected CAGR for the forecast period (2025-2033) is xx%.
Leading Regions, Countries, or Segments in Gold Potassium Cyanide Industry
This section identifies the dominant regions, countries, and segments within the Gold Potassium Cyanide market. We analyze the factors driving the success of leading segments, including the type of gold potassium cyanide (low purity and high purity) and its primary applications (electroplating of metals, decorative costume jewelry, electronic devices, watches, and other applications).
Key Drivers for Dominant Segments:
- Investment Trends: Analysis of investment patterns in leading regions and segments.
- Regulatory Support: Evaluation of government policies and incentives promoting growth.
- Market Access: Assessment of ease of market entry and distribution channels.
- Technological Advancements: Identification of key technological factors enabling market dominance.
In-depth Analysis of Dominance Factors: This section provides a detailed explanation of the reasons behind the dominance of specific regions, countries, or segments, supported by data and market insights.
Gold Potassium Cyanide Industry Product Innovations
Recent innovations in gold potassium cyanide production focus on enhancing purity, improving yield, and reducing environmental impact. New formulations aim to minimize waste and improve safety during handling and application. These advancements extend the lifespan of products and enhance performance across key applications like electroplating. Unique selling propositions often center on improved efficiency, reduced toxicity, and enhanced environmental sustainability.
Propelling Factors for Gold Potassium Cyanide Industry Growth
Several factors are driving growth in the Gold Potassium Cyanide industry. Increasing demand from the electronics and jewelry sectors, fueled by global economic expansion and rising consumer spending, is a major driver. Technological advancements in production methods lead to cost reductions and improved product quality. Furthermore, supportive government regulations and policies in certain regions are fostering industry growth.
Obstacles in the Gold Potassium Cyanide Industry Market
The Gold Potassium Cyanide industry faces challenges, including stringent environmental regulations that increase production costs and limit expansion. Fluctuations in raw material prices and supply chain disruptions can also impact profitability. Intense competition among established players further complicates market dynamics, and the inherent toxicity of the compound necessitates strict safety protocols, adding to operational costs. These challenges combined could represent a loss of xx Million annually.
Future Opportunities in Gold Potassium Cyanide Industry
Future opportunities lie in exploring new applications for gold potassium cyanide in emerging technologies like advanced electronics and specialized coatings. Investments in research and development to create more sustainable and environmentally friendly production processes could also unlock significant market potential. Furthermore, expansion into new geographic markets with growing demand for the compound represents a key area for future growth.
Major Players in the Gold Potassium Cyanide Industry Ecosystem
- LEGOR GROUP S p A
- Parekh Industries Ltd
- Bangalore Refinery
- Prominex Precious Mineral Resources
- Spectrum Chemical Manufacturing Corp
- Umicore Electroplating
- Innova Corporate
- Alfa Aesar Thermo Fisher Scientific
- Mahavir Expochem Ltd
- METALOR Technologies SA
Key Developments in Gold Potassium Cyanide Industry Industry
- November 2022: Besra Gold Inc. and Quantum Metals Recovery Inc. announced a USD 300 Million agreement for gold offtake, boosting exploration and development.
- March 2022: Spectrum Chemical launched 12 new bioCERTIFIED products, expanding its biopharmaceutical manufacturing portfolio.
Strategic Gold Potassium Cyanide Industry Market Forecast
The Gold Potassium Cyanide market is poised for significant growth, driven by technological advancements, increasing demand from key sectors, and strategic investments. Opportunities in emerging applications and sustainable production methods will further shape market dynamics. The forecast suggests strong potential for market expansion across various regions, presenting promising avenues for industry players.
Gold Potassium Cyanide Industry Segmentation
-
1. Type
- 1.1. Low Purity
- 1.2. High Purity
-
2. Applications
- 2.1. Electroplating of Metals
- 2.2. Decorative Costume Jewellery
- 2.3. Electronic Devices
- 2.4. Watches
- 2.5. Other Applications
Gold Potassium Cyanide Industry Segmentation By Geography
-
1. Asia Pacific
- 1.1. China
- 1.2. India
- 1.3. Japan
- 1.4. South Korea
- 1.5. Rest of Asia Pacific
-
2. North America
- 2.1. United States
- 2.2. Canada
- 2.3. Mexico
-
3. Europe
- 3.1. Germany
- 3.2. United Kingdom
- 3.3. France
- 3.4. Italy
- 3.5. Rest of Europe
-
4. South America
- 4.1. Brazil
- 4.2. Argentina
- 4.3. Rest of South America
-
5. Middle East and Africa
- 5.1. Saudi Arabia
- 5.2. South Africa
- 5.3. Rest of Middle East and Africa
Gold Potassium Cyanide Industry REPORT HIGHLIGHTS
| Aspects | Details |
|---|---|
| Study Period | 2019-2033 |
| Base Year | 2024 |
| Estimated Year | 2025 |
| Forecast Period | 2025-2033 |
| Historical Period | 2019-2024 |
| Growth Rate | CAGR of 2.97% from 2019-2033 |
| Segmentation |
|
Table of Contents
- 1. Introduction
- 1.1. Research Scope
- 1.2. Market Segmentation
- 1.3. Research Methodology
- 1.4. Definitions and Assumptions
- 2. Executive Summary
- 2.1. Introduction
- 3. Market Dynamics
- 3.1. Introduction
- 3.2. Market Drivers
- 3.2.1. Increasing Applications for Electroplating of Gold; Growing Demand from the Electronics Industry
- 3.3. Market Restrains
- 3.3.1. High Toxic Nature and Impact of COVID-19 Pandemic; Other Restraints
- 3.4. Market Trends
- 3.4.1. Growing Demand from Electronics and Metal Plating Industries
- 4. Market Factor Analysis
- 4.1. Porters Five Forces
- 4.2. Supply/Value Chain
- 4.3. PESTEL analysis
- 4.4. Market Entropy
- 4.5. Patent/Trademark Analysis
- 5. Global Gold Potassium Cyanide Industry Analysis, Insights and Forecast, 2019-2031
- 5.1. Market Analysis, Insights and Forecast - by Type
- 5.1.1. Low Purity
- 5.1.2. High Purity
- 5.2. Market Analysis, Insights and Forecast - by Applications
- 5.2.1. Electroplating of Metals
- 5.2.2. Decorative Costume Jewellery
- 5.2.3. Electronic Devices
- 5.2.4. Watches
- 5.2.5. Other Applications
- 5.3. Market Analysis, Insights and Forecast - by Region
- 5.3.1. Asia Pacific
- 5.3.2. North America
- 5.3.3. Europe
- 5.3.4. South America
- 5.3.5. Middle East and Africa
- 5.1. Market Analysis, Insights and Forecast - by Type
- 6. Asia Pacific Gold Potassium Cyanide Industry Analysis, Insights and Forecast, 2019-2031
- 6.1. Market Analysis, Insights and Forecast - by Type
- 6.1.1. Low Purity
- 6.1.2. High Purity
- 6.2. Market Analysis, Insights and Forecast - by Applications
- 6.2.1. Electroplating of Metals
- 6.2.2. Decorative Costume Jewellery
- 6.2.3. Electronic Devices
- 6.2.4. Watches
- 6.2.5. Other Applications
- 6.1. Market Analysis, Insights and Forecast - by Type
- 7. North America Gold Potassium Cyanide Industry Analysis, Insights and Forecast, 2019-2031
- 7.1. Market Analysis, Insights and Forecast - by Type
- 7.1.1. Low Purity
- 7.1.2. High Purity
- 7.2. Market Analysis, Insights and Forecast - by Applications
- 7.2.1. Electroplating of Metals
- 7.2.2. Decorative Costume Jewellery
- 7.2.3. Electronic Devices
- 7.2.4. Watches
- 7.2.5. Other Applications
- 7.1. Market Analysis, Insights and Forecast - by Type
- 8. Europe Gold Potassium Cyanide Industry Analysis, Insights and Forecast, 2019-2031
- 8.1. Market Analysis, Insights and Forecast - by Type
- 8.1.1. Low Purity
- 8.1.2. High Purity
- 8.2. Market Analysis, Insights and Forecast - by Applications
- 8.2.1. Electroplating of Metals
- 8.2.2. Decorative Costume Jewellery
- 8.2.3. Electronic Devices
- 8.2.4. Watches
- 8.2.5. Other Applications
- 8.1. Market Analysis, Insights and Forecast - by Type
- 9. South America Gold Potassium Cyanide Industry Analysis, Insights and Forecast, 2019-2031
- 9.1. Market Analysis, Insights and Forecast - by Type
- 9.1.1. Low Purity
- 9.1.2. High Purity
- 9.2. Market Analysis, Insights and Forecast - by Applications
- 9.2.1. Electroplating of Metals
- 9.2.2. Decorative Costume Jewellery
- 9.2.3. Electronic Devices
- 9.2.4. Watches
- 9.2.5. Other Applications
- 9.1. Market Analysis, Insights and Forecast - by Type
- 10. Middle East and Africa Gold Potassium Cyanide Industry Analysis, Insights and Forecast, 2019-2031
- 10.1. Market Analysis, Insights and Forecast - by Type
- 10.1.1. Low Purity
- 10.1.2. High Purity
- 10.2. Market Analysis, Insights and Forecast - by Applications
- 10.2.1. Electroplating of Metals
- 10.2.2. Decorative Costume Jewellery
- 10.2.3. Electronic Devices
- 10.2.4. Watches
- 10.2.5. Other Applications
- 10.1. Market Analysis, Insights and Forecast - by Type
- 11. North America Gold Potassium Cyanide Industry Analysis, Insights and Forecast, 2019-2031
- 11.1. Market Analysis, Insights and Forecast - By Country/Sub-region
- 11.1.1 United States
- 11.1.2 Canada
- 11.1.3 Mexico
- 12. Europe Gold Potassium Cyanide Industry Analysis, Insights and Forecast, 2019-2031
- 12.1. Market Analysis, Insights and Forecast - By Country/Sub-region
- 12.1.1 Germany
- 12.1.2 France
- 12.1.3 Italy
- 12.1.4 United Kingdom
- 12.1.5 Netherlands
- 12.1.6 Rest of Europe
- 13. Asia Pacific Gold Potassium Cyanide Industry Analysis, Insights and Forecast, 2019-2031
- 13.1. Market Analysis, Insights and Forecast - By Country/Sub-region
- 13.1.1 China
- 13.1.2 Japan
- 13.1.3 India
- 13.1.4 South Korea
- 13.1.5 Taiwan
- 13.1.6 Australia
- 13.1.7 Rest of Asia-Pacific
- 14. South America Gold Potassium Cyanide Industry Analysis, Insights and Forecast, 2019-2031
- 14.1. Market Analysis, Insights and Forecast - By Country/Sub-region
- 14.1.1 Brazil
- 14.1.2 Argentina
- 14.1.3 Rest of South America
- 15. MEA Gold Potassium Cyanide Industry Analysis, Insights and Forecast, 2019-2031
- 15.1. Market Analysis, Insights and Forecast - By Country/Sub-region
- 15.1.1 Middle East
- 15.1.2 Africa
- 16. Competitive Analysis
- 16.1. Global Market Share Analysis 2024
- 16.2. Company Profiles
- 16.2.1 LEGOR GROUP S p A
- 16.2.1.1. Overview
- 16.2.1.2. Products
- 16.2.1.3. SWOT Analysis
- 16.2.1.4. Recent Developments
- 16.2.1.5. Financials (Based on Availability)
- 16.2.2 Parekh Industries Ltd
- 16.2.2.1. Overview
- 16.2.2.2. Products
- 16.2.2.3. SWOT Analysis
- 16.2.2.4. Recent Developments
- 16.2.2.5. Financials (Based on Availability)
- 16.2.3 Bangalore Refinery
- 16.2.3.1. Overview
- 16.2.3.2. Products
- 16.2.3.3. SWOT Analysis
- 16.2.3.4. Recent Developments
- 16.2.3.5. Financials (Based on Availability)
- 16.2.4 Prominex Precious Mineral Resources
- 16.2.4.1. Overview
- 16.2.4.2. Products
- 16.2.4.3. SWOT Analysis
- 16.2.4.4. Recent Developments
- 16.2.4.5. Financials (Based on Availability)
- 16.2.5 Spectrum Chemical Manufacturing Corp
- 16.2.5.1. Overview
- 16.2.5.2. Products
- 16.2.5.3. SWOT Analysis
- 16.2.5.4. Recent Developments
- 16.2.5.5. Financials (Based on Availability)
- 16.2.6 Umicore Electroplating
- 16.2.6.1. Overview
- 16.2.6.2. Products
- 16.2.6.3. SWOT Analysis
- 16.2.6.4. Recent Developments
- 16.2.6.5. Financials (Based on Availability)
- 16.2.7 Innova Corporate
- 16.2.7.1. Overview
- 16.2.7.2. Products
- 16.2.7.3. SWOT Analysis
- 16.2.7.4. Recent Developments
- 16.2.7.5. Financials (Based on Availability)
- 16.2.8 Alfa Aesar Thermo Fisher Scientific
- 16.2.8.1. Overview
- 16.2.8.2. Products
- 16.2.8.3. SWOT Analysis
- 16.2.8.4. Recent Developments
- 16.2.8.5. Financials (Based on Availability)
- 16.2.9 Mahavir Expochem Ltd
- 16.2.9.1. Overview
- 16.2.9.2. Products
- 16.2.9.3. SWOT Analysis
- 16.2.9.4. Recent Developments
- 16.2.9.5. Financials (Based on Availability)
- 16.2.10 METALOR Technologies SA
- 16.2.10.1. Overview
- 16.2.10.2. Products
- 16.2.10.3. SWOT Analysis
- 16.2.10.4. Recent Developments
- 16.2.10.5. Financials (Based on Availability)
- 16.2.1 LEGOR GROUP S p A
List of Figures
- Figure 1: Global Gold Potassium Cyanide Industry Revenue Breakdown (Million, %) by Region 2024 & 2032
- Figure 2: Global Gold Potassium Cyanide Industry Volume Breakdown (K Tons, %) by Region 2024 & 2032
- Figure 3: North America Gold Potassium Cyanide Industry Revenue (Million), by Country 2024 & 2032
- Figure 4: North America Gold Potassium Cyanide Industry Volume (K Tons), by Country 2024 & 2032
- Figure 5: North America Gold Potassium Cyanide Industry Revenue Share (%), by Country 2024 & 2032
- Figure 6: North America Gold Potassium Cyanide Industry Volume Share (%), by Country 2024 & 2032
- Figure 7: Europe Gold Potassium Cyanide Industry Revenue (Million), by Country 2024 & 2032
- Figure 8: Europe Gold Potassium Cyanide Industry Volume (K Tons), by Country 2024 & 2032
- Figure 9: Europe Gold Potassium Cyanide Industry Revenue Share (%), by Country 2024 & 2032
- Figure 10: Europe Gold Potassium Cyanide Industry Volume Share (%), by Country 2024 & 2032
- Figure 11: Asia Pacific Gold Potassium Cyanide Industry Revenue (Million), by Country 2024 & 2032
- Figure 12: Asia Pacific Gold Potassium Cyanide Industry Volume (K Tons), by Country 2024 & 2032
- Figure 13: Asia Pacific Gold Potassium Cyanide Industry Revenue Share (%), by Country 2024 & 2032
- Figure 14: Asia Pacific Gold Potassium Cyanide Industry Volume Share (%), by Country 2024 & 2032
- Figure 15: South America Gold Potassium Cyanide Industry Revenue (Million), by Country 2024 & 2032
- Figure 16: South America Gold Potassium Cyanide Industry Volume (K Tons), by Country 2024 & 2032
- Figure 17: South America Gold Potassium Cyanide Industry Revenue Share (%), by Country 2024 & 2032
- Figure 18: South America Gold Potassium Cyanide Industry Volume Share (%), by Country 2024 & 2032
- Figure 19: MEA Gold Potassium Cyanide Industry Revenue (Million), by Country 2024 & 2032
- Figure 20: MEA Gold Potassium Cyanide Industry Volume (K Tons), by Country 2024 & 2032
- Figure 21: MEA Gold Potassium Cyanide Industry Revenue Share (%), by Country 2024 & 2032
- Figure 22: MEA Gold Potassium Cyanide Industry Volume Share (%), by Country 2024 & 2032
- Figure 23: Asia Pacific Gold Potassium Cyanide Industry Revenue (Million), by Type 2024 & 2032
- Figure 24: Asia Pacific Gold Potassium Cyanide Industry Volume (K Tons), by Type 2024 & 2032
- Figure 25: Asia Pacific Gold Potassium Cyanide Industry Revenue Share (%), by Type 2024 & 2032
- Figure 26: Asia Pacific Gold Potassium Cyanide Industry Volume Share (%), by Type 2024 & 2032
- Figure 27: Asia Pacific Gold Potassium Cyanide Industry Revenue (Million), by Applications 2024 & 2032
- Figure 28: Asia Pacific Gold Potassium Cyanide Industry Volume (K Tons), by Applications 2024 & 2032
- Figure 29: Asia Pacific Gold Potassium Cyanide Industry Revenue Share (%), by Applications 2024 & 2032
- Figure 30: Asia Pacific Gold Potassium Cyanide Industry Volume Share (%), by Applications 2024 & 2032
- Figure 31: Asia Pacific Gold Potassium Cyanide Industry Revenue (Million), by Country 2024 & 2032
- Figure 32: Asia Pacific Gold Potassium Cyanide Industry Volume (K Tons), by Country 2024 & 2032
- Figure 33: Asia Pacific Gold Potassium Cyanide Industry Revenue Share (%), by Country 2024 & 2032
- Figure 34: Asia Pacific Gold Potassium Cyanide Industry Volume Share (%), by Country 2024 & 2032
- Figure 35: North America Gold Potassium Cyanide Industry Revenue (Million), by Type 2024 & 2032
- Figure 36: North America Gold Potassium Cyanide Industry Volume (K Tons), by Type 2024 & 2032
- Figure 37: North America Gold Potassium Cyanide Industry Revenue Share (%), by Type 2024 & 2032
- Figure 38: North America Gold Potassium Cyanide Industry Volume Share (%), by Type 2024 & 2032
- Figure 39: North America Gold Potassium Cyanide Industry Revenue (Million), by Applications 2024 & 2032
- Figure 40: North America Gold Potassium Cyanide Industry Volume (K Tons), by Applications 2024 & 2032
- Figure 41: North America Gold Potassium Cyanide Industry Revenue Share (%), by Applications 2024 & 2032
- Figure 42: North America Gold Potassium Cyanide Industry Volume Share (%), by Applications 2024 & 2032
- Figure 43: North America Gold Potassium Cyanide Industry Revenue (Million), by Country 2024 & 2032
- Figure 44: North America Gold Potassium Cyanide Industry Volume (K Tons), by Country 2024 & 2032
- Figure 45: North America Gold Potassium Cyanide Industry Revenue Share (%), by Country 2024 & 2032
- Figure 46: North America Gold Potassium Cyanide Industry Volume Share (%), by Country 2024 & 2032
- Figure 47: Europe Gold Potassium Cyanide Industry Revenue (Million), by Type 2024 & 2032
- Figure 48: Europe Gold Potassium Cyanide Industry Volume (K Tons), by Type 2024 & 2032
- Figure 49: Europe Gold Potassium Cyanide Industry Revenue Share (%), by Type 2024 & 2032
- Figure 50: Europe Gold Potassium Cyanide Industry Volume Share (%), by Type 2024 & 2032
- Figure 51: Europe Gold Potassium Cyanide Industry Revenue (Million), by Applications 2024 & 2032
- Figure 52: Europe Gold Potassium Cyanide Industry Volume (K Tons), by Applications 2024 & 2032
- Figure 53: Europe Gold Potassium Cyanide Industry Revenue Share (%), by Applications 2024 & 2032
- Figure 54: Europe Gold Potassium Cyanide Industry Volume Share (%), by Applications 2024 & 2032
- Figure 55: Europe Gold Potassium Cyanide Industry Revenue (Million), by Country 2024 & 2032
- Figure 56: Europe Gold Potassium Cyanide Industry Volume (K Tons), by Country 2024 & 2032
- Figure 57: Europe Gold Potassium Cyanide Industry Revenue Share (%), by Country 2024 & 2032
- Figure 58: Europe Gold Potassium Cyanide Industry Volume Share (%), by Country 2024 & 2032
- Figure 59: South America Gold Potassium Cyanide Industry Revenue (Million), by Type 2024 & 2032
- Figure 60: South America Gold Potassium Cyanide Industry Volume (K Tons), by Type 2024 & 2032
- Figure 61: South America Gold Potassium Cyanide Industry Revenue Share (%), by Type 2024 & 2032
- Figure 62: South America Gold Potassium Cyanide Industry Volume Share (%), by Type 2024 & 2032
- Figure 63: South America Gold Potassium Cyanide Industry Revenue (Million), by Applications 2024 & 2032
- Figure 64: South America Gold Potassium Cyanide Industry Volume (K Tons), by Applications 2024 & 2032
- Figure 65: South America Gold Potassium Cyanide Industry Revenue Share (%), by Applications 2024 & 2032
- Figure 66: South America Gold Potassium Cyanide Industry Volume Share (%), by Applications 2024 & 2032
- Figure 67: South America Gold Potassium Cyanide Industry Revenue (Million), by Country 2024 & 2032
- Figure 68: South America Gold Potassium Cyanide Industry Volume (K Tons), by Country 2024 & 2032
- Figure 69: South America Gold Potassium Cyanide Industry Revenue Share (%), by Country 2024 & 2032
- Figure 70: South America Gold Potassium Cyanide Industry Volume Share (%), by Country 2024 & 2032
- Figure 71: Middle East and Africa Gold Potassium Cyanide Industry Revenue (Million), by Type 2024 & 2032
- Figure 72: Middle East and Africa Gold Potassium Cyanide Industry Volume (K Tons), by Type 2024 & 2032
- Figure 73: Middle East and Africa Gold Potassium Cyanide Industry Revenue Share (%), by Type 2024 & 2032
- Figure 74: Middle East and Africa Gold Potassium Cyanide Industry Volume Share (%), by Type 2024 & 2032
- Figure 75: Middle East and Africa Gold Potassium Cyanide Industry Revenue (Million), by Applications 2024 & 2032
- Figure 76: Middle East and Africa Gold Potassium Cyanide Industry Volume (K Tons), by Applications 2024 & 2032
- Figure 77: Middle East and Africa Gold Potassium Cyanide Industry Revenue Share (%), by Applications 2024 & 2032
- Figure 78: Middle East and Africa Gold Potassium Cyanide Industry Volume Share (%), by Applications 2024 & 2032
- Figure 79: Middle East and Africa Gold Potassium Cyanide Industry Revenue (Million), by Country 2024 & 2032
- Figure 80: Middle East and Africa Gold Potassium Cyanide Industry Volume (K Tons), by Country 2024 & 2032
- Figure 81: Middle East and Africa Gold Potassium Cyanide Industry Revenue Share (%), by Country 2024 & 2032
- Figure 82: Middle East and Africa Gold Potassium Cyanide Industry Volume Share (%), by Country 2024 & 2032
List of Tables
- Table 1: Global Gold Potassium Cyanide Industry Revenue Million Forecast, by Region 2019 & 2032
- Table 2: Global Gold Potassium Cyanide Industry Volume K Tons Forecast, by Region 2019 & 2032
- Table 3: Global Gold Potassium Cyanide Industry Revenue Million Forecast, by Type 2019 & 2032
- Table 4: Global Gold Potassium Cyanide Industry Volume K Tons Forecast, by Type 2019 & 2032
- Table 5: Global Gold Potassium Cyanide Industry Revenue Million Forecast, by Applications 2019 & 2032
- Table 6: Global Gold Potassium Cyanide Industry Volume K Tons Forecast, by Applications 2019 & 2032
- Table 7: Global Gold Potassium Cyanide Industry Revenue Million Forecast, by Region 2019 & 2032
- Table 8: Global Gold Potassium Cyanide Industry Volume K Tons Forecast, by Region 2019 & 2032
- Table 9: Global Gold Potassium Cyanide Industry Revenue Million Forecast, by Country 2019 & 2032
- Table 10: Global Gold Potassium Cyanide Industry Volume K Tons Forecast, by Country 2019 & 2032
- Table 11: United States Gold Potassium Cyanide Industry Revenue (Million) Forecast, by Application 2019 & 2032
- Table 12: United States Gold Potassium Cyanide Industry Volume (K Tons) Forecast, by Application 2019 & 2032
- Table 13: Canada Gold Potassium Cyanide Industry Revenue (Million) Forecast, by Application 2019 & 2032
- Table 14: Canada Gold Potassium Cyanide Industry Volume (K Tons) Forecast, by Application 2019 & 2032
- Table 15: Mexico Gold Potassium Cyanide Industry Revenue (Million) Forecast, by Application 2019 & 2032
- Table 16: Mexico Gold Potassium Cyanide Industry Volume (K Tons) Forecast, by Application 2019 & 2032
- Table 17: Global Gold Potassium Cyanide Industry Revenue Million Forecast, by Country 2019 & 2032
- Table 18: Global Gold Potassium Cyanide Industry Volume K Tons Forecast, by Country 2019 & 2032
- Table 19: Germany Gold Potassium Cyanide Industry Revenue (Million) Forecast, by Application 2019 & 2032
- Table 20: Germany Gold Potassium Cyanide Industry Volume (K Tons) Forecast, by Application 2019 & 2032
- Table 21: France Gold Potassium Cyanide Industry Revenue (Million) Forecast, by Application 2019 & 2032
- Table 22: France Gold Potassium Cyanide Industry Volume (K Tons) Forecast, by Application 2019 & 2032
- Table 23: Italy Gold Potassium Cyanide Industry Revenue (Million) Forecast, by Application 2019 & 2032
- Table 24: Italy Gold Potassium Cyanide Industry Volume (K Tons) Forecast, by Application 2019 & 2032
- Table 25: United Kingdom Gold Potassium Cyanide Industry Revenue (Million) Forecast, by Application 2019 & 2032
- Table 26: United Kingdom Gold Potassium Cyanide Industry Volume (K Tons) Forecast, by Application 2019 & 2032
- Table 27: Netherlands Gold Potassium Cyanide Industry Revenue (Million) Forecast, by Application 2019 & 2032
- Table 28: Netherlands Gold Potassium Cyanide Industry Volume (K Tons) Forecast, by Application 2019 & 2032
- Table 29: Rest of Europe Gold Potassium Cyanide Industry Revenue (Million) Forecast, by Application 2019 & 2032
- Table 30: Rest of Europe Gold Potassium Cyanide Industry Volume (K Tons) Forecast, by Application 2019 & 2032
- Table 31: Global Gold Potassium Cyanide Industry Revenue Million Forecast, by Country 2019 & 2032
- Table 32: Global Gold Potassium Cyanide Industry Volume K Tons Forecast, by Country 2019 & 2032
- Table 33: China Gold Potassium Cyanide Industry Revenue (Million) Forecast, by Application 2019 & 2032
- Table 34: China Gold Potassium Cyanide Industry Volume (K Tons) Forecast, by Application 2019 & 2032
- Table 35: Japan Gold Potassium Cyanide Industry Revenue (Million) Forecast, by Application 2019 & 2032
- Table 36: Japan Gold Potassium Cyanide Industry Volume (K Tons) Forecast, by Application 2019 & 2032
- Table 37: India Gold Potassium Cyanide Industry Revenue (Million) Forecast, by Application 2019 & 2032
- Table 38: India Gold Potassium Cyanide Industry Volume (K Tons) Forecast, by Application 2019 & 2032
- Table 39: South Korea Gold Potassium Cyanide Industry Revenue (Million) Forecast, by Application 2019 & 2032
- Table 40: South Korea Gold Potassium Cyanide Industry Volume (K Tons) Forecast, by Application 2019 & 2032
- Table 41: Taiwan Gold Potassium Cyanide Industry Revenue (Million) Forecast, by Application 2019 & 2032
- Table 42: Taiwan Gold Potassium Cyanide Industry Volume (K Tons) Forecast, by Application 2019 & 2032
- Table 43: Australia Gold Potassium Cyanide Industry Revenue (Million) Forecast, by Application 2019 & 2032
- Table 44: Australia Gold Potassium Cyanide Industry Volume (K Tons) Forecast, by Application 2019 & 2032
- Table 45: Rest of Asia-Pacific Gold Potassium Cyanide Industry Revenue (Million) Forecast, by Application 2019 & 2032
- Table 46: Rest of Asia-Pacific Gold Potassium Cyanide Industry Volume (K Tons) Forecast, by Application 2019 & 2032
- Table 47: Global Gold Potassium Cyanide Industry Revenue Million Forecast, by Country 2019 & 2032
- Table 48: Global Gold Potassium Cyanide Industry Volume K Tons Forecast, by Country 2019 & 2032
- Table 49: Brazil Gold Potassium Cyanide Industry Revenue (Million) Forecast, by Application 2019 & 2032
- Table 50: Brazil Gold Potassium Cyanide Industry Volume (K Tons) Forecast, by Application 2019 & 2032
- Table 51: Argentina Gold Potassium Cyanide Industry Revenue (Million) Forecast, by Application 2019 & 2032
- Table 52: Argentina Gold Potassium Cyanide Industry Volume (K Tons) Forecast, by Application 2019 & 2032
- Table 53: Rest of South America Gold Potassium Cyanide Industry Revenue (Million) Forecast, by Application 2019 & 2032
- Table 54: Rest of South America Gold Potassium Cyanide Industry Volume (K Tons) Forecast, by Application 2019 & 2032
- Table 55: Global Gold Potassium Cyanide Industry Revenue Million Forecast, by Country 2019 & 2032
- Table 56: Global Gold Potassium Cyanide Industry Volume K Tons Forecast, by Country 2019 & 2032
- Table 57: Middle East Gold Potassium Cyanide Industry Revenue (Million) Forecast, by Application 2019 & 2032
- Table 58: Middle East Gold Potassium Cyanide Industry Volume (K Tons) Forecast, by Application 2019 & 2032
- Table 59: Africa Gold Potassium Cyanide Industry Revenue (Million) Forecast, by Application 2019 & 2032
- Table 60: Africa Gold Potassium Cyanide Industry Volume (K Tons) Forecast, by Application 2019 & 2032
- Table 61: Global Gold Potassium Cyanide Industry Revenue Million Forecast, by Type 2019 & 2032
- Table 62: Global Gold Potassium Cyanide Industry Volume K Tons Forecast, by Type 2019 & 2032
- Table 63: Global Gold Potassium Cyanide Industry Revenue Million Forecast, by Applications 2019 & 2032
- Table 64: Global Gold Potassium Cyanide Industry Volume K Tons Forecast, by Applications 2019 & 2032
- Table 65: Global Gold Potassium Cyanide Industry Revenue Million Forecast, by Country 2019 & 2032
- Table 66: Global Gold Potassium Cyanide Industry Volume K Tons Forecast, by Country 2019 & 2032
- Table 67: China Gold Potassium Cyanide Industry Revenue (Million) Forecast, by Application 2019 & 2032
- Table 68: China Gold Potassium Cyanide Industry Volume (K Tons) Forecast, by Application 2019 & 2032
- Table 69: India Gold Potassium Cyanide Industry Revenue (Million) Forecast, by Application 2019 & 2032
- Table 70: India Gold Potassium Cyanide Industry Volume (K Tons) Forecast, by Application 2019 & 2032
- Table 71: Japan Gold Potassium Cyanide Industry Revenue (Million) Forecast, by Application 2019 & 2032
- Table 72: Japan Gold Potassium Cyanide Industry Volume (K Tons) Forecast, by Application 2019 & 2032
- Table 73: South Korea Gold Potassium Cyanide Industry Revenue (Million) Forecast, by Application 2019 & 2032
- Table 74: South Korea Gold Potassium Cyanide Industry Volume (K Tons) Forecast, by Application 2019 & 2032
- Table 75: Rest of Asia Pacific Gold Potassium Cyanide Industry Revenue (Million) Forecast, by Application 2019 & 2032
- Table 76: Rest of Asia Pacific Gold Potassium Cyanide Industry Volume (K Tons) Forecast, by Application 2019 & 2032
- Table 77: Global Gold Potassium Cyanide Industry Revenue Million Forecast, by Type 2019 & 2032
- Table 78: Global Gold Potassium Cyanide Industry Volume K Tons Forecast, by Type 2019 & 2032
- Table 79: Global Gold Potassium Cyanide Industry Revenue Million Forecast, by Applications 2019 & 2032
- Table 80: Global Gold Potassium Cyanide Industry Volume K Tons Forecast, by Applications 2019 & 2032
- Table 81: Global Gold Potassium Cyanide Industry Revenue Million Forecast, by Country 2019 & 2032
- Table 82: Global Gold Potassium Cyanide Industry Volume K Tons Forecast, by Country 2019 & 2032
- Table 83: United States Gold Potassium Cyanide Industry Revenue (Million) Forecast, by Application 2019 & 2032
- Table 84: United States Gold Potassium Cyanide Industry Volume (K Tons) Forecast, by Application 2019 & 2032
- Table 85: Canada Gold Potassium Cyanide Industry Revenue (Million) Forecast, by Application 2019 & 2032
- Table 86: Canada Gold Potassium Cyanide Industry Volume (K Tons) Forecast, by Application 2019 & 2032
- Table 87: Mexico Gold Potassium Cyanide Industry Revenue (Million) Forecast, by Application 2019 & 2032
- Table 88: Mexico Gold Potassium Cyanide Industry Volume (K Tons) Forecast, by Application 2019 & 2032
- Table 89: Global Gold Potassium Cyanide Industry Revenue Million Forecast, by Type 2019 & 2032
- Table 90: Global Gold Potassium Cyanide Industry Volume K Tons Forecast, by Type 2019 & 2032
- Table 91: Global Gold Potassium Cyanide Industry Revenue Million Forecast, by Applications 2019 & 2032
- Table 92: Global Gold Potassium Cyanide Industry Volume K Tons Forecast, by Applications 2019 & 2032
- Table 93: Global Gold Potassium Cyanide Industry Revenue Million Forecast, by Country 2019 & 2032
- Table 94: Global Gold Potassium Cyanide Industry Volume K Tons Forecast, by Country 2019 & 2032
- Table 95: Germany Gold Potassium Cyanide Industry Revenue (Million) Forecast, by Application 2019 & 2032
- Table 96: Germany Gold Potassium Cyanide Industry Volume (K Tons) Forecast, by Application 2019 & 2032
- Table 97: United Kingdom Gold Potassium Cyanide Industry Revenue (Million) Forecast, by Application 2019 & 2032
- Table 98: United Kingdom Gold Potassium Cyanide Industry Volume (K Tons) Forecast, by Application 2019 & 2032
- Table 99: France Gold Potassium Cyanide Industry Revenue (Million) Forecast, by Application 2019 & 2032
- Table 100: France Gold Potassium Cyanide Industry Volume (K Tons) Forecast, by Application 2019 & 2032
- Table 101: Italy Gold Potassium Cyanide Industry Revenue (Million) Forecast, by Application 2019 & 2032
- Table 102: Italy Gold Potassium Cyanide Industry Volume (K Tons) Forecast, by Application 2019 & 2032
- Table 103: Rest of Europe Gold Potassium Cyanide Industry Revenue (Million) Forecast, by Application 2019 & 2032
- Table 104: Rest of Europe Gold Potassium Cyanide Industry Volume (K Tons) Forecast, by Application 2019 & 2032
- Table 105: Global Gold Potassium Cyanide Industry Revenue Million Forecast, by Type 2019 & 2032
- Table 106: Global Gold Potassium Cyanide Industry Volume K Tons Forecast, by Type 2019 & 2032
- Table 107: Global Gold Potassium Cyanide Industry Revenue Million Forecast, by Applications 2019 & 2032
- Table 108: Global Gold Potassium Cyanide Industry Volume K Tons Forecast, by Applications 2019 & 2032
- Table 109: Global Gold Potassium Cyanide Industry Revenue Million Forecast, by Country 2019 & 2032
- Table 110: Global Gold Potassium Cyanide Industry Volume K Tons Forecast, by Country 2019 & 2032
- Table 111: Brazil Gold Potassium Cyanide Industry Revenue (Million) Forecast, by Application 2019 & 2032
- Table 112: Brazil Gold Potassium Cyanide Industry Volume (K Tons) Forecast, by Application 2019 & 2032
- Table 113: Argentina Gold Potassium Cyanide Industry Revenue (Million) Forecast, by Application 2019 & 2032
- Table 114: Argentina Gold Potassium Cyanide Industry Volume (K Tons) Forecast, by Application 2019 & 2032
- Table 115: Rest of South America Gold Potassium Cyanide Industry Revenue (Million) Forecast, by Application 2019 & 2032
- Table 116: Rest of South America Gold Potassium Cyanide Industry Volume (K Tons) Forecast, by Application 2019 & 2032
- Table 117: Global Gold Potassium Cyanide Industry Revenue Million Forecast, by Type 2019 & 2032
- Table 118: Global Gold Potassium Cyanide Industry Volume K Tons Forecast, by Type 2019 & 2032
- Table 119: Global Gold Potassium Cyanide Industry Revenue Million Forecast, by Applications 2019 & 2032
- Table 120: Global Gold Potassium Cyanide Industry Volume K Tons Forecast, by Applications 2019 & 2032
- Table 121: Global Gold Potassium Cyanide Industry Revenue Million Forecast, by Country 2019 & 2032
- Table 122: Global Gold Potassium Cyanide Industry Volume K Tons Forecast, by Country 2019 & 2032
- Table 123: Saudi Arabia Gold Potassium Cyanide Industry Revenue (Million) Forecast, by Application 2019 & 2032
- Table 124: Saudi Arabia Gold Potassium Cyanide Industry Volume (K Tons) Forecast, by Application 2019 & 2032
- Table 125: South Africa Gold Potassium Cyanide Industry Revenue (Million) Forecast, by Application 2019 & 2032
- Table 126: South Africa Gold Potassium Cyanide Industry Volume (K Tons) Forecast, by Application 2019 & 2032
- Table 127: Rest of Middle East and Africa Gold Potassium Cyanide Industry Revenue (Million) Forecast, by Application 2019 & 2032
- Table 128: Rest of Middle East and Africa Gold Potassium Cyanide Industry Volume (K Tons) Forecast, by Application 2019 & 2032
Frequently Asked Questions
1. What is the projected Compound Annual Growth Rate (CAGR) of the Gold Potassium Cyanide Industry?
The projected CAGR is approximately 2.97%.
2. Which companies are prominent players in the Gold Potassium Cyanide Industry?
Key companies in the market include LEGOR GROUP S p A, Parekh Industries Ltd, Bangalore Refinery, Prominex Precious Mineral Resources, Spectrum Chemical Manufacturing Corp, Umicore Electroplating, Innova Corporate, Alfa Aesar Thermo Fisher Scientific, Mahavir Expochem Ltd, METALOR Technologies SA.
3. What are the main segments of the Gold Potassium Cyanide Industry?
The market segments include Type, Applications.
4. Can you provide details about the market size?
The market size is estimated to be USD 1052.6 Million as of 2022.
5. What are some drivers contributing to market growth?
Increasing Applications for Electroplating of Gold; Growing Demand from the Electronics Industry.
6. What are the notable trends driving market growth?
Growing Demand from Electronics and Metal Plating Industries.
7. Are there any restraints impacting market growth?
High Toxic Nature and Impact of COVID-19 Pandemic; Other Restraints.
8. Can you provide examples of recent developments in the market?
November 2022: Besra Gold Inc announced its agreement with Quantum Metals Recovery Inc which will come into effect from January 2023. As per the agreement, Quantum Metals Recovery Inc will provide an amount of USD 300 million in financial support through the gold offtake purchase facility. The agreement consent between both companies would enable advancement in exploration and development planning for gold.
9. What pricing options are available for accessing the report?
Pricing options include single-user, multi-user, and enterprise licenses priced at USD 4750, USD 5250, and USD 8750 respectively.
10. Is the market size provided in terms of value or volume?
The market size is provided in terms of value, measured in Million and volume, measured in K Tons.
11. Are there any specific market keywords associated with the report?
Yes, the market keyword associated with the report is "Gold Potassium Cyanide Industry," which aids in identifying and referencing the specific market segment covered.
12. How do I determine which pricing option suits my needs best?
The pricing options vary based on user requirements and access needs. Individual users may opt for single-user licenses, while businesses requiring broader access may choose multi-user or enterprise licenses for cost-effective access to the report.
13. Are there any additional resources or data provided in the Gold Potassium Cyanide Industry report?
While the report offers comprehensive insights, it's advisable to review the specific contents or supplementary materials provided to ascertain if additional resources or data are available.
14. How can I stay updated on further developments or reports in the Gold Potassium Cyanide Industry?
To stay informed about further developments, trends, and reports in the Gold Potassium Cyanide Industry, consider subscribing to industry newsletters, following relevant companies and organizations, or regularly checking reputable industry news sources and publications.
Methodology
Step 1 - Identification of Relevant Samples Size from Population Database


Step 2 - Approaches for Defining Global Market Size (Value, Volume* & Price*)

Note*: In applicable scenarios
Step 3 - Data Sources
Primary Research
- Web Analytics
- Survey Reports
- Research Institute
- Latest Research Reports
- Opinion Leaders
Secondary Research
- Annual Reports
- White Paper
- Latest Press Release
- Industry Association
- Paid Database
- Investor Presentations

Step 4 - Data Triangulation
Involves using different sources of information in order to increase the validity of a study
These sources are likely to be stakeholders in a program - participants, other researchers, program staff, other community members, and so on.
Then we put all data in single framework & apply various statistical tools to find out the dynamic on the market.
During the analysis stage, feedback from the stakeholder groups would be compared to determine areas of agreement as well as areas of divergence
