

Key Insights
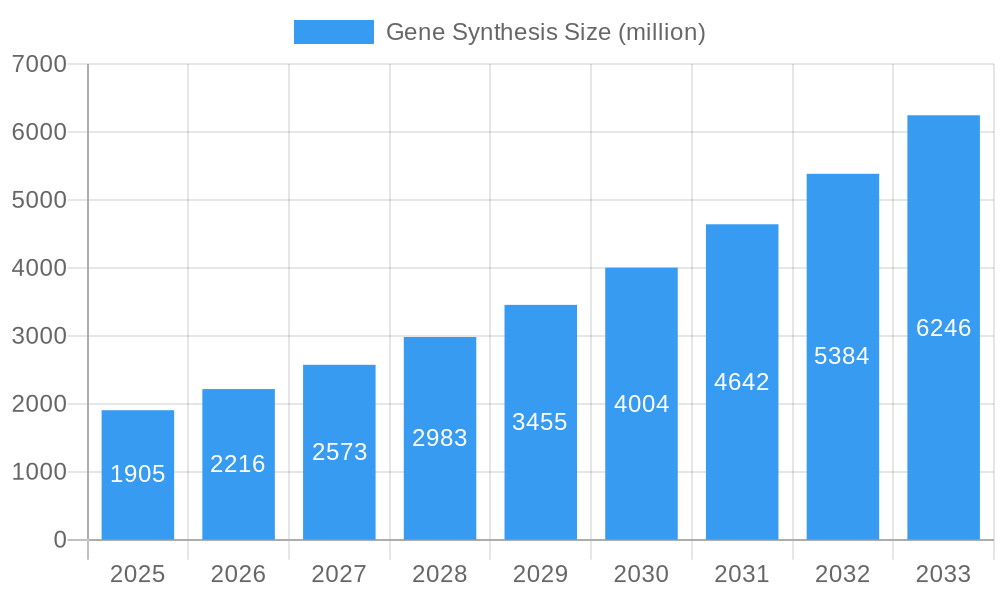
The gene synthesis market, valued at approximately $1.905 billion in 2025, is experiencing robust growth, projected to expand at a Compound Annual Growth Rate (CAGR) of 16.4% from 2025 to 2033. This significant expansion is driven by several key factors. The increasing demand for personalized medicine, fueled by advancements in gene therapy and drug discovery, is a primary catalyst. Furthermore, the rising adoption of next-generation sequencing technologies and synthetic biology applications across diverse sectors – from pharmaceuticals and agriculture to industrial biotechnology – is significantly boosting market demand. Reduced costs associated with gene synthesis technologies and increased accessibility of these services are also contributing to market growth. The market is segmented by various factors including gene length, application (e.g., research, therapeutics, diagnostics), and technology platform (e.g., solid-phase synthesis, enzymatic synthesis). Competition is fierce amongst key players like Genscript, Thermo Scientific, and Twist Bioscience, who are constantly innovating to improve efficiency, lower costs, and expand their service offerings to cater to the ever-evolving needs of researchers and industries.
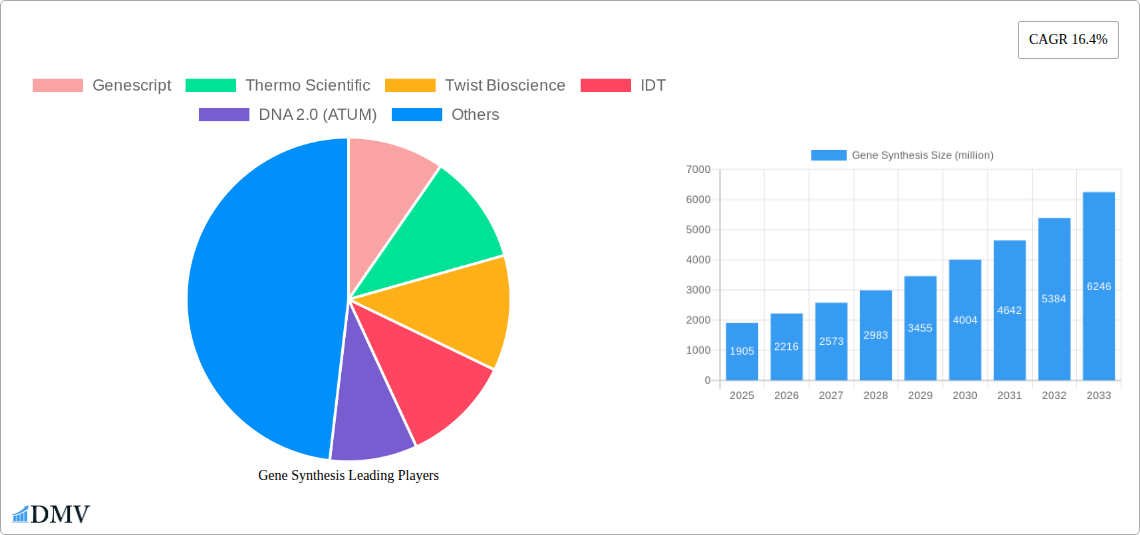
Gene Synthesis Market Size (In Billion)
Despite the rapid growth, the market faces certain restraints. Stringent regulatory approvals for gene-based therapies and the potential ethical concerns surrounding gene editing remain challenges. The complexity involved in synthesizing long DNA sequences and ensuring high fidelity also contributes to limitations. Nevertheless, the ongoing technological advancements in gene synthesis, coupled with a continuously expanding range of applications, are expected to overcome these limitations and drive considerable market growth in the coming years. The market will likely see consolidation among companies, with leading players focusing on strategic collaborations and acquisitions to further expand their market share and technological capabilities.
Gene Synthesis Company Market Share
Gene Synthesis Market Report: A Comprehensive Analysis (2019-2033)
This insightful report provides a comprehensive analysis of the global gene synthesis market, projecting a market value exceeding $XX million by 2033. The study period covers 2019-2033, with 2025 serving as both the base and estimated year. The forecast period spans 2025-2033, and the historical period encompasses 2019-2024. This report is crucial for stakeholders seeking to understand market dynamics, identify growth opportunities, and make strategic investment decisions within this rapidly evolving sector.
Gene Synthesis Market Composition & Trends
The gene synthesis market is characterized by a moderately concentrated landscape, with key players such as GeneScript, Thermo Scientific, Twist Bioscience, IDT, DNA 2.0 (ATUM), OriGene, Eurofins Genomics, BBI, Azenta Life Sciences, SBS Genetech, Bio Basic, and others vying for market share. The combined market share of the top five players is estimated at approximately XX%. Innovation is driven by advancements in next-generation sequencing (NGS), CRISPR-Cas9 technology, and synthetic biology. Regulatory landscapes vary significantly across regions, impacting market access and product development. Substitute products, such as gene editing techniques, present competitive pressures. End-users primarily include pharmaceutical companies, biotechnology firms, academic research institutions, and agricultural businesses. Significant M&A activity, with deal values exceeding $XX million in the past five years, further shapes the market landscape.
- Market Concentration: Moderately concentrated with the top 5 players holding XX% market share.
- Innovation Catalysts: NGS, CRISPR-Cas9, and synthetic biology advancements.
- Regulatory Landscape: Varies significantly across regions, influencing market access.
- Substitute Products: Gene editing techniques pose competitive pressure.
- End-User Profile: Pharmaceutical, biotech firms, research institutions, and agricultural businesses.
- M&A Activity: Deal values exceeding $XX million in the last five years.
Gene Synthesis Industry Evolution
The gene synthesis market has witnessed robust growth, with a compound annual growth rate (CAGR) of approximately XX% during the historical period (2019-2024). This growth is fueled by increasing demand for personalized medicine, rising investments in biotechnology research, and the expanding applications of gene synthesis across various industries. Technological advancements, such as automated synthesis platforms and improved oligonucleotide design algorithms, have significantly increased efficiency and reduced costs. Consumer demand shifts towards higher throughput, cost-effectiveness, and faster turnaround times. This necessitates continuous innovation within the industry. The forecast period (2025-2033) anticipates a maintained CAGR of approximately XX%, driven by factors such as the increasing adoption of gene therapy, growing investments in synthetic biology research, and expanding applications in diagnostics. The market is expected to reach a value exceeding $XX million by 2033.
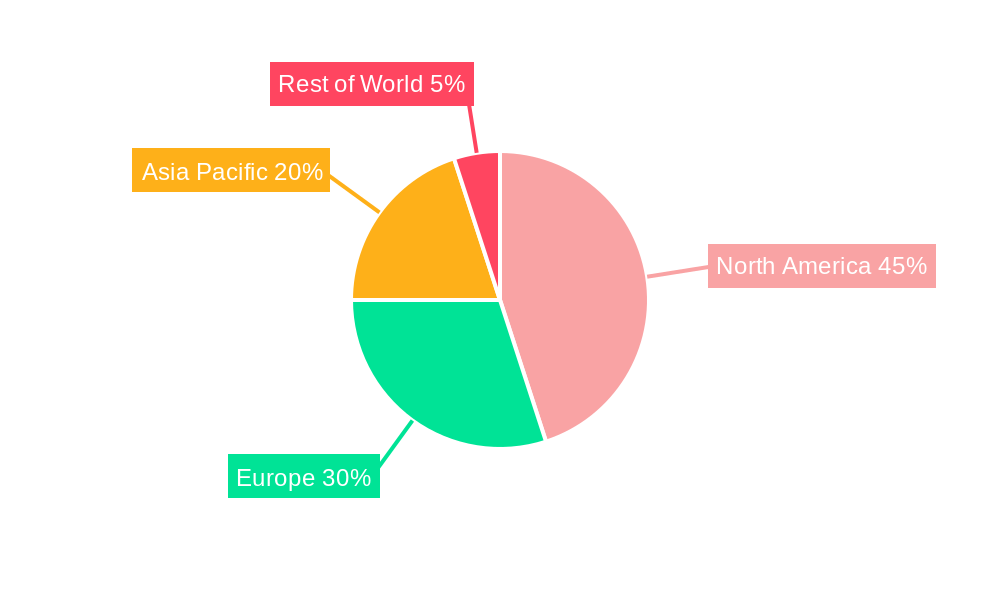
Leading Regions, Countries, or Segments in Gene Synthesis
North America currently dominates the global gene synthesis market, driven by substantial investments in biotechnology research, the presence of major players, and supportive regulatory frameworks.
- Key Drivers for North American Dominance:
- High R&D spending and robust venture capital funding.
- Presence of major gene synthesis companies and established infrastructure.
- Stringent yet supportive regulatory environment fostering innovation.
- Strong intellectual property protection.
Europe and Asia-Pacific are also significant markets experiencing rapid growth, fueled by rising government investments and increasing demand for gene-based therapies and diagnostics.
Asia-Pacific Growth Drivers:
- Increasing investments in life sciences research and development.
- Rising prevalence of chronic diseases driving demand for personalized medicine.
- Government initiatives promoting the biotechnology sector.
Europe Growth Drivers:
- Strong regulatory frameworks for gene therapy and related applications.
- Presence of numerous biotechnology companies and research institutions.
- Growing adoption of advanced gene synthesis technologies.
Gene Synthesis Product Innovations
Recent innovations in gene synthesis include the development of high-fidelity DNA synthesis methods, improved oligonucleotide design algorithms, and automated synthesis platforms capable of producing longer DNA sequences with enhanced accuracy. These advancements are enabling the creation of complex gene constructs for various applications, including gene therapy, drug discovery, and synthetic biology. Companies are increasingly focusing on unique selling propositions such as faster turnaround times, reduced costs, and improved accuracy to gain a competitive edge.
Propelling Factors for Gene Synthesis Growth
The gene synthesis market is propelled by several key factors. Technological advancements such as automation and higher-throughput technologies continually drive efficiency and reduce costs. Increasing investments in biotechnology research and development from both public and private sectors further fuel market growth. Favorable regulatory frameworks in several regions are encouraging innovation and adoption of gene synthesis technologies. The rising demand for personalized medicine and gene-based therapeutics significantly impacts market expansion.
Obstacles in the Gene Synthesis Market
The gene synthesis market faces challenges including stringent regulatory approvals for gene therapies, which can cause significant delays and increase development costs. Supply chain disruptions, particularly for specialized reagents and materials, pose an ongoing threat to production stability. Intense competition among established players and emerging companies leads to pricing pressures and the need for continuous innovation. These factors can collectively impact the market's overall growth trajectory.
Future Opportunities in Gene Synthesis
Emerging opportunities lie in the development of next-generation gene synthesis technologies, such as DNA printing and enzymatic synthesis, promising higher throughput and reduced cost. Expanding applications in areas like synthetic biology, agricultural biotechnology, and industrial biotechnology will open new market avenues. The rising adoption of gene editing tools, including CRISPR-Cas9, will create synergistic opportunities for gene synthesis companies. The focus on personalized medicine and the growing understanding of the human genome present considerable long-term growth potential.
Major Players in the Gene Synthesis Ecosystem
- GeneScript
- Thermo Scientific
- Twist Bioscience
- IDT
- DNA 2.0 (ATUM)
- OriGene
- Eurofins Genomics
- BBI
- Azenta Life Sciences
- SBS Genetech
- Bio Basic
Key Developments in Gene Synthesis Industry
- [Year/Month]: Company X launches a new high-throughput gene synthesis platform.
- [Year/Month]: Company Y acquires Company Z, expanding its market reach and product portfolio.
- [Year/Month]: A new regulatory guideline is issued impacting the gene synthesis market in Region A.
- [Year/Month]: Significant advancement in CRISPR-Cas9 gene editing technology is announced, driving new applications for gene synthesis.
- [Year/Month]: A major breakthrough in enzymatic DNA synthesis is reported, promising cheaper and faster production methods.
Strategic Gene Synthesis Market Forecast
The global gene synthesis market is poised for substantial growth over the forecast period (2025-2033), driven by ongoing technological advancements, increased R&D investments, and expanding applications across various sectors. The market is expected to experience a CAGR exceeding XX%, reaching a value of over $XX million by 2033. Emerging technologies and applications will continue to shape market dynamics, creating significant opportunities for both established and emerging players.
Gene Synthesis Segmentation
-
1. Application
- 1.1. Commercial
- 1.2. Academic Research
-
2. Type
- 2.1. Below 1000 bp
- 2.2. 1001-3000 bp
- 2.3. 3001-5000 bp
- 2.4. Above 5000 bp
Gene Synthesis Segmentation By Geography
-
1. North America
- 1.1. United States
- 1.2. Canada
- 1.3. Mexico
-
2. South America
- 2.1. Brazil
- 2.2. Argentina
- 2.3. Rest of South America
-
3. Europe
- 3.1. United Kingdom
- 3.2. Germany
- 3.3. France
- 3.4. Italy
- 3.5. Spain
- 3.6. Russia
- 3.7. Benelux
- 3.8. Nordics
- 3.9. Rest of Europe
-
4. Middle East & Africa
- 4.1. Turkey
- 4.2. Israel
- 4.3. GCC
- 4.4. North Africa
- 4.5. South Africa
- 4.6. Rest of Middle East & Africa
-
5. Asia Pacific
- 5.1. China
- 5.2. India
- 5.3. Japan
- 5.4. South Korea
- 5.5. ASEAN
- 5.6. Oceania
- 5.7. Rest of Asia Pacific
Gene Synthesis Regional Market Share
Geographic Coverage of Gene Synthesis
Gene Synthesis REPORT HIGHLIGHTS
| Aspects | Details |
|---|---|
| Study Period | 2020-2034 |
| Base Year | 2025 |
| Estimated Year | 2026 |
| Forecast Period | 2026-2034 |
| Historical Period | 2020-2025 |
| Growth Rate | CAGR of 16.4% from 2020-2034 |
| Segmentation |
|
Table of Contents
- 1. Introduction
- 1.1. Research Scope
- 1.2. Market Segmentation
- 1.3. Research Objective
- 1.4. Definitions and Assumptions
- 2. Executive Summary
- 2.1. Market Snapshot
- 3. Market Dynamics
- 3.1. Market Drivers
- 3.2. Market Restrains
- 3.3. Market Trends
- 3.4. Market Opportunities
- 4. Market Factor Analysis
- 4.1. Porters Five Forces
- 4.1.1. Bargaining Power of Suppliers
- 4.1.2. Bargaining Power of Buyers
- 4.1.3. Threat of New Entrants
- 4.1.4. Threat of Substitutes
- 4.1.5. Competitive Rivalry
- 4.2. PESTEL analysis
- 4.3. BCG Analysis
- 4.3.1. Stars (High Growth, High Market Share)
- 4.3.2. Cash Cows (Low Growth, High Market Share)
- 4.3.3. Question Mark (High Growth, Low Market Share)
- 4.3.4. Dogs (Low Growth, Low Market Share)
- 4.4. Ansoff Matrix Analysis
- 4.5. Supply Chain Analysis
- 4.6. Regulatory Landscape
- 4.7. Current Market Potential and Opportunity Assessment (TAM–SAM–SOM Framework)
- 4.8. DMV Analyst Note
- 4.1. Porters Five Forces
- 5. Market Analysis, Insights and Forecast 2021-2033
- 5.1. Market Analysis, Insights and Forecast - by Application
- 5.1.1. Commercial
- 5.1.2. Academic Research
- 5.2. Market Analysis, Insights and Forecast - by Type
- 5.2.1. Below 1000 bp
- 5.2.2. 1001-3000 bp
- 5.2.3. 3001-5000 bp
- 5.2.4. Above 5000 bp
- 5.3. Market Analysis, Insights and Forecast - by Region
- 5.3.1. North America
- 5.3.2. South America
- 5.3.3. Europe
- 5.3.4. Middle East & Africa
- 5.3.5. Asia Pacific
- 5.1. Market Analysis, Insights and Forecast - by Application
- 6. Global Gene Synthesis Analysis, Insights and Forecast, 2021-2033
- 6.1. Market Analysis, Insights and Forecast - by Application
- 6.1.1. Commercial
- 6.1.2. Academic Research
- 6.2. Market Analysis, Insights and Forecast - by Type
- 6.2.1. Below 1000 bp
- 6.2.2. 1001-3000 bp
- 6.2.3. 3001-5000 bp
- 6.2.4. Above 5000 bp
- 6.1. Market Analysis, Insights and Forecast - by Application
- 7. North America Gene Synthesis Analysis, Insights and Forecast, 2020-2032
- 7.1. Market Analysis, Insights and Forecast - by Application
- 7.1.1. Commercial
- 7.1.2. Academic Research
- 7.2. Market Analysis, Insights and Forecast - by Type
- 7.2.1. Below 1000 bp
- 7.2.2. 1001-3000 bp
- 7.2.3. 3001-5000 bp
- 7.2.4. Above 5000 bp
- 7.1. Market Analysis, Insights and Forecast - by Application
- 8. South America Gene Synthesis Analysis, Insights and Forecast, 2020-2032
- 8.1. Market Analysis, Insights and Forecast - by Application
- 8.1.1. Commercial
- 8.1.2. Academic Research
- 8.2. Market Analysis, Insights and Forecast - by Type
- 8.2.1. Below 1000 bp
- 8.2.2. 1001-3000 bp
- 8.2.3. 3001-5000 bp
- 8.2.4. Above 5000 bp
- 8.1. Market Analysis, Insights and Forecast - by Application
- 9. Europe Gene Synthesis Analysis, Insights and Forecast, 2020-2032
- 9.1. Market Analysis, Insights and Forecast - by Application
- 9.1.1. Commercial
- 9.1.2. Academic Research
- 9.2. Market Analysis, Insights and Forecast - by Type
- 9.2.1. Below 1000 bp
- 9.2.2. 1001-3000 bp
- 9.2.3. 3001-5000 bp
- 9.2.4. Above 5000 bp
- 9.1. Market Analysis, Insights and Forecast - by Application
- 10. Middle East & Africa Gene Synthesis Analysis, Insights and Forecast, 2020-2032
- 10.1. Market Analysis, Insights and Forecast - by Application
- 10.1.1. Commercial
- 10.1.2. Academic Research
- 10.2. Market Analysis, Insights and Forecast - by Type
- 10.2.1. Below 1000 bp
- 10.2.2. 1001-3000 bp
- 10.2.3. 3001-5000 bp
- 10.2.4. Above 5000 bp
- 10.1. Market Analysis, Insights and Forecast - by Application
- 11. Asia Pacific Gene Synthesis Analysis, Insights and Forecast, 2020-2032
- 11.1. Market Analysis, Insights and Forecast - by Application
- 11.1.1. Commercial
- 11.1.2. Academic Research
- 11.2. Market Analysis, Insights and Forecast - by Type
- 11.2.1. Below 1000 bp
- 11.2.2. 1001-3000 bp
- 11.2.3. 3001-5000 bp
- 11.2.4. Above 5000 bp
- 11.1. Market Analysis, Insights and Forecast - by Application
- 12. Competitive Analysis
- 12.1. Company Profiles
- 12.1.1 Genescript
- 12.1.1.1. Company Overview
- 12.1.1.2. Products
- 12.1.1.3. Company Financials
- 12.1.1.4. SWOT Analysis
- 12.1.2 Thermo Scientific
- 12.1.2.1. Company Overview
- 12.1.2.2. Products
- 12.1.2.3. Company Financials
- 12.1.2.4. SWOT Analysis
- 12.1.3 Twist Bioscience
- 12.1.3.1. Company Overview
- 12.1.3.2. Products
- 12.1.3.3. Company Financials
- 12.1.3.4. SWOT Analysis
- 12.1.4 IDT
- 12.1.4.1. Company Overview
- 12.1.4.2. Products
- 12.1.4.3. Company Financials
- 12.1.4.4. SWOT Analysis
- 12.1.5 DNA 2.0 (ATUM)
- 12.1.5.1. Company Overview
- 12.1.5.2. Products
- 12.1.5.3. Company Financials
- 12.1.5.4. SWOT Analysis
- 12.1.6 OriGene
- 12.1.6.1. Company Overview
- 12.1.6.2. Products
- 12.1.6.3. Company Financials
- 12.1.6.4. SWOT Analysis
- 12.1.7 Eurofins Genomics
- 12.1.7.1. Company Overview
- 12.1.7.2. Products
- 12.1.7.3. Company Financials
- 12.1.7.4. SWOT Analysis
- 12.1.8 BBI
- 12.1.8.1. Company Overview
- 12.1.8.2. Products
- 12.1.8.3. Company Financials
- 12.1.8.4. SWOT Analysis
- 12.1.9 Azenta Life Sciences
- 12.1.9.1. Company Overview
- 12.1.9.2. Products
- 12.1.9.3. Company Financials
- 12.1.9.4. SWOT Analysis
- 12.1.10 SBS Genetech
- 12.1.10.1. Company Overview
- 12.1.10.2. Products
- 12.1.10.3. Company Financials
- 12.1.10.4. SWOT Analysis
- 12.1.11 Bio Basic
- 12.1.11.1. Company Overview
- 12.1.11.2. Products
- 12.1.11.3. Company Financials
- 12.1.11.4. SWOT Analysis
- 12.1.1 Genescript
- 12.2. Market Entropy
- 12.2.1 Company's Key Areas Served
- 12.2.2 Recent Developments
- 12.3. Company Market Share Analysis 2025
- 12.3.1 Top 5 Companies Market Share Analysis
- 12.3.2 Top 3 Companies Market Share Analysis
- 12.4. List of Potential Customers
- 13. Research Methodology
List of Figures
- Figure 1: Global Gene Synthesis Revenue Breakdown (million, %) by Region 2025 & 2033
- Figure 2: North America Gene Synthesis Revenue (million), by Application 2025 & 2033
- Figure 3: North America Gene Synthesis Revenue Share (%), by Application 2025 & 2033
- Figure 4: North America Gene Synthesis Revenue (million), by Type 2025 & 2033
- Figure 5: North America Gene Synthesis Revenue Share (%), by Type 2025 & 2033
- Figure 6: North America Gene Synthesis Revenue (million), by Country 2025 & 2033
- Figure 7: North America Gene Synthesis Revenue Share (%), by Country 2025 & 2033
- Figure 8: South America Gene Synthesis Revenue (million), by Application 2025 & 2033
- Figure 9: South America Gene Synthesis Revenue Share (%), by Application 2025 & 2033
- Figure 10: South America Gene Synthesis Revenue (million), by Type 2025 & 2033
- Figure 11: South America Gene Synthesis Revenue Share (%), by Type 2025 & 2033
- Figure 12: South America Gene Synthesis Revenue (million), by Country 2025 & 2033
- Figure 13: South America Gene Synthesis Revenue Share (%), by Country 2025 & 2033
- Figure 14: Europe Gene Synthesis Revenue (million), by Application 2025 & 2033
- Figure 15: Europe Gene Synthesis Revenue Share (%), by Application 2025 & 2033
- Figure 16: Europe Gene Synthesis Revenue (million), by Type 2025 & 2033
- Figure 17: Europe Gene Synthesis Revenue Share (%), by Type 2025 & 2033
- Figure 18: Europe Gene Synthesis Revenue (million), by Country 2025 & 2033
- Figure 19: Europe Gene Synthesis Revenue Share (%), by Country 2025 & 2033
- Figure 20: Middle East & Africa Gene Synthesis Revenue (million), by Application 2025 & 2033
- Figure 21: Middle East & Africa Gene Synthesis Revenue Share (%), by Application 2025 & 2033
- Figure 22: Middle East & Africa Gene Synthesis Revenue (million), by Type 2025 & 2033
- Figure 23: Middle East & Africa Gene Synthesis Revenue Share (%), by Type 2025 & 2033
- Figure 24: Middle East & Africa Gene Synthesis Revenue (million), by Country 2025 & 2033
- Figure 25: Middle East & Africa Gene Synthesis Revenue Share (%), by Country 2025 & 2033
- Figure 26: Asia Pacific Gene Synthesis Revenue (million), by Application 2025 & 2033
- Figure 27: Asia Pacific Gene Synthesis Revenue Share (%), by Application 2025 & 2033
- Figure 28: Asia Pacific Gene Synthesis Revenue (million), by Type 2025 & 2033
- Figure 29: Asia Pacific Gene Synthesis Revenue Share (%), by Type 2025 & 2033
- Figure 30: Asia Pacific Gene Synthesis Revenue (million), by Country 2025 & 2033
- Figure 31: Asia Pacific Gene Synthesis Revenue Share (%), by Country 2025 & 2033
List of Tables
- Table 1: Global Gene Synthesis Revenue million Forecast, by Application 2020 & 2033
- Table 2: Global Gene Synthesis Revenue million Forecast, by Type 2020 & 2033
- Table 3: Global Gene Synthesis Revenue million Forecast, by Region 2020 & 2033
- Table 4: Global Gene Synthesis Revenue million Forecast, by Application 2020 & 2033
- Table 5: Global Gene Synthesis Revenue million Forecast, by Type 2020 & 2033
- Table 6: Global Gene Synthesis Revenue million Forecast, by Country 2020 & 2033
- Table 7: United States Gene Synthesis Revenue (million) Forecast, by Application 2020 & 2033
- Table 8: Canada Gene Synthesis Revenue (million) Forecast, by Application 2020 & 2033
- Table 9: Mexico Gene Synthesis Revenue (million) Forecast, by Application 2020 & 2033
- Table 10: Global Gene Synthesis Revenue million Forecast, by Application 2020 & 2033
- Table 11: Global Gene Synthesis Revenue million Forecast, by Type 2020 & 2033
- Table 12: Global Gene Synthesis Revenue million Forecast, by Country 2020 & 2033
- Table 13: Brazil Gene Synthesis Revenue (million) Forecast, by Application 2020 & 2033
- Table 14: Argentina Gene Synthesis Revenue (million) Forecast, by Application 2020 & 2033
- Table 15: Rest of South America Gene Synthesis Revenue (million) Forecast, by Application 2020 & 2033
- Table 16: Global Gene Synthesis Revenue million Forecast, by Application 2020 & 2033
- Table 17: Global Gene Synthesis Revenue million Forecast, by Type 2020 & 2033
- Table 18: Global Gene Synthesis Revenue million Forecast, by Country 2020 & 2033
- Table 19: United Kingdom Gene Synthesis Revenue (million) Forecast, by Application 2020 & 2033
- Table 20: Germany Gene Synthesis Revenue (million) Forecast, by Application 2020 & 2033
- Table 21: France Gene Synthesis Revenue (million) Forecast, by Application 2020 & 2033
- Table 22: Italy Gene Synthesis Revenue (million) Forecast, by Application 2020 & 2033
- Table 23: Spain Gene Synthesis Revenue (million) Forecast, by Application 2020 & 2033
- Table 24: Russia Gene Synthesis Revenue (million) Forecast, by Application 2020 & 2033
- Table 25: Benelux Gene Synthesis Revenue (million) Forecast, by Application 2020 & 2033
- Table 26: Nordics Gene Synthesis Revenue (million) Forecast, by Application 2020 & 2033
- Table 27: Rest of Europe Gene Synthesis Revenue (million) Forecast, by Application 2020 & 2033
- Table 28: Global Gene Synthesis Revenue million Forecast, by Application 2020 & 2033
- Table 29: Global Gene Synthesis Revenue million Forecast, by Type 2020 & 2033
- Table 30: Global Gene Synthesis Revenue million Forecast, by Country 2020 & 2033
- Table 31: Turkey Gene Synthesis Revenue (million) Forecast, by Application 2020 & 2033
- Table 32: Israel Gene Synthesis Revenue (million) Forecast, by Application 2020 & 2033
- Table 33: GCC Gene Synthesis Revenue (million) Forecast, by Application 2020 & 2033
- Table 34: North Africa Gene Synthesis Revenue (million) Forecast, by Application 2020 & 2033
- Table 35: South Africa Gene Synthesis Revenue (million) Forecast, by Application 2020 & 2033
- Table 36: Rest of Middle East & Africa Gene Synthesis Revenue (million) Forecast, by Application 2020 & 2033
- Table 37: Global Gene Synthesis Revenue million Forecast, by Application 2020 & 2033
- Table 38: Global Gene Synthesis Revenue million Forecast, by Type 2020 & 2033
- Table 39: Global Gene Synthesis Revenue million Forecast, by Country 2020 & 2033
- Table 40: China Gene Synthesis Revenue (million) Forecast, by Application 2020 & 2033
- Table 41: India Gene Synthesis Revenue (million) Forecast, by Application 2020 & 2033
- Table 42: Japan Gene Synthesis Revenue (million) Forecast, by Application 2020 & 2033
- Table 43: South Korea Gene Synthesis Revenue (million) Forecast, by Application 2020 & 2033
- Table 44: ASEAN Gene Synthesis Revenue (million) Forecast, by Application 2020 & 2033
- Table 45: Oceania Gene Synthesis Revenue (million) Forecast, by Application 2020 & 2033
- Table 46: Rest of Asia Pacific Gene Synthesis Revenue (million) Forecast, by Application 2020 & 2033
Frequently Asked Questions
1. What is the projected Compound Annual Growth Rate (CAGR) of the Gene Synthesis?
The projected CAGR is approximately 16.4%.
2. Which companies are prominent players in the Gene Synthesis?
Key companies in the market include Genescript, Thermo Scientific, Twist Bioscience, IDT, DNA 2.0 (ATUM), OriGene, Eurofins Genomics, BBI, Azenta Life Sciences, SBS Genetech, Bio Basic.
3. What are the main segments of the Gene Synthesis?
The market segments include Application, Type.
4. Can you provide details about the market size?
The market size is estimated to be USD 1905 million as of 2022.
5. What are some drivers contributing to market growth?
N/A
6. What are the notable trends driving market growth?
N/A
7. Are there any restraints impacting market growth?
N/A
8. Can you provide examples of recent developments in the market?
N/A
9. What pricing options are available for accessing the report?
Pricing options include single-user, multi-user, and enterprise licenses priced at USD 4900.00, USD 7350.00, and USD 9800.00 respectively.
10. Is the market size provided in terms of value or volume?
The market size is provided in terms of value, measured in million.
11. Are there any specific market keywords associated with the report?
Yes, the market keyword associated with the report is "Gene Synthesis," which aids in identifying and referencing the specific market segment covered.
12. How do I determine which pricing option suits my needs best?
The pricing options vary based on user requirements and access needs. Individual users may opt for single-user licenses, while businesses requiring broader access may choose multi-user or enterprise licenses for cost-effective access to the report.
13. Are there any additional resources or data provided in the Gene Synthesis report?
While the report offers comprehensive insights, it's advisable to review the specific contents or supplementary materials provided to ascertain if additional resources or data are available.
14. How can I stay updated on further developments or reports in the Gene Synthesis?
To stay informed about further developments, trends, and reports in the Gene Synthesis, consider subscribing to industry newsletters, following relevant companies and organizations, or regularly checking reputable industry news sources and publications.
Methodology
Step 1 - Identification of Relevant Samples Size from Population Database


Step 2 - Approaches for Defining Global Market Size (Value, Volume* & Price*)

Note*: In applicable scenarios
Step 3 - Data Sources
Primary Research
- Web Analytics
- Survey Reports
- Research Institute
- Latest Research Reports
- Opinion Leaders
Secondary Research
- Annual Reports
- White Paper
- Latest Press Release
- Industry Association
- Paid Database
- Investor Presentations

Step 4 - Data Triangulation
Involves using different sources of information in order to increase the validity of a study
These sources are likely to be stakeholders in a program - participants, other researchers, program staff, other community members, and so on.
Then we put all data in single framework & apply various statistical tools to find out the dynamic on the market.
During the analysis stage, feedback from the stakeholder groups would be compared to determine areas of agreement as well as areas of divergence